
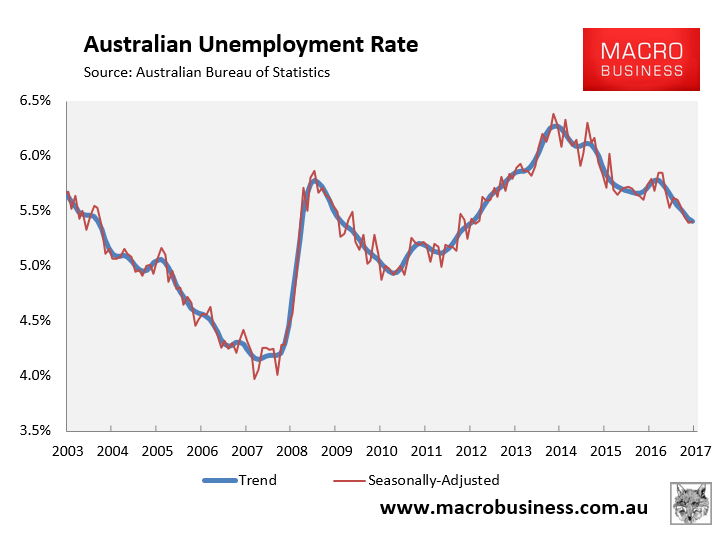
As summarised earlier, the Australian Bureau of Statistics (ABS) today released its labour force report for November, which registered a strong 61,600 increase in total employment but no change in the headline unemployment rate (still 5.4%).
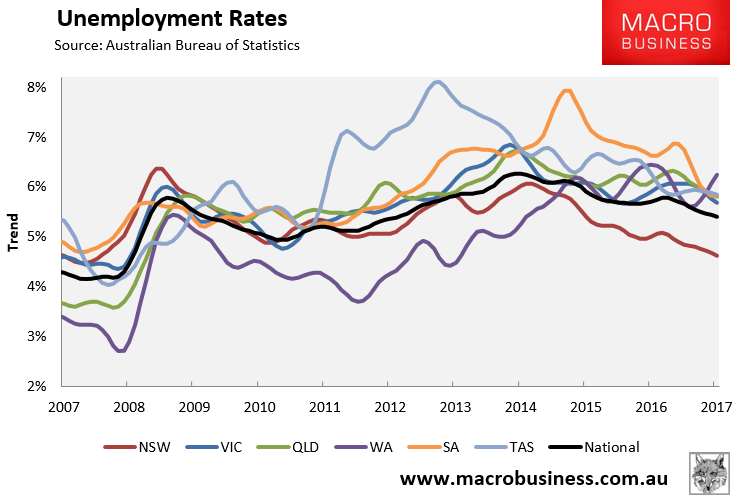
In trend terms, the unemployment rate fell marginally from 5.43% to 5.40% – the lowest level since December 2012:
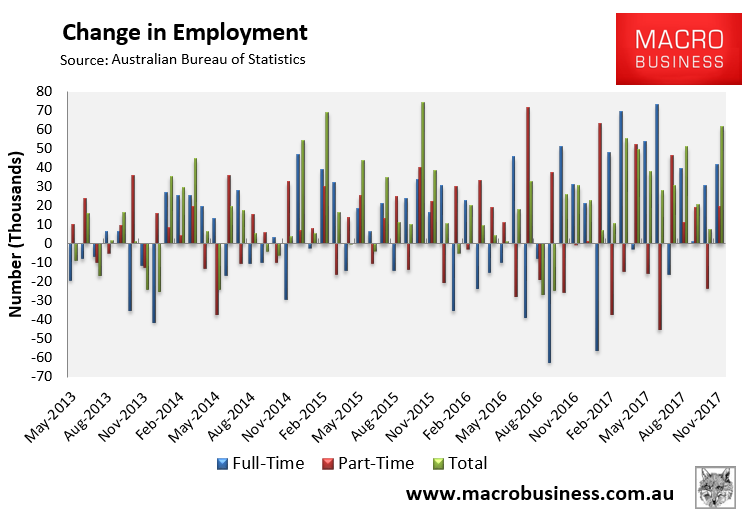
Again, total employment surged by a seasonally adjusted 61,600 to 12,403,000. Full-time jobs increased by 41,900, whereas part-time employment increased by 19,700:
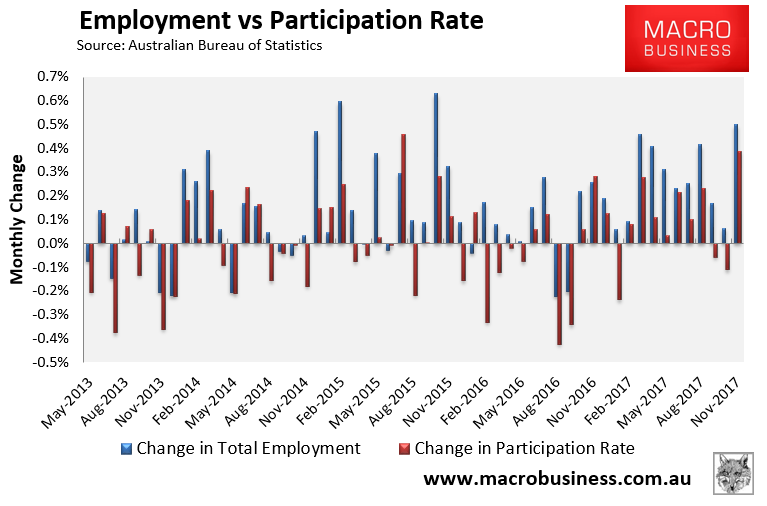
The participation rate rose 0.25% to 65.47%, which is why the unemployment rate was unchanged despite the surge in jobs:
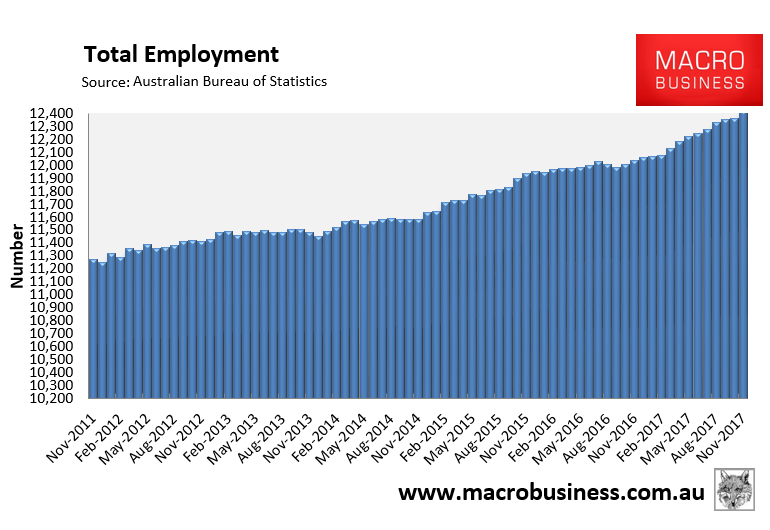
Total employment continues to rise:
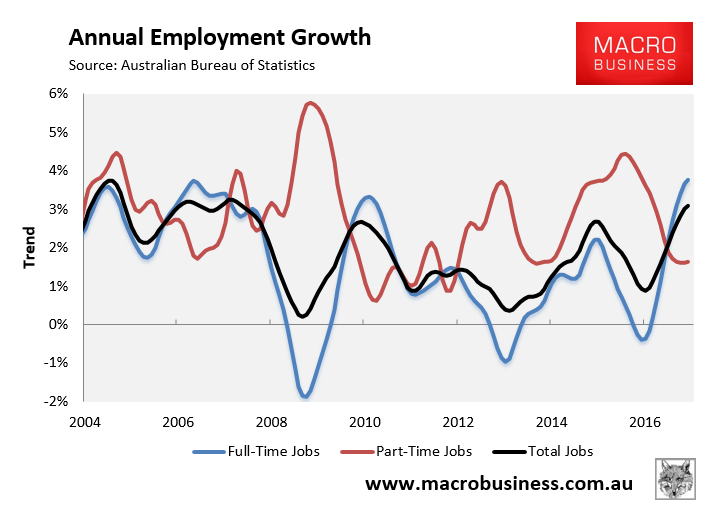
Trend annual employment growth continued to rise (+3.1%) and is now being driven by full-time employment (+3.8%), whereas part-time employment growth has fallen but is stable (+1.6%):
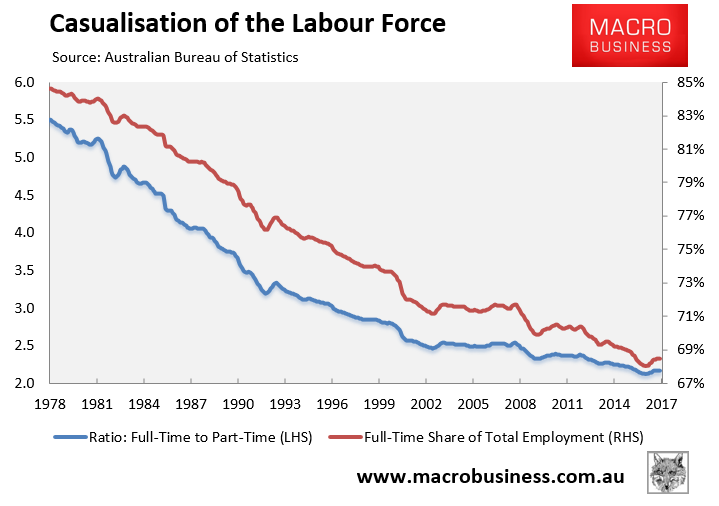
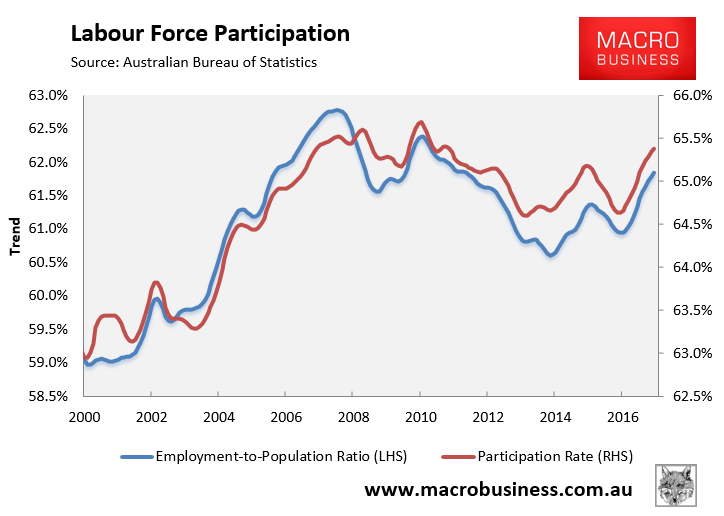
The proportion of the population in full-time work continues to rebound from last November’s all-time low:
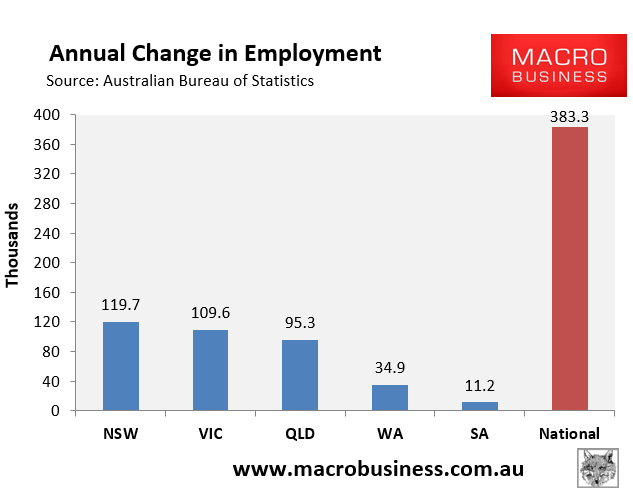
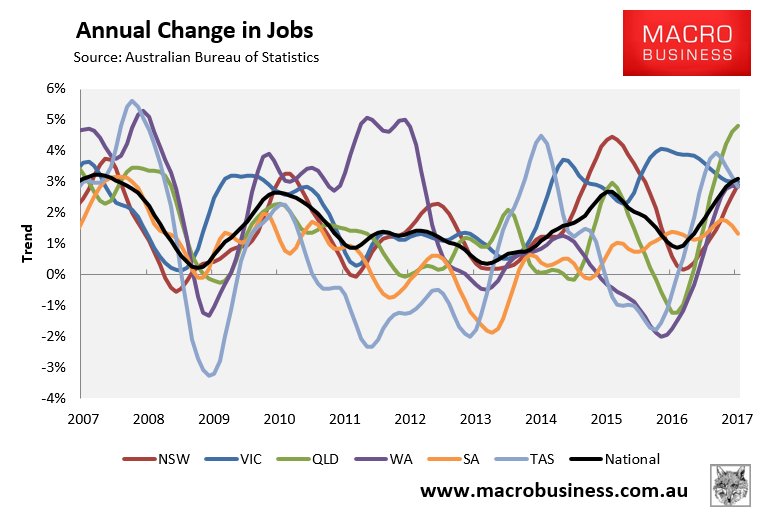
In November, NSW, VIC and QLD lead jobs growth over the past year in seasonally-adjusted terms:
The state seasonally-adjusted figures are notoriously volatile and subject to a big margin of error. As such, the below chart tracks state jobs growth in trend terms. Again, the three major jurisdictions have driven the jobs growth:
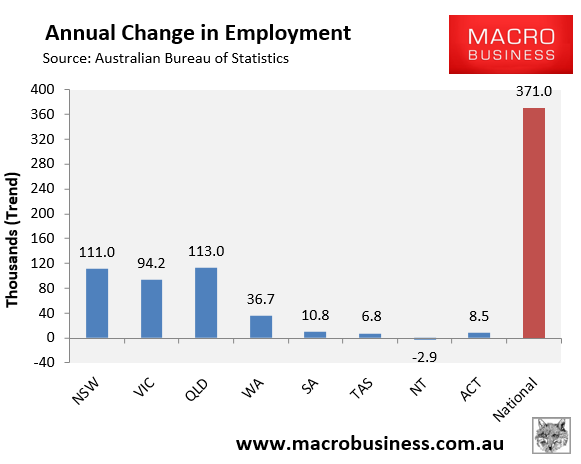
All states are now experiencing annual jobs growth in trend terms, with QLD’s by far the strongest:
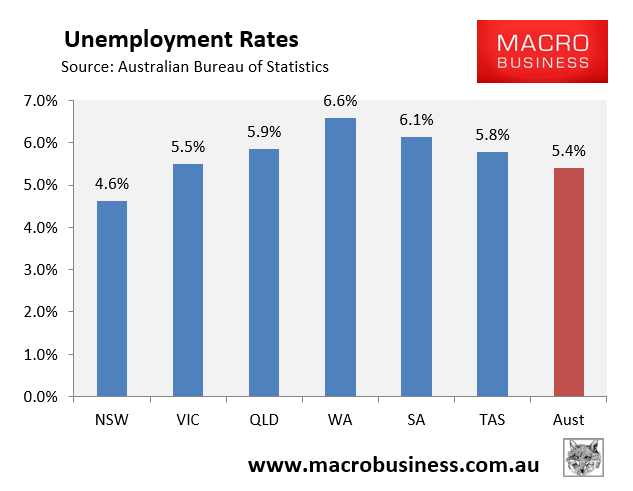
WA now has the highest seasonally adjusted unemployment and NSW by far the lowest:
The below chart shows the ABS’ trend unemployment rates, which again shows NSW with by far the lowest unemployment and WA with the highest:
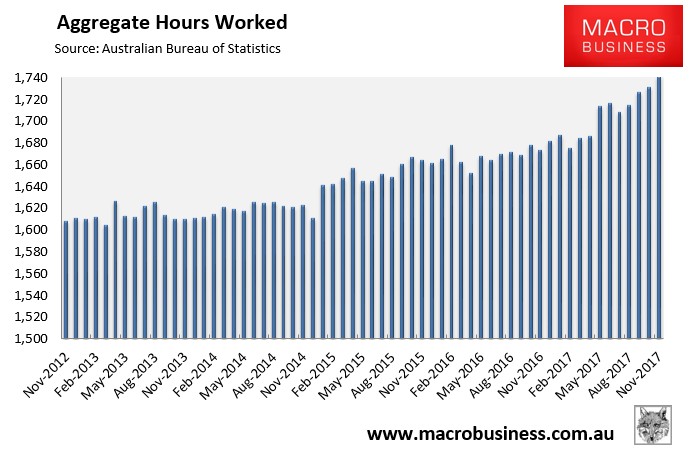
The aggregate number of hours worked rose in November in seasonally adjusted terms. Total hours worked rose by 9.8 million hours or 0.57% in November. Hours worked have also risen by 4.0% over the past year:
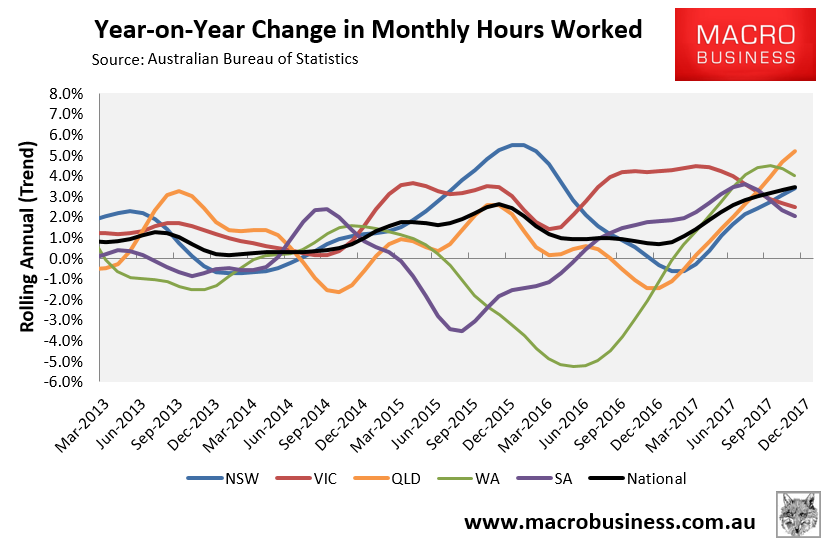
The below chart, which tracks the annual change in hours worked on a trend basis, paints an improving picture, with broad-based growth across jurisdictions and 3.4% growth nationally:
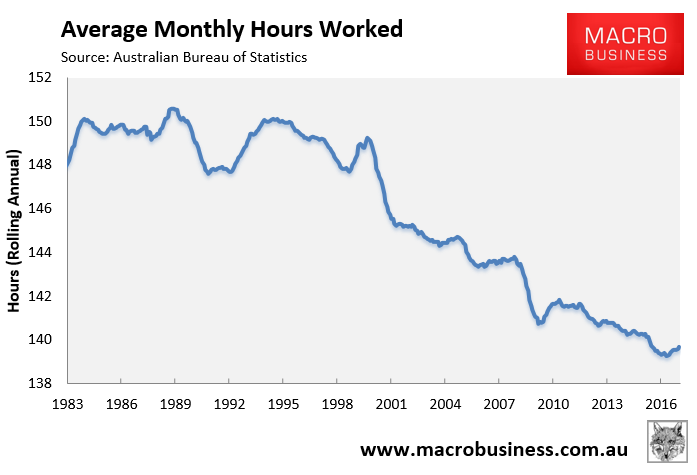
Average average hours worked have also rebounded from April’s all-time low:
Meanwhile, workforce participation continues to rebound in trend terms:
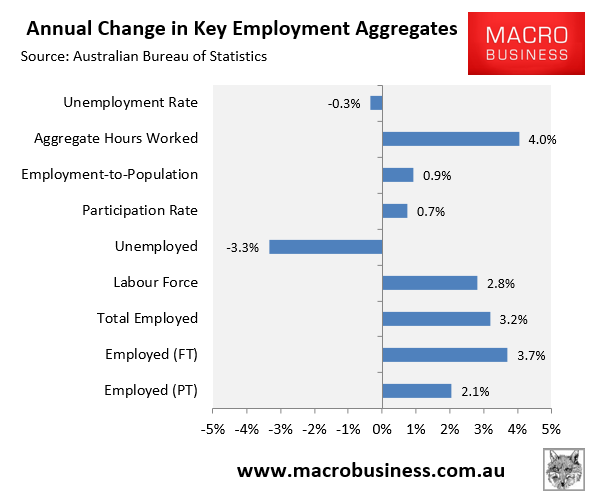
The next chart summarises the annual change in the key employment aggregates on a seasonally-adjusted basis, which shows a broadly recovering labour market:
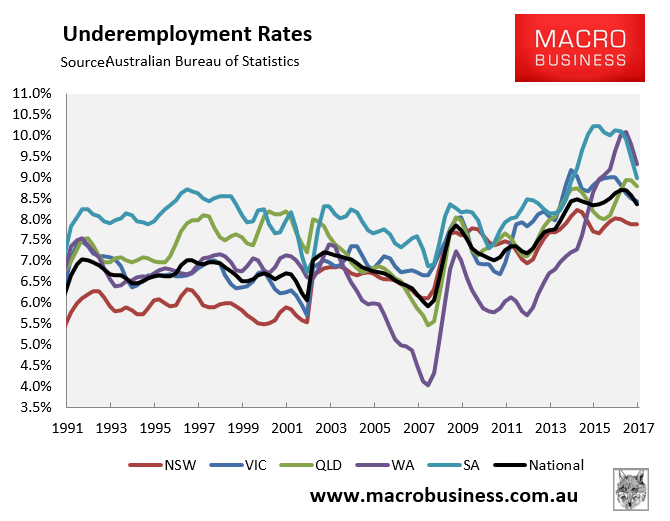
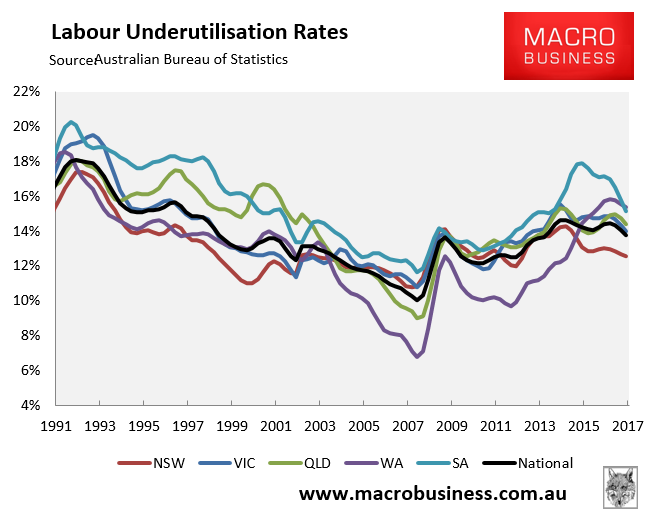
Finally, both underemployment and labour underutilisation retraced in the November quarter, but remain at stubbornly high levels:
This is unequivocally another positive jobs report as the late-cycle Botox Boom rolls-on.
How long the momentum can be maintained remains to be seen, given the pending peaking of housing construction and prices.
unconventionaleconomist@hotmail.com
