Property investors drive fall in household financial confidence

By Martin North, cross-posted from the Digital Finance Analytics Blog:
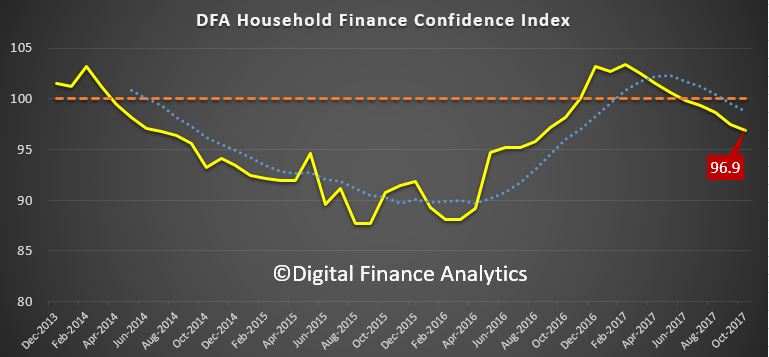
The latest edition of the Digital Finance Analytics Household Financial Security Confidence Index to end October shows households are feeling less secure about their finances than in September. The overall index fell from 97.5 to 96.9, and remains below the 100 neutral setting. We use data from our household surveys to calculate the index.
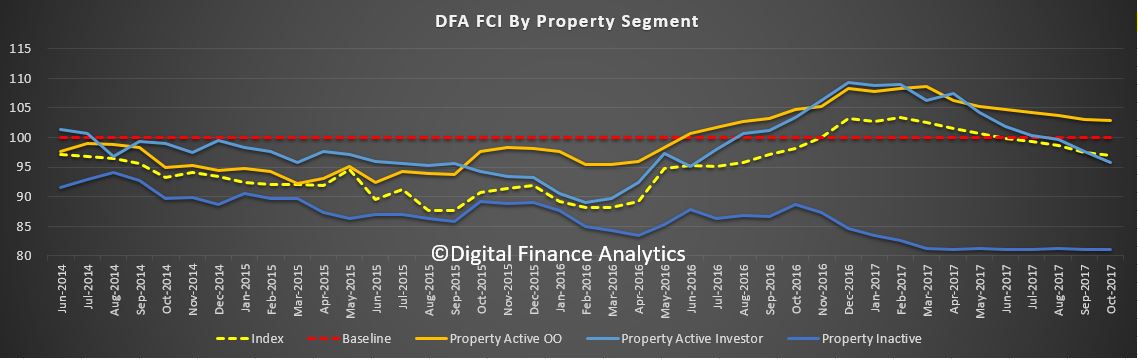
While households holding property for owner occupation remain on average above the neutral setting, property investors continue to slip further into negative territory, as higher mortgage rates bite, rental returns slide and capital growth in some of the major markets stalls. Those property inactive households remain the most insecure however, so owning property in still a net positive in terms of financial security.
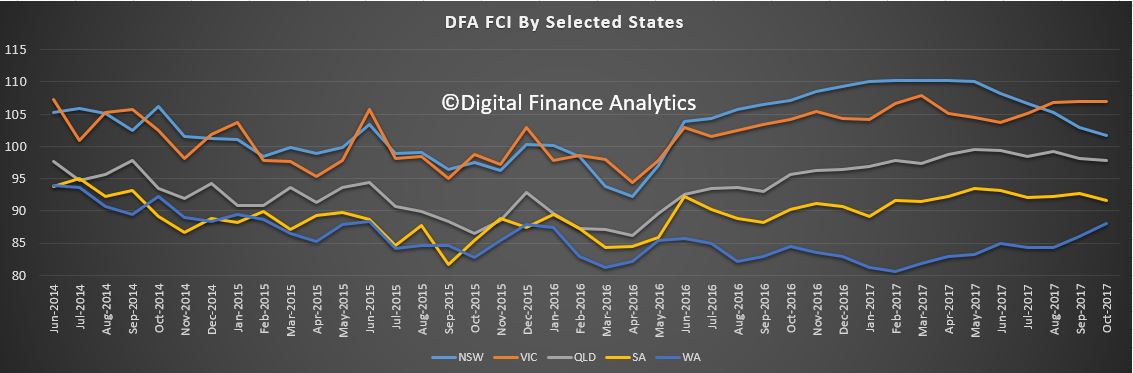
There are significant variations across the states. VIC households continue to lead the way in terms of financial confidence, and WA households are moving up from a low base score. However, households in NSW see their confidence eroded as prices slide in some post codes (the average small fall as reported does not represent the true variation on the ground – some western Sydney suburbs have fallen 5-10% in the past few months). Households in QLD and SA on average have held their position this month.
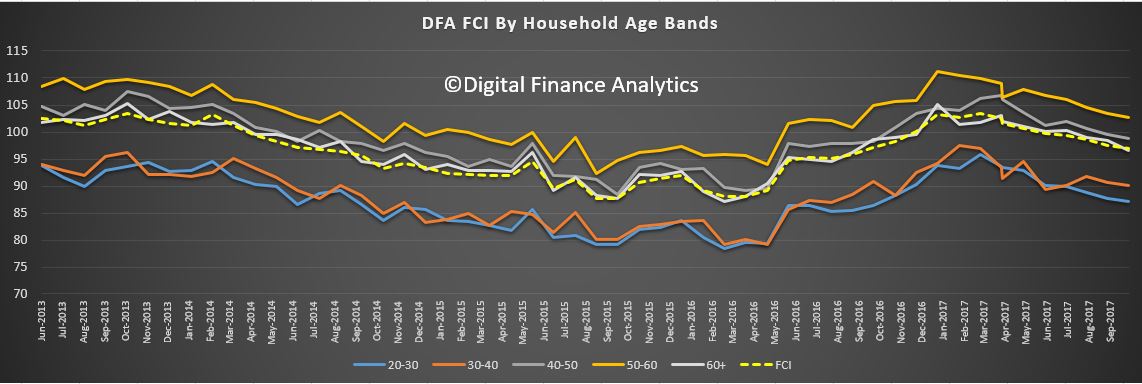
Confidence continues to vary by age bands, although the average scores have drifted lower again. Younger households are consistently less confident, compared with older households, who tend to have smaller mortgages relative to income, and more equity in property and greater access to savings.
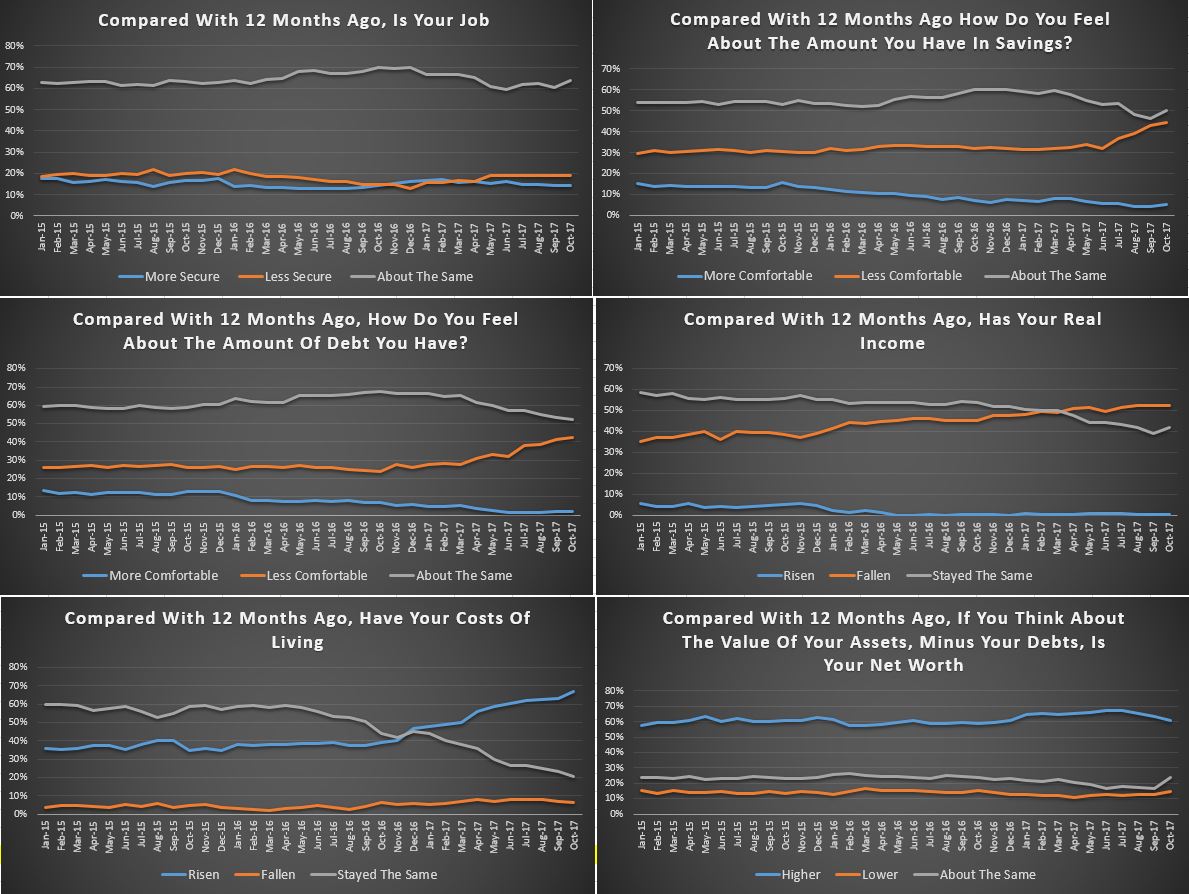
Looking in more detail at the FCI scorecard, 63% of household saw no change in their job prospects last month, while 19% felt less secure, especially in WA and SA. Those with savings were a little less comfortable, reflecting both a net reduction in the amount saved (more households are raiding their savings to cover their costs of living) and lower interest rates on deposits. Those with shares and other investments benefited from higher stock prices.
The burden of debt weighed heavy on many households with 42% of households less comfortable with their debt, a rise of 1.4% in the month. Some were concerned about potential interest rate rises, while others, especially those on interest only loans, were exercised by the prospect of having to refinance down the track.
More than half of households say their real incomes have fallen in the past year, and 67% said their costs of living have risen, up 4.1% from last month. Utility bills are higher, as are child care costs and school fees. We see more household relying on multiple part-time jobs to bring in sufficient income to pay the bills, and even then many are having to tap into savings to keep afloat.
We see little evidence of income growth in real terms, while credit growth continues at more than three time income. Given the recent slide in property values, and continued rises in living costs, we do not expect the index to move back into positive territory in the next few months.
By way of background, these results are derived from our household surveys, averaged across Australia. We have 52,000 households in our sample at any one time. We include detailed questions covering various aspects of a household’s financial footprint. The index measures how households are feeling about their financial health. To calculate the index we ask questions which cover a number of different dimensions. We start by asking households how confident they are feeling about their job security, whether their real income has risen or fallen in the past year, their view on their costs of living over the same period, whether they have increased their loans and other outstanding debts including credit cards and whether they are saving more than last year. Finally we ask about their overall change in net worth over the past 12 months – by net worth we mean net assets less outstanding debts.
We will update the results again next month.