Much is being made of the record level of household debt in Australia. The media is full of stories screaming about the risks of debt for the economy.
Debt is high, for sure, but for anyone who undertakes sober and factual analysis of the household debt issue and judges the overall financial position of the household sector and not just debt, there is little to be worried about.
It is vitally important to realise that households do not take on that debt and throw the cash away. On the contrary.
Debt is used to buy assets which includes things like housing, commercial property and shares. For the bulk of the population with little or no debt, they are coincidently squirrelling away their savings and are accumulating wealth.
…While it can and never will happen, this fact indicates that householders could ‘cash out’ their financial assets, pay off all their debt and still be left with a couple of trillion dollars or around 225 per cent of household disposable income in left over cash.
That is a sound start to analysing the household sector’s balance sheet and puts the kybosh on the ‘debt disaster’ we hear so much about.
Now let’s look at another part of the household sector’s balance sheet, assets in housing. The total value of housing in Australia is hovering around $7 trillion – yes trillion – which is over 500 per cent of disposable income. In the mid 1990s, this ratio was under 300 per cent. This wealth accumulation in housing has been phenomenal.
It means, quite simply, that while the household debt to income ratio has risen by around 125 percentage points over 25 years, assets in housing alone have risen around 225 per cent of household income.
When all household assets are tallied, they total just under 1,000 per cent of annual income, which looked at another way, is a multiple of 10.
This means that the net level of household wealth (total assets minus total liabilities) is currently just under 800 per cent of income. It has never been higher. Net assets have risen from around 450 per cent of income in the mid 1990s.
Or another way, for every $1 of debt that the house sectors has, they have $5 of assets, which is a loan to value ratio of 20 per cent.
Given peace has broken out between Kouk and MB I will be nice.
Household debt presents two obvious problems. The first is that it weighs on consumption decisions because folks are so busy worrying about paying it back and that leads to lackluster demand. Australia? Tick.
Advertisement
The second problem is that the debt is not evenly distributed. Indeed, as UBS has done such a good job of explaining in its various consumer surveys, it is very unevenly distributed, and those on the margin are both numerous and at risk of failure. Australia? Tick.
Debt busts like those we have seen oversees do not come from the centre of sensible borrowers. They come from the margins where leverage is extreme. If those margins are big enough then a shock will destabilise them and, in so doing, knock a big, fat hole in the banking system. From there it is all academic as the banks pull in lending and distress begins to mushroom through the economy towards its centre as, poof, all that housing equity evaporates.
Are those margins big enough in Australia? Tick. $500bn in “liar loans” qualifies:
Advertisement
One of the key areas of focus of the 2017 UBS Evidence Lab Australian Mortgages survey was to assess the level of factual accuracy in mortgagor’s applications. While there has been anecdotal evidence for many years that customers are not always accurate in their application, we were lacking hard evidence. As a result the UBS Evidence Lab asked participants who had recently taken out a mortgage the degree of factual accuracy in their application.
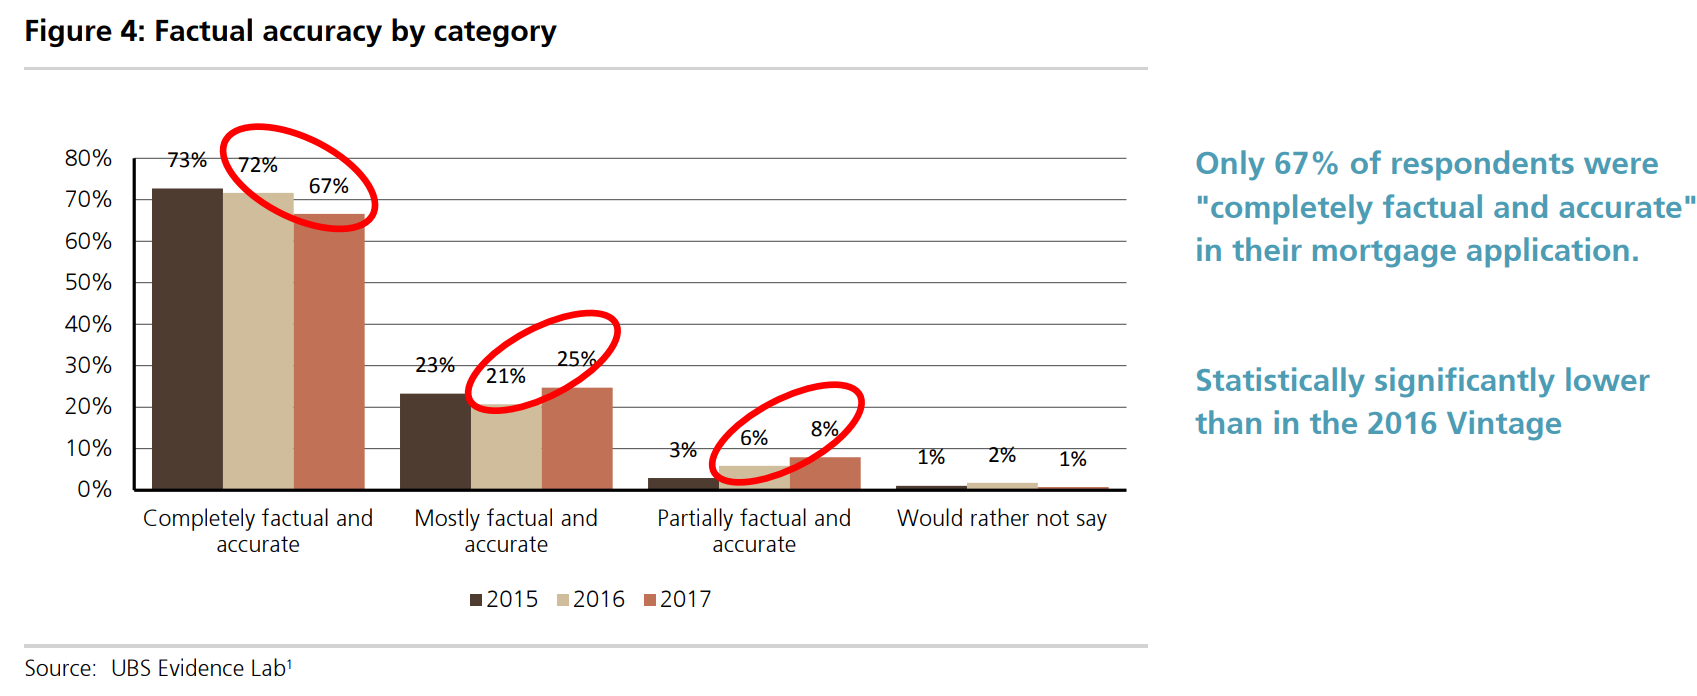
The results of this survey were disappointing, with only 67% of participants stating their mortgage application was “completely factual and accurate”. This is a statistically significant fall from the results of the 2015 and 2016 Vintages.
This was offset by a statistically significant increase in respondents who stated their application was “mostly factual and accurate” (25% up from 21% in the 2016 Vintage) and “partially factual and accurate” which reached 8% of applications (up from 6% in the 2016 Vintage and 3% in the 2015 Vintage).
We see these results as disturbing and difficult to reject given approximately onethird of participants stated their application was not entirely factual and accurate.
Further, it is highly unlikely respondents would have stated that they misrepresented their mortgage application when in fact they were truthful. If anything, we believe it is more likely these figures may understate the level of misrepresentation in mortgage applications as some respondents may not want to state they were less than completely accurate despite the anonymity of this survey.
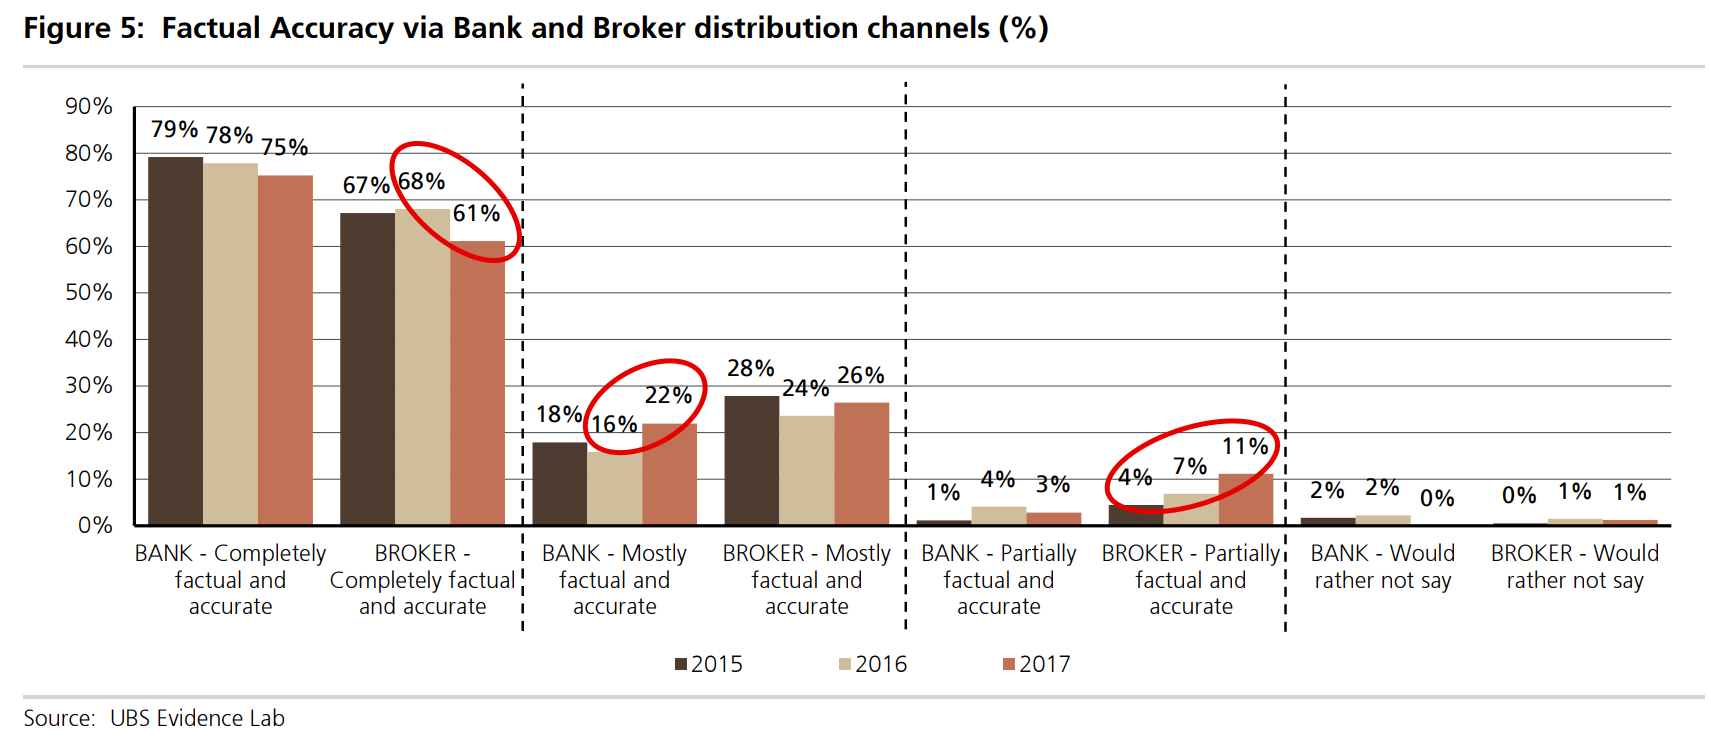
During the 2017 Survey we found a statistically significantly higher level of factual inaccuracy via the broker channel than via the bank’s proprietary networks.
However, the level of factually inaccuracy has risen across both channels. In the 2017 Vintage only 61% of participants who undertook broker originated mortgages stated they were completely factual and accurate. This is down from 68% in 2016. This compares to 75% of customers stating they were factually accurate via the bank’s proprietary networks. Of concern 11% of participants who took out a mortgage via the broker channel in 2017 stated their application was only “partially factual and accurate”. This is a statistically significant increase from both the 2015 Vintage (4%) and 2016 Vintage (7%).
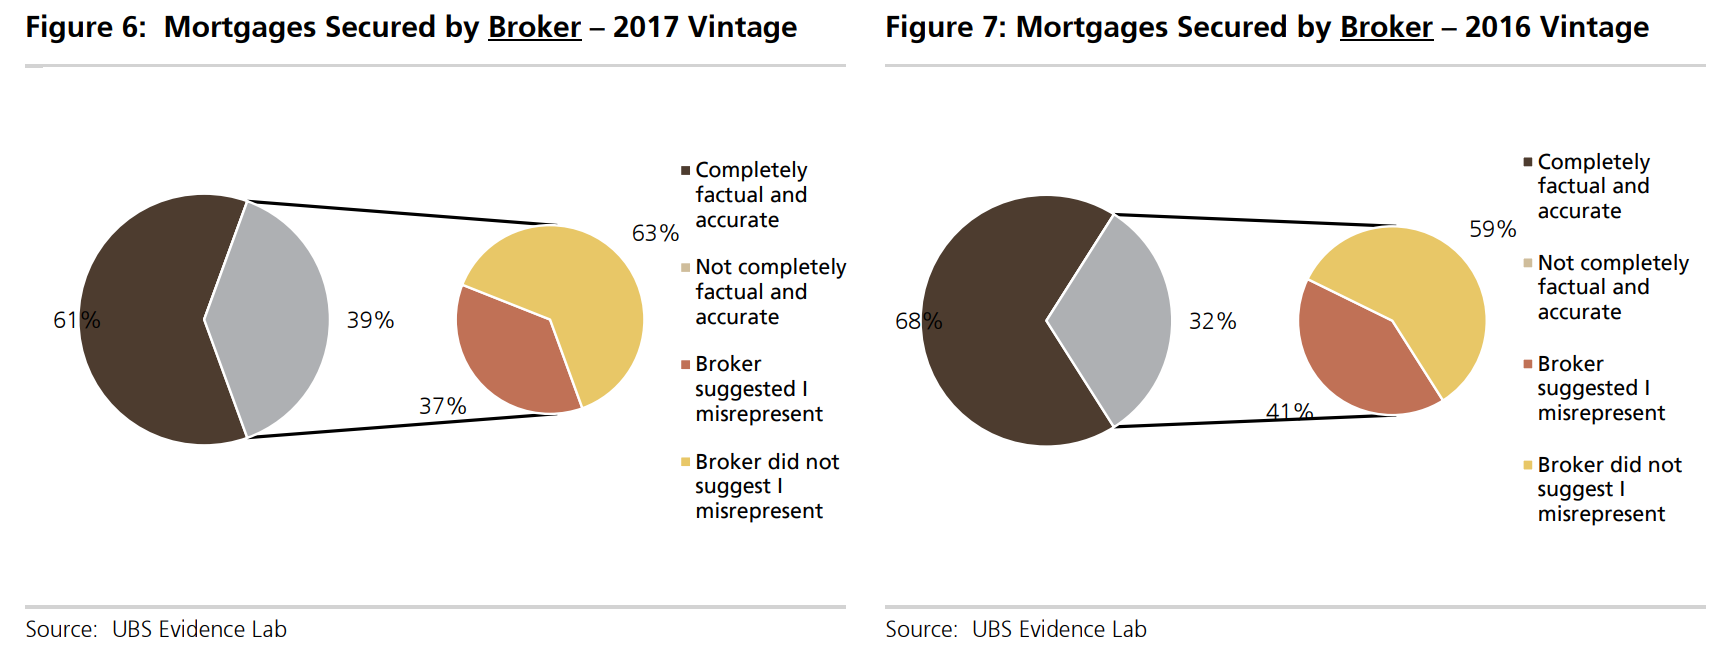
While the significant level of mortgage misrepresentation is a concern, we are more concerned that a substantial number of applicants continue to state that their mortgage consultant suggested they misrepresent their documentation.
David Llewellyn-Smith is Chief Strategist at the MB Fund and MB Super. David is the founding publisher and editor of MacroBusiness and was the founding publisher and global economy editor of The Diplomat, the Asia Pacific’s leading geo-politics and economics portal.
He is also a former gold trader and economic commentator at The Sydney Morning Herald, The Age, the ABC and Business Spectator. He is the co-author of The Great Crash of 2008 with Ross Garnaut and was the editor of the second Garnaut Climate Change Review.