
By Gareth Aird, senior economist at CBA:
Key Points:
- Electricity prices spiked in Q3 2017 and will make a material contribution to the headline CPI.
- We estimate that power prices, as measured in the CPI, will lift by 15% in Q3 2017 and will add 0.51ppts to the quarterly growth rate.
- Energy consumption is non-discretionary and the big rise in power prices is akin to a tax on households.
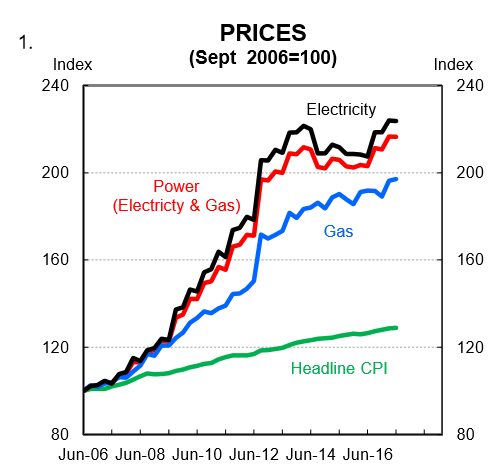
The soaring price of electricity in Australia has become a hot topic in both State and Federal politics. Power prices have risen significantly over the past decade (chart 1). The news has worsened since 1 July 2017 as most households (and business) have been hit with a further surge in the price of electricity and gas.
The latest spike in power prices has not been uniform across the country. For the individual household, the change in the price of power is very much dependent on their location and energy provider. But at a national level, prices have risen significantly. The average increase in power prices will be picked up in the Q3 CPI when it prints on 25 October 2017.
In this short note we provide our forecast for the recent rise in power prices, its estimated impact on the Q3 2017 CPI and the wider implications of higher energy prices on inflation and consumption.
Weighting in the CPI
Utilities in the CPI basket comprise three subgroups: (i) water and sewerage; (ii) electricity; and (iii) gas and other household fuels. The utilities weighting in the CPI was 4.39% in Q2 2017. The power prices component of the CPI (defined as the subset of electricity and gas and other household fuels) was worth 3.39% of the overall basket.
Estimates
There is a seasonal pattern to power prices. In general, price rises tend to be in the September quarter each year and are relatively stable throughout the rest of the year. Of course consumer energy bills vary over the year. But that is because they reflect not just changes in price but also changes in usage. For the CPI, energy prices are simply based on the change in the total cost for a fixed amount of consumption in each period. No quality adjustments are generally applied, but any change in average household consumption is excluded from price changes.
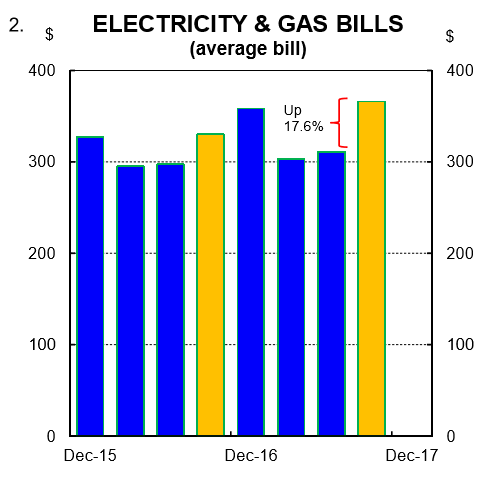
We have analysed the average change in power bills for CBA customers based on debit card and BPay transactions. The data is quite volatile. But it indicates that the average power bill lifted by 17.6% over Q3 2017 (chart 2).
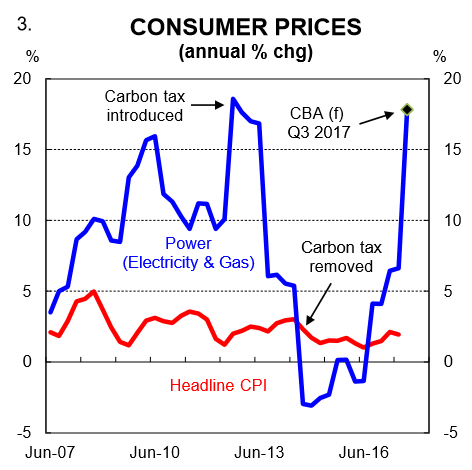
Again, we note that this is picking up both changes in price as well as consumption. However, if we assume a small lift in the volume of energy consumption between Q2 and Q3 (as has generally been the case historically), then a price spike of around 15% in energy prices over Q3 seems a reasonable estimate of what we are likely to see in the Q3 2017 CPI (chart 3).
Working with a 15% surge in energy prices over Q3 means that the direct contribution to the headline CPI will be a whopping 0.51ppts. That is very similar to the impact that the carbon tax had on power prices and the headline CPI in Q3 2012. Some sensitivity analysis shows that if prices rise by 10% then it will push up the headline CPI by 0.34ppts. A 20% rise in power prices would add 0.68ppts to the Q3 CPI.
In Q3 last year power prices rose by 4.0% and contributed 0.13ppt to the quarterly change in the CPI. That increase will drop out of the annual calculations.
Implications
At this stage our preliminary forecast is for the headline CPI to rise by 0.9% in Q3 2017 which would push the annual rate up to 2.1% (this assumes a 15% lift in power prices). The underlying CPI on our forecasts will print at 0.5% taking the annual rate to 2.0%. The lift in power prices will not impact core inflation given it will be outside of the middle 70 per cent of the distribution of expenditure classes. We will publish our detailed CPI P review during the week of 16 October 2017.
Of course the impact of the recent spike in energy prices to the economy extends beyond the direct Q3 CPI. To households, higher energy prices operate like a tax. Energy usage can be tweaked at the margin, but in general it is something that all households must consume.
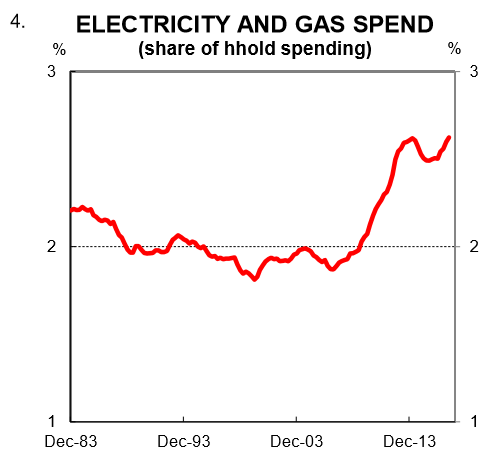
Over the past eight years households have had to devote a greater share of their wallet to paying energy bills because the rise in power prices has significantly outpaced household income growth (chart 4). In other words, energy price hikes greater than income reduce the pool of money available to households to spend on other goods and services. Ultimately this weighs on consumption growth. The fall in retail sales over July and August may be partly an early reaction to the recent spike in power prices.
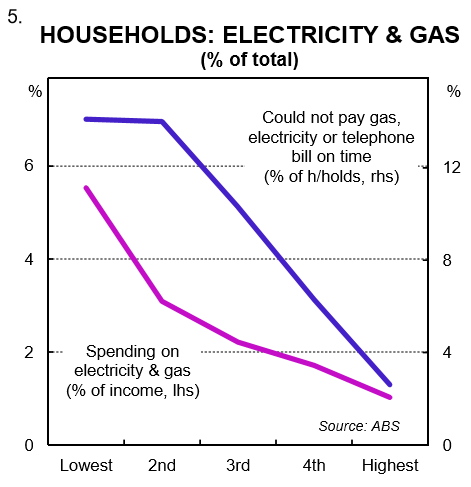
Higher power prices most directly impacts households at the lower end of the income spectrum who spend a greater proportion of their income on utilities (chart 5). With this in mind, we think the second round impact of higher power bills may ultimately prove disinflationary on the rest of the consumer basket as the growth in demand for other goods and services is negatively impacted.
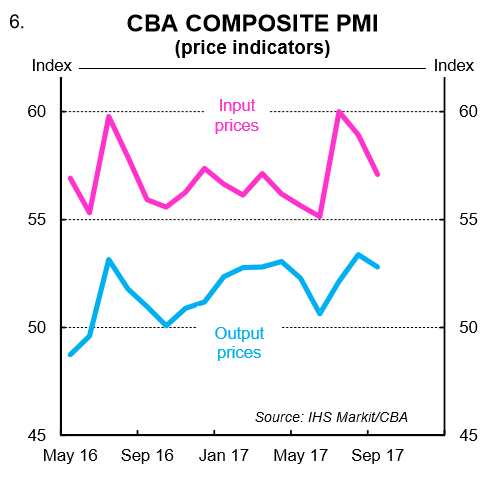
From a monetary policy perspective, the RBA will largely look through the step up in headline inflation. The pulse of core inflation and wages is far more important for the outlook for rates. On that, the labour market needs to tighten a lot further for wages inflation to rise beyond the contribution that the increase in the minimum wage with have on the Wage Price Index. The lift in energy prices will not help the bargaining position of employees for higher salaries given higher energy prices are also driving a solid growth in business input costs as evidenced in the CBA/Markit PMI (chart 6). And as stated previously, it’s weighing on household expenditure for other goods and services.
There are very few winners from a spike in electricity prices and that is why it’s become an issue in the economic and policy debate.