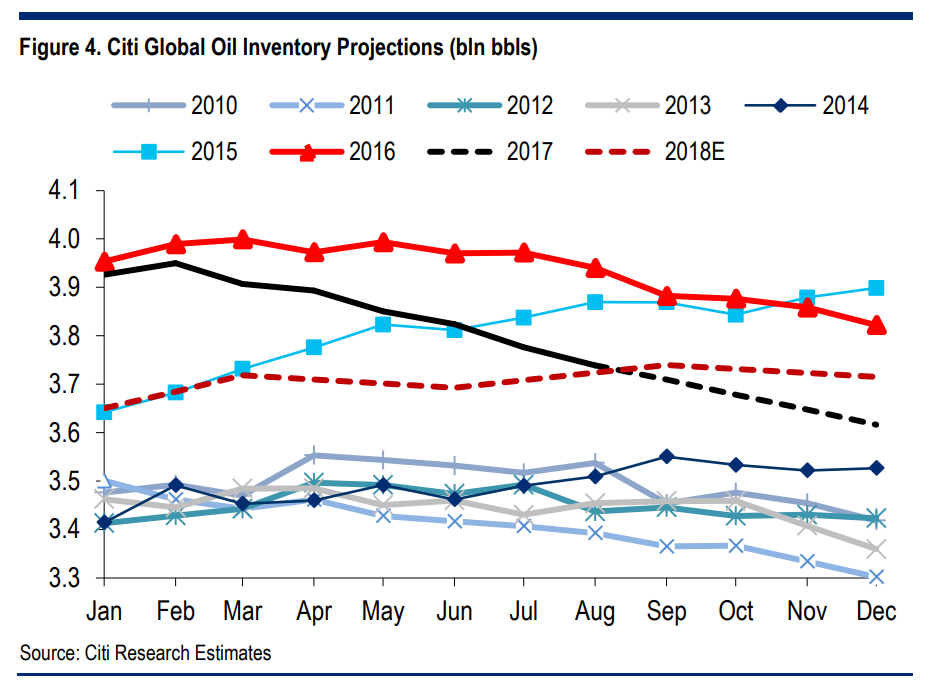
The market is still digesting the potential impact of Hurricane’s Harvey, Irma and Katia on oil balances but focus is likely to soon turn to the IEA’s September OMR that is published this Wednesday. The Paris-based agency’s August report caused a stir given the sizeable downward revisions to its headline oil demand estimates for 2015-18. This set a markedly bearish tone to the report from an agency that is widely regarded as the benchmark publisher for oil markets balances. Equally, if not more importantly, it called into serious question the reliability of the IEA as the world’s benchmarking agency for understanding main oil market changes both in direction and magnitude. To us the revision, especially the 0.9-m b/d drop in 3Q’17 demand, seemed out of kilter with market realities given the IEA’s forecast for implied oil stock changes (with actual July-17 OPEC production used as a forecast) in 2H’17 are vastly different to observed stocks data over the last few months. We believe this is also particularly important for 2018 oil balance estimations given the “error-term” between actual and implied stock changes should always be accounted for when projecting forward estimations for changes in global oil inventories.
IEA lowered its global oil demand estimates by 0.2-0.4-m b/d for 2015-18 whilst the biggest quarterly revision was for 3Q’17 and totaled -0.86-m b/d. The revisions stemmed from a reduction in 2015 and 2016 baseline global oil demand figures, which were cut by 0.2-m b/d and 0.4-m b/d. The major source of bearishness in the revisions comes from the large cuts to 2H oil demand estimates with 16, 17 and 18, seeing cuts of 0.6-m b/d, 0.7-m b/d and 0.6-m b/d respectively. Using the IEA’s new oil demand estimates as well as using its July-17 OPEC crude production estimate as a forecast, its global supply/demand imbalance in 2H’17 is +0.1-m b/d which is a stark contrast to Citi’s estimate of -1.0-m b/d. Weekly observed inventory data tends to support Citi’s view so far, with crude and refined product stocks down ~1.0-m b/d QTD whilst when including US “Other Oils” and propane, weekly stocks have fallen ~0.5-m b/d QTD. Monthly data so far show even bigger inventory draws as a flatter curve structure for crude and refined product futures has caused an unwind of floating oil inventories. Our global oil stocks measure shows a ~1.5-m b/d stock-draw in July whilst data so far for August show a stock-draw of ~1.2-m b/d. Even when comparing 2Q’17 stock changes, Citi estimates (-1.2-m b/d) are divergent from IEA estimates (-0.5-m b/d), whilst observed data falls in the middle of the two forecasts (-0.9-m b/d).
The full text of this article is available to MacroBusiness subscribers
David Llewellyn-Smith is Chief Strategist at the MB Fund and MB Super. David is the founding publisher and editor of MacroBusiness and was the founding publisher and global economy editor of The Diplomat, the Asia Pacific's leading geo-politics and economics portal.
He is also a former gold trader and economic commentator at The Sydney Morning Herald, The Age, the ABC and Business Spectator. He is the co-author of The Great Crash of 2008 with Ross Garnaut and was the editor of the second Garnaut Climate Change Review.