Wish me luck as I wave you goodbye, Morgan Stanley:
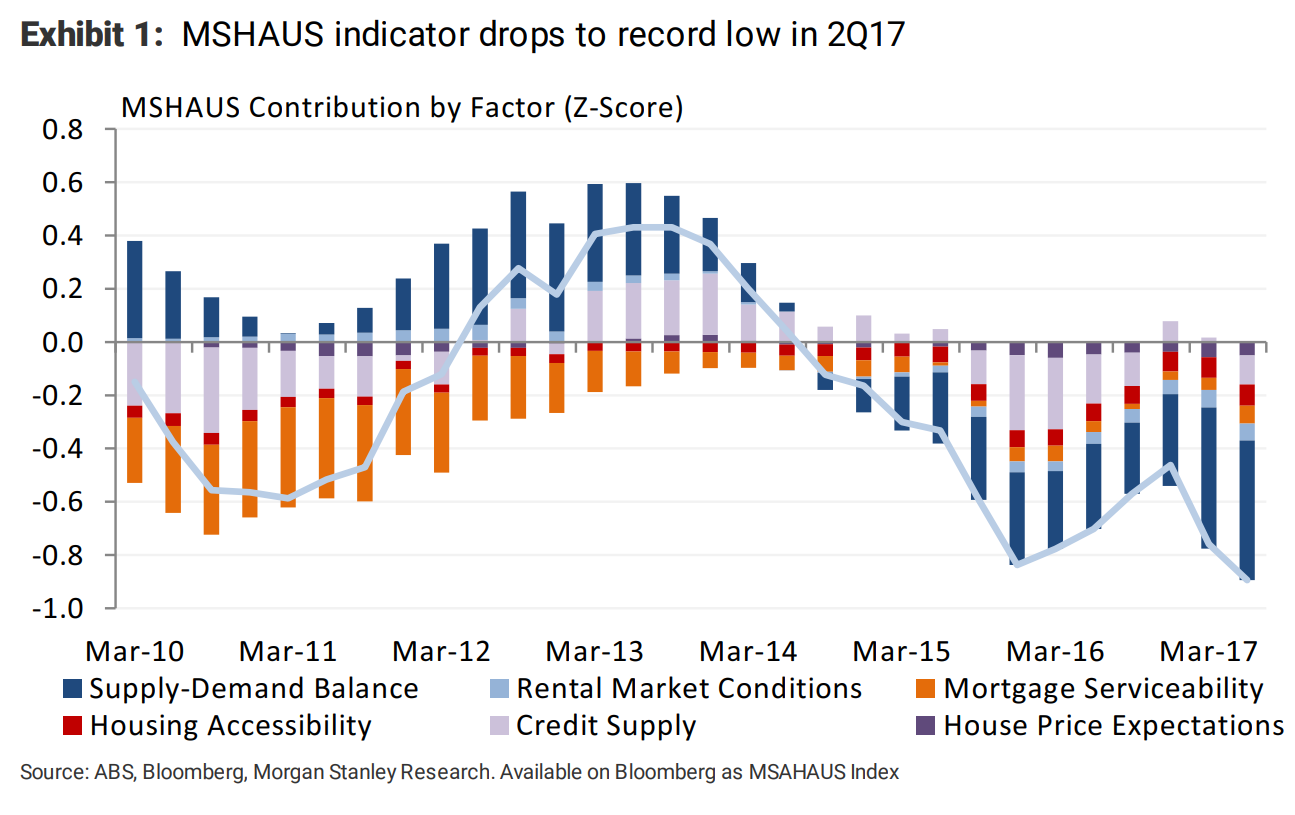
Our housing model, MSHAUS, declined to -0.9 in 2Q17 – marking a record-low in its 28-year history. This reflects the start of MacroPru-2 measures, strong supply growth and higher debt service on mortgage repricing. We look for further softening in approvals / price growth over the next 3 quarters.
New level of concern on housing: Updating our proprietary housing indicator for 2Q17 data (with an estimate for completions), we find MSHAUS has dropped to a new record low of -0.9, flagging a further pullback in approvals and price growth. The key incremental negative was the sharp fall in the share of interestonly (IO) mortgages,as the banks moved towards the MacroPru-2cap of 30%. We also saw the first signs of risinghousing debt service, on the back of mortgage repricing and new record-high debt levels. Survey measures of housing sentiment remain more downbeat than might be expected given the headline price growth of 9% over the last 12 months, with a 40-year low share of consumers nominating real estate as the wisest place for savings.
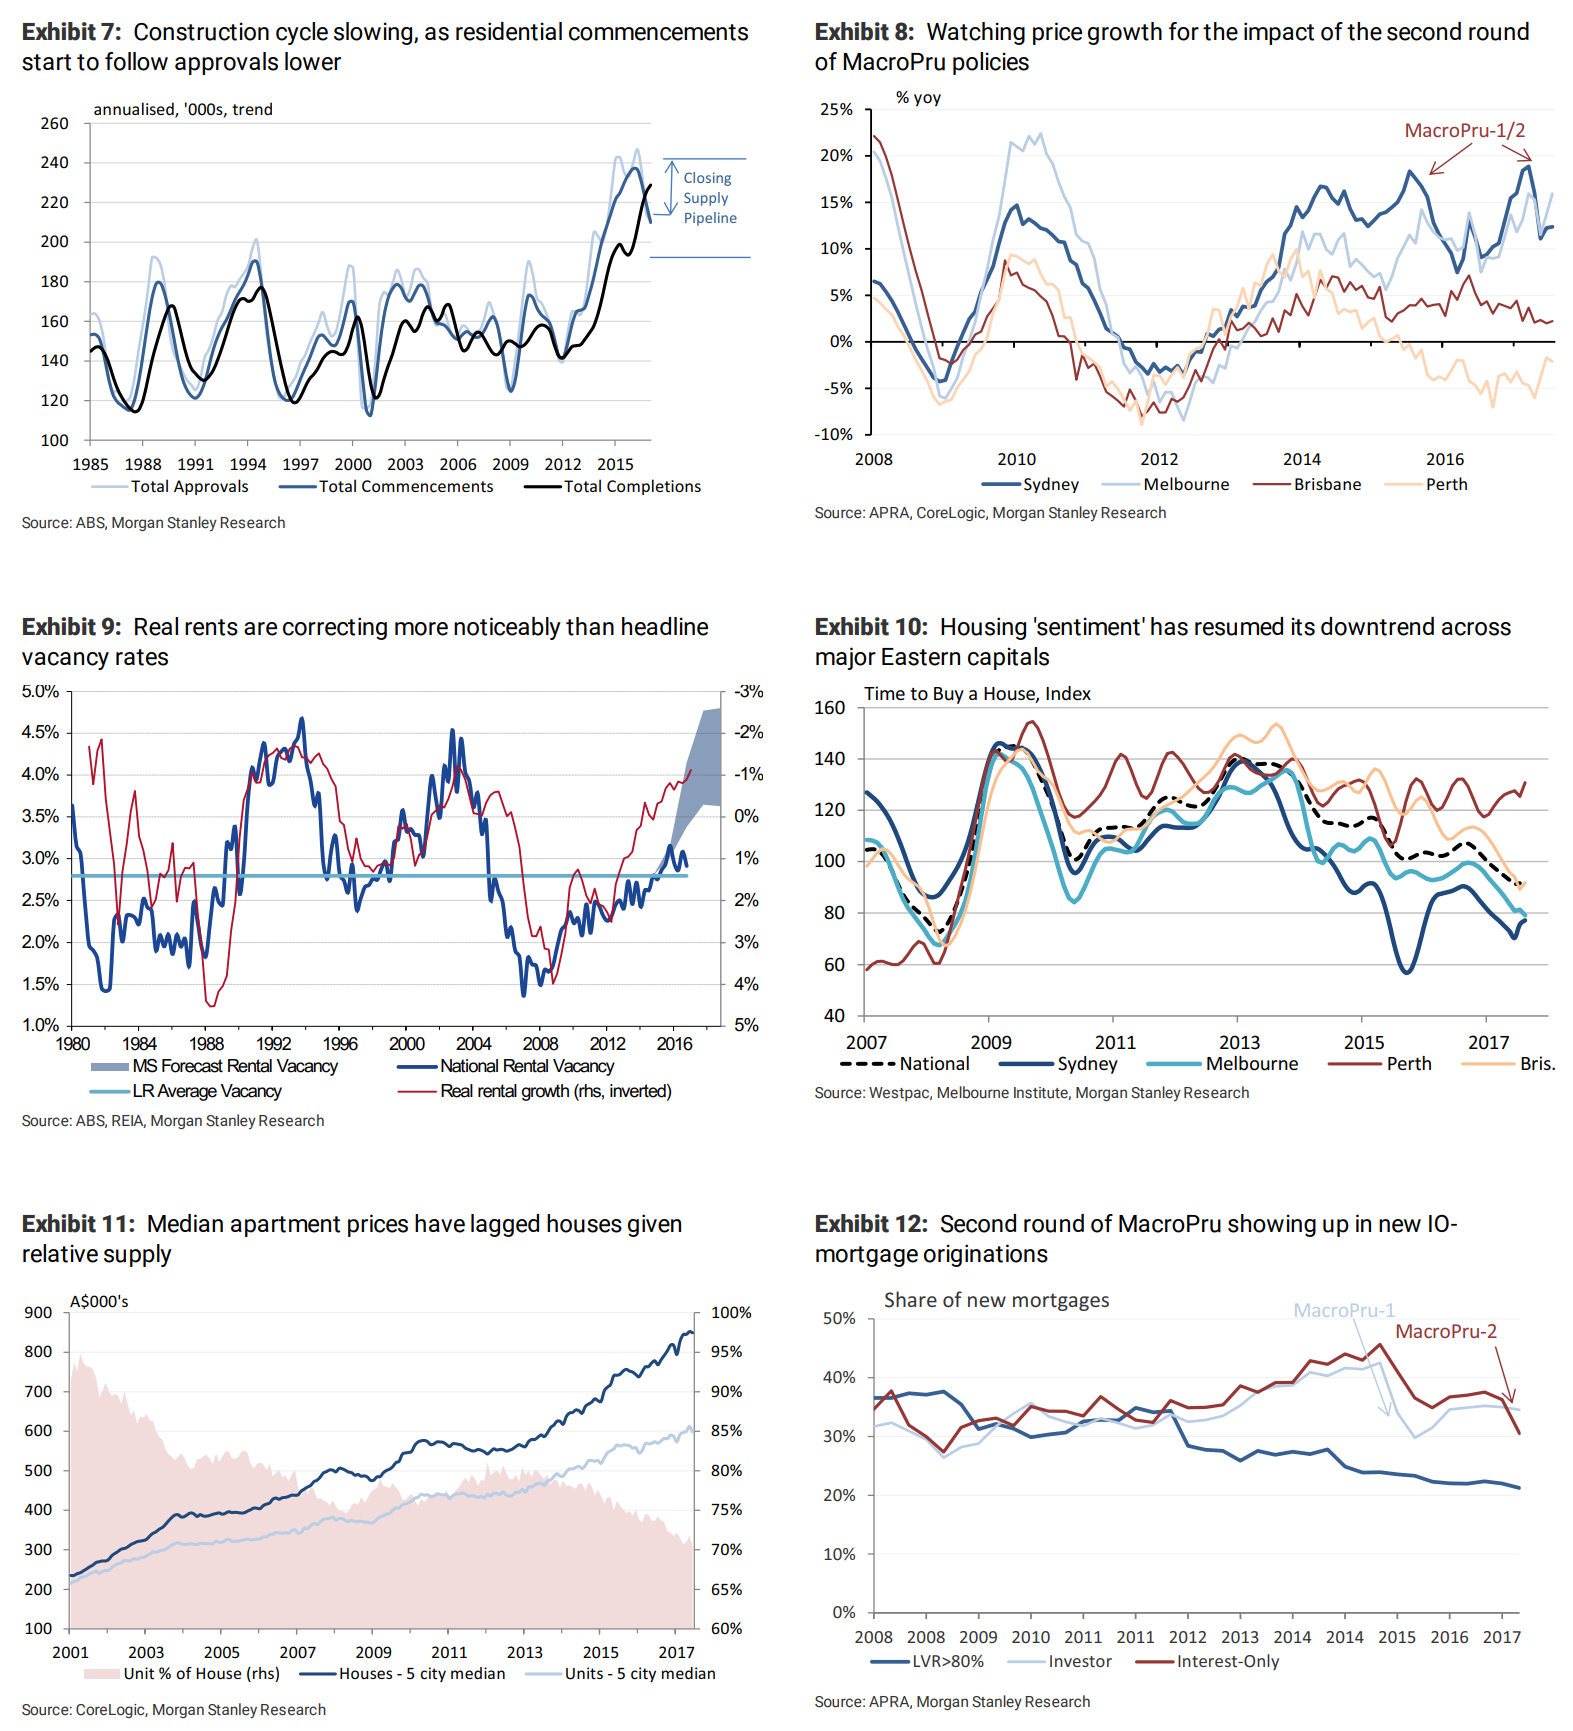
Interest-onlycap still hard to calibrate: The CFR’s MacroPrudential measures are captured in the ‘Credit Supply’ component of the MSHAUS model, but APRA data on high-LVR and IO lending is limited to the post-2007 period. While the -9ppt fall in the share of new IO mortgages from 38% in 2Q08 to 27% in 1Q09 coincided with a reported peak-trough -6% fall in dwelling prices, the broader dynamics of the financial crisis were of course far different. This cycle has seen the IO-share fall by -15ppt, from 46% in 2Q15 to 30% in 2Q17,albeit with more benign labour market dynamics. While prudential requirements on serviceability tests mean there should be no impact on borrowing capacity, we think that in reality this will be a negative (albeitunquantifiable). Similarly, the impact on households total debt service (P&I) should be negative, but the magnitude depends on the pace of switching, degree of repricing, the tenor or IO-periods and the extent to which banks provide extensions of such.
Softer physical market, cladding uncertainty: We expect annual supply to 2Q17 (MSe 224k) will have outpaced our estimate of demand (171k) by around 30%, when the data is finally reported on 11 October. Rental conditions remain subdued, with headline rental growth of +0.7% yoy (i.e.,another -1.2% fall in real rents),and gross rental yields drifting down to 3.3% as of August 2017. This wave of supply is being driven by apartments, which have fallen in relative price,and in Brisbane, Melbourne and Perth are increasingly being valued below contract price. Ongoing audits around the use of flammable cladding may raise more concerns about apartment demand,valuations and settlement (see “Combustible”, ABC Four Corners, 7 September 2017).
Business/consumer disconnect converginglower: This week we saw a sharp fall in business confidence (although trading conditions remained resilient), which has crossed more territory towards subdued consumer sentiment. Key concerns from both the business and consumer side are around cost-push inflation, from the energy sector and more broadly (with insurance premiums,healthcare and education costs all contributing to our 3.5% ‘cost of living’ inflation outlook). The consumer spends an average 17% more in Nov/Dec than the first 10 months each year,and the concern going into this period will be around the impact of utilitybill sticker shock,as well as falling average income growth,and tighter credit conditions.
Implications – housing growth headwinds,valuation vulnerabilities: Housing construction now looks to have peaked, with activity falling over 1H17, but we expect both the ‘front book’ of approvals and work done to continue declining through 2018. Alongside risks to house prices after an extraordinary ~80% rise in Sydney and ~60% rise in Melbourne since 2013, this makes it even more imperative for both public and private sector investment to create jobs and generate the wage growth that may help rebuild household buffers.
And a little more detail for ya:
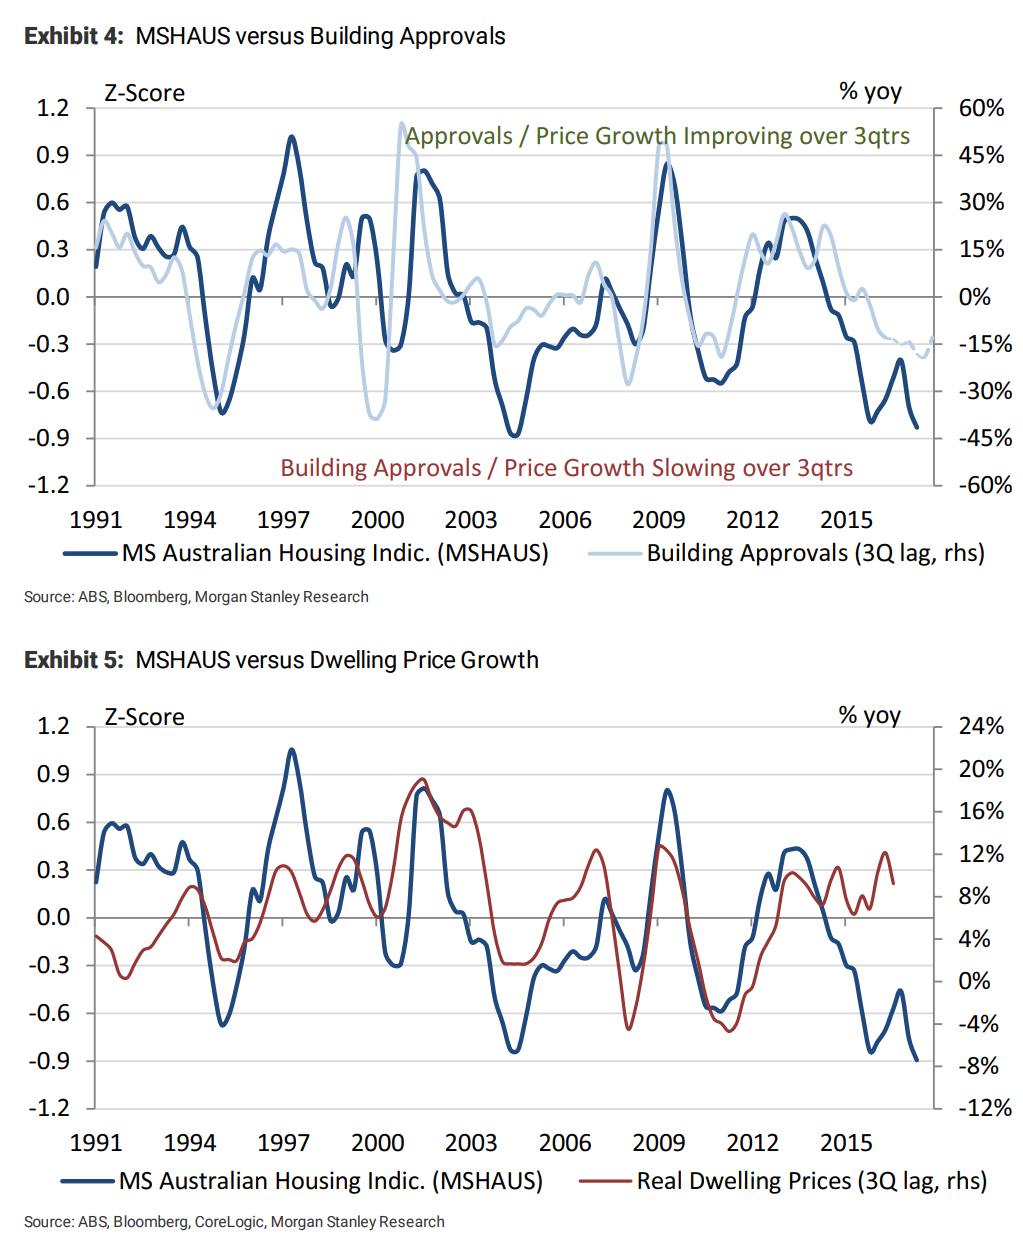
Our MSHAUS indicator provides what we consider a reliable 3-quarter lead on building approvals. As of July, trend approvals have fallen -11% yoy to 215kpa, with multis down -23% to 97kpa. We expect a further decline to 160kpa by 4Q18, largely driven by a normalisation in the multi-dwelling segment. While the backlog of approvals not yet completed remains high, we expect some projects to be shelved given tighter credit conditions. While our MSHAUS indicator has a less strong relationship with price growth, it remains a statistically useful framework. Price growth remained stronger through FY17 than would have been expected, perhaps buoyed by strong momentum and a ‘hunt for yield’. But with fundamentals weak, debt service rising and credit supply tightening, we see risks skewed to the downside.
David Llewellyn-Smith is Chief Strategist at the MB Fund and MB Super. David is the founding publisher and editor of MacroBusiness and was the founding publisher and global economy editor of The Diplomat, the Asia Pacific’s leading geo-politics and economics portal.
He is also a former gold trader and economic commentator at The Sydney Morning Herald, The Age, the ABC and Business Spectator. He is the co-author of The Great Crash of 2008 with Ross Garnaut and was the editor of the second Garnaut Climate Change Review.

Our housing model, MSHAUS, declined to -0.9 in 2Q17 – marking a record-low in its 28-year history. This reflects the start of MacroPru-2 measures, strong supply growth and higher debt service on mortgage repricing. We look for further softening in approvals / price growth over the next 3 quarters.