The Adelaide Bank/REIA Housing Affordability Report has been released for the June quarter has been released, which reveals that the percentage of household income required to service the typical Australian mortgage has increased by 0.2 percentage points to 31.4% – breaching the widely accepted threshold to being a manageable housing repayment. But on a positive note, rental affordability has improved.
As expected, mortgages are most expensive in the housing bubble and immigration epicentres of Sydney and Melbourne:
The latest Adelaide Bank/REIA Housing Affordability Report found the proportion of median family income required to meet average loan repayments increased by 0.2 percentage points to 31.4 per cent…’
“Over the quarter, the proportion of median family income required to meet rent payments reduced by 0.6 percentage points to 24.3 per cent…
New South Wales
NSW had the largest percentage increase in loan repayments and continues to be the least affordable state or territory in which to buy a home. The proportion of income required to meet loan repayments increased to 38.0 per cent, an increase of 1.9 percentage points over the quarter and 0.5 percentage points compared with the corresponding quarter 2016. The proportion of income required to meet loan repayments is 6.6 percentage points higher than the nation’s average.
New South Wales recorded an improvement in rental affordability with the proportion of income required to meet median rent payments decreasing to 28.6 per cent, a decrease of 0.4 percentage points over the June quarter and a decrease of 0.3 percentage points compared to the same quarter last year…
Victoria
Victoria showed a decline in housing affordability, with the proportion of income required to meet loan repayments increasing to 33.4 per cent, an increase of 0.9 percentage points over the quarter and an increase of 0.6 percentage points compared to the same quarter of the previous year.
Rental affordability in Victoria has improved over the quarter with the proportion of income required to meet median rents decreasing to 23.1 per cent, a decrease of 0.7 percentage points over the quarter and a decrease of 0.6 percentage points compared to the June quarter 2016…
Queensland
Housing affordability in Queensland declined over the June quarter with the proportion of income required to meet home loan repayments increasing to 27.2 per cent, an increase of 0.5 percentage points over the quarter but a decrease of 0.5 percentage points compared to the same time last year.
Rental affordability in Queensland improved over the quarter with the proportion of the median family income required to meet the median rent decreasing to 23.0 per cent, a decrease of 0.7 percentage points over the quarter and a decrease of 0.6 percentage points compared to the same quarter 2016…
South Australia
South Australia recorded a decline in housing affordability with the proportion of income required to meet monthly loan repayments increasing to 26.8 per cent, an increase of 0.6 percentage points over the quarter but a decrease 0.1 percentage points compared to the June quarter 2016.
Rental affordability in South Australia improved over the quarter with the proportion of income required to meet rent payments decreasing to 21.9 per cent, a decrease of 0.7 percentage points over the quarter and a decrease of 0.1 percentage points compared to the June quarter 2016…
Western Australia
Western Australia saw a decline in housing affordability over the quarter with the proportion of income required to meet loan repayments increasing to 23.6 per cent, an increase of 0.2 percentage points over the quarter but a decrease of 0.3 percentage points compared to the June quarter 2016.
Rental affordability in Western Australia increased during the June quarter with the proportion of family income required to meet the median rent decreasing to 18.1 per cent, a decrease of 0.5 percentage points over the quarter and a decrease of 1.6 percentage points compared to the year before…
Tasmania
Housing affordability in Tasmania declined with the proportion of income required to meet home loan repayments increasing to 23.9 per cent, an increase of 0.3 percentage points over the quarter and an increase of 0.2 percentage points from the June quarter 2016.
Rental affordability in Tasmania improved with the proportion of income required to meet median rents decreasing to 25.8 per cent, a decrease of 0.8 percentage points over the quarter but an increase of 0.8 percentage from the same quarter 2016…
Northern Territory
Housing affordability in the Northern Territory improved with the proportion of income required to meet loan repayments decreasing to 20.3 per cent in the June quarter, a decrease of 0.8 percentage points over the quarter and a decrease of 1.8 percentage points when compared to the June quarter 2016.
Rental affordability in the Northern Territory also improved with the proportion of income required to meet the median rent decreasing to 23.1 per cent, a decrease of 0.6 percentage points over the quarter and a decrease of 2.0 percentage points compared to the June quarter 2016…
Australian Capital Territory
Housing affordability in the Australian Capital Territory improved with the proportion of income required to meet home loan repayments decreasing to 19.8 per cent, a decrease of 0.3 percentage points over the quarter and a decrease of 0.7 percentage points compared to the same quarter last year.
Rental affordability remained stable over the June quarter with the proportion of income required to meet the median rent remaining at 17.9 per cent and with a marginal increase of 0.1 percentage points compared to the June quarter 2016.
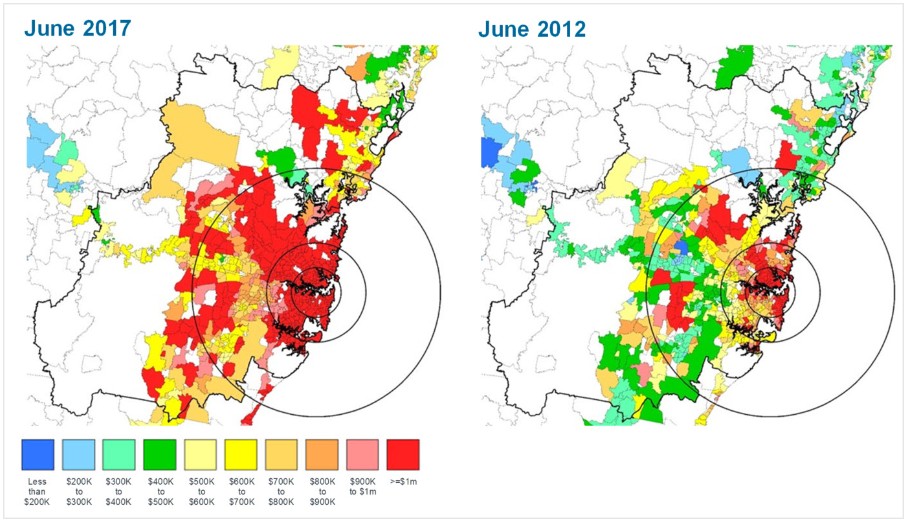
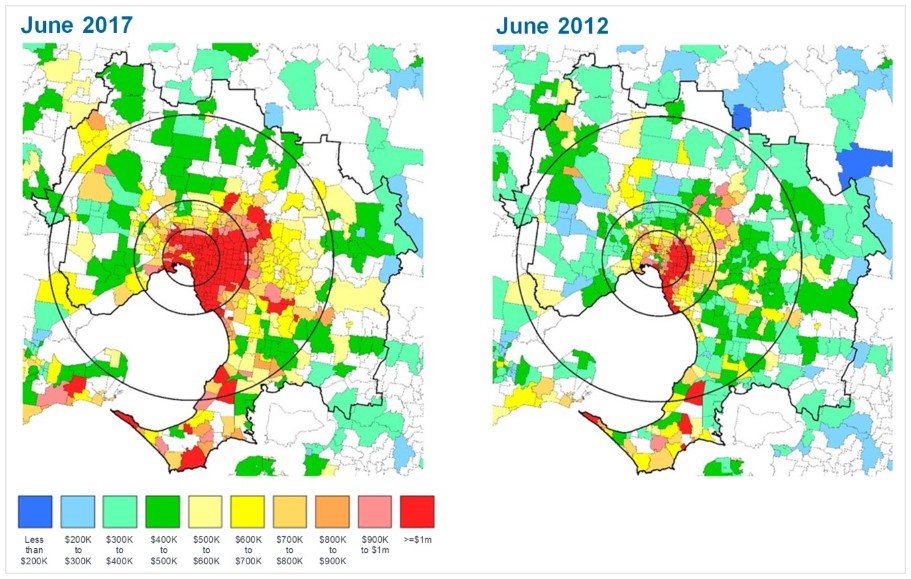
These results should come as no surprise. The latest CoreLogic Mapping the Market report showed that suburbs with a median price below $600,000 (Sydney) or $400,000 (Melbourne) have vanished over the past five years, whereas there has been much less shrinkage in affordability elsewhere:
Advertisement
Sydney houses
In June 2012, 21.3% of Sydney suburbs had a median house value of more than $1 million, by June 2017 55.7% of suburbs had a median house value in excess of $1 million while only 8.7% of suburbs had a median value below $600,000 and most were located more than 50 kilometres from the CBD.
Melbourne houses
In June 2012, 9.5% of Melbourne suburbs had a median house value in excess of $1 million and by June 2017 that figure had increased to 32.6% of suburbs. On the flip-side, 24.3% of Melbourne suburbs in June 2012 had a median house value below $400,000 compared to just 2.7% by June 2017.
Leith van Onselen is Chief Economist at the MB Fund and MB Super. He is also a co-founder of MacroBusiness.
Leith has previously worked at the Australian Treasury, Victorian Treasury and Goldman Sachs.