Exclusive: Steve Keen on the secret source of eternal Australian growth

Exclusively from Professor Steve Keen: How to delay a recession
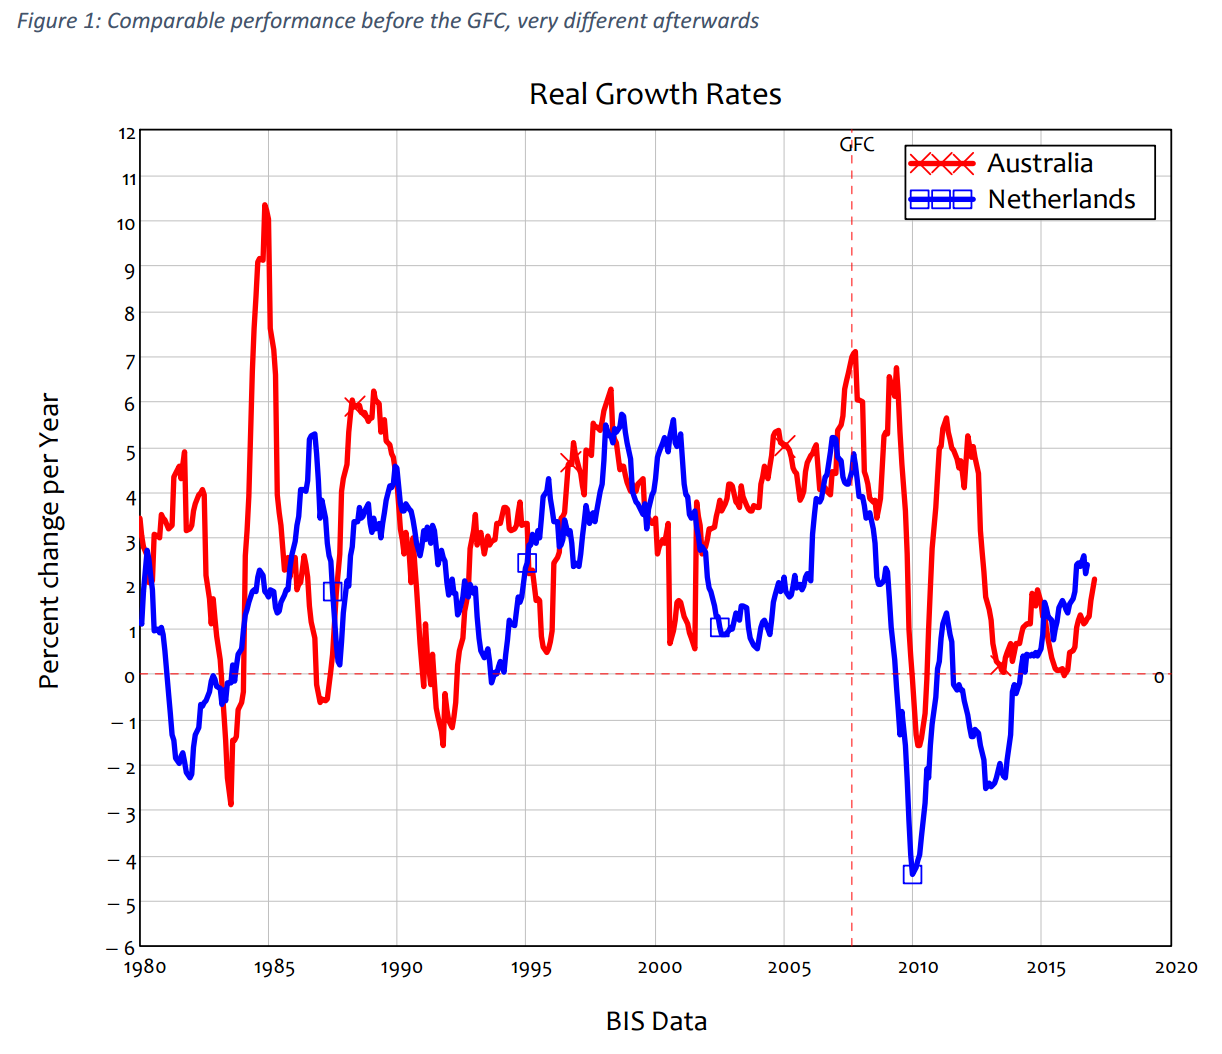
Much was made of the fact that Australia recently replaced The Netherlands as the world record holder for the longest period without a recession (using the colloquial definition of two consecutive quarters of negative growth). The Netherlands went just under 26 years (103 quarters between 1982 and 2008) without a recession, and Australia surpassed this when it recorded 0.3% growth in the March 2017 quarter (for an annual growth rate of 1.7%).
Rather less attention was given to another Australian record: household debt. Before its recessionfree record was set, Australia had already overtaken The Netherlands for the record of the highest level of household debt ever recorded for a large country (one with more than 10 million people).
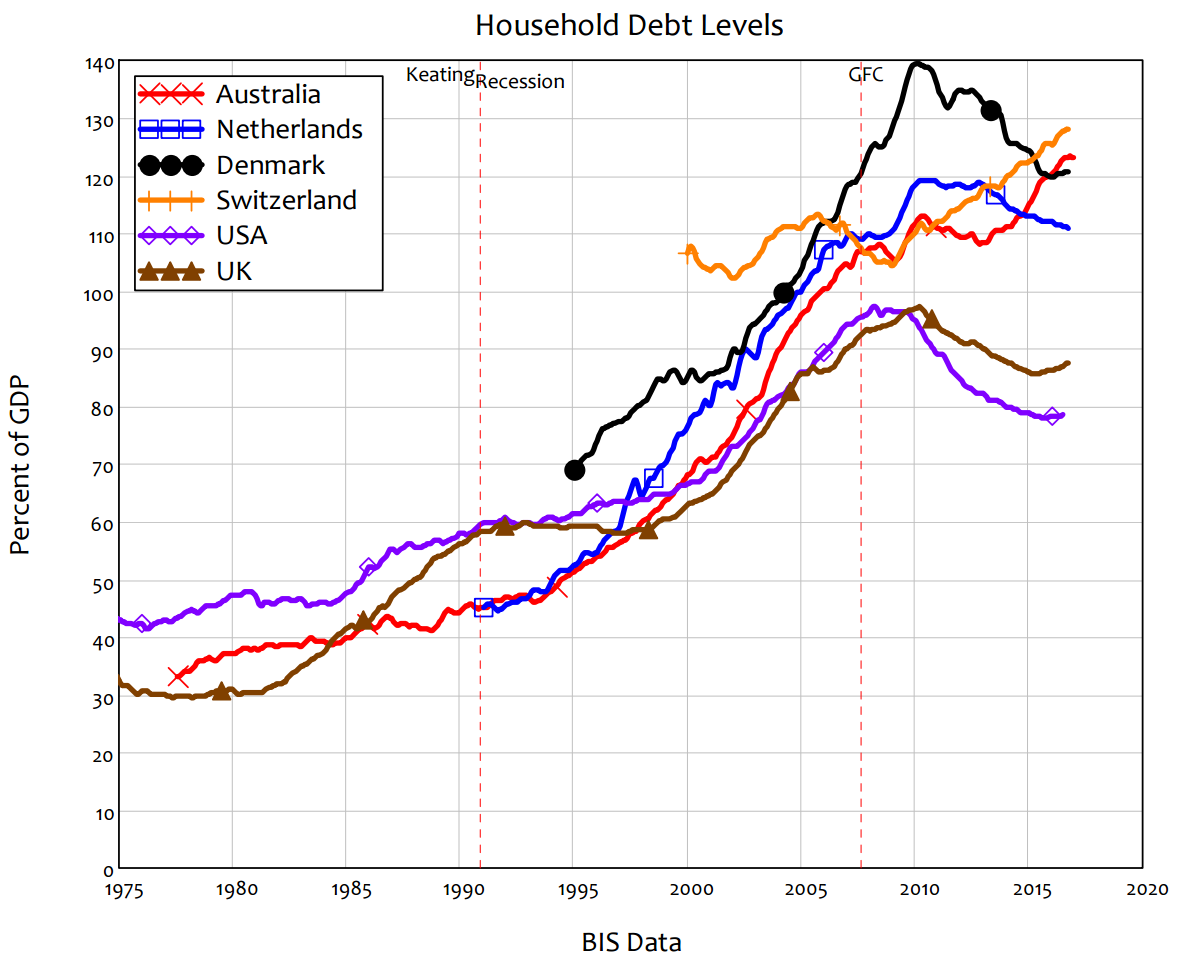
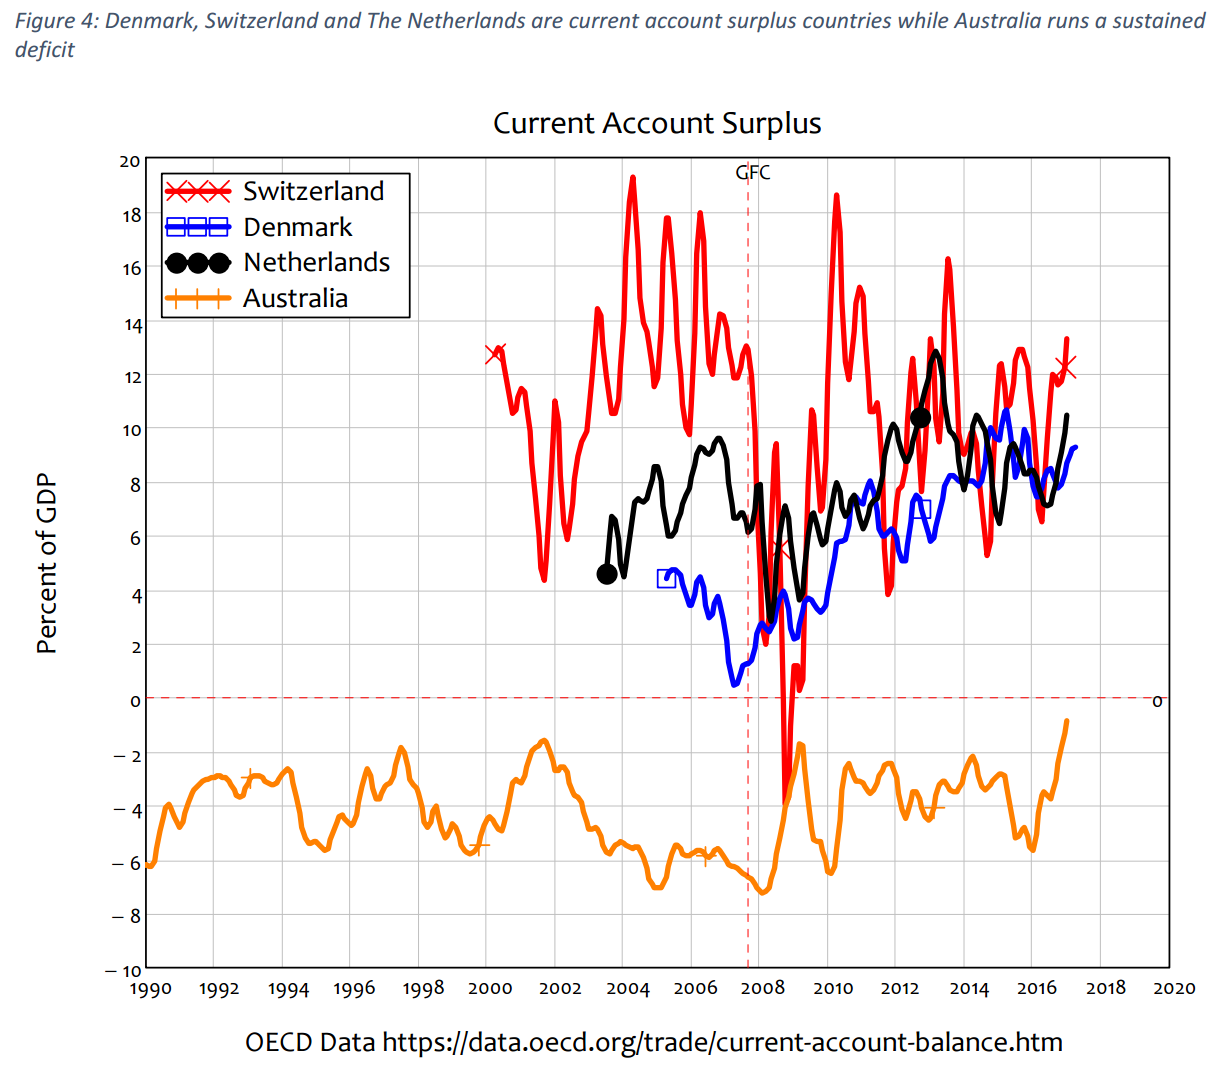
Australia’s household debt level of 123% of GDP has been exceeded only by Switzerland (population 8.3 million, household debt of 128% of GDP in 2016 Q3) and Denmark (population 5.6 million, 139% of GDP in 2009).2 Australia also stands apart from its household leverage competitors in another important respect: Denmark, Switzerland and The Netherlands also run significant current account surpluses—Switzerland’s average surplus since 2000 has been the highest on the planet at over 10% of GDP; Denmark’s has averaged 5.75% since 2005; The Netherlands’ average current account surplus is around 8% of GDP.
Australia, in contrast, has averaged a current account deficit of 3.2% of GDP since 1960, and 4.3% since 2000. Australia therefore holds the record of the highest level of household debt for a country running a trade deficit, and has done so since 2010, when it overtook the previous record-holder: Ireland. Ireland’s household debt level has also plunged since then, from a peak of 118% of GDP in 2010 to 54%. Australia’s closest competitor now is Canada, which has a household debt level 22% lower than Australia’s, and an average trade deficit of 1.4% of GDP, versus Australia’s long-run average of 3.2%.

Why does this matter? Because Australia’s two records are related: Australia avoided a recession in 2008 only by adding additional leverage to its already over-indebted household sector, and the only ways that Australia can keep its winning streak on GDP growth going (given that its government is obsessed with trying to run a surplus) is to either to achieve a huge trade surplus, or for the household sector to continue piling on debt faster than GDP itself grows.
A trade surplus is one of three ways to increase both aggregate demand and the amount of money in an economy:3 goods you sell to foreigners are paid for in US dollars, which the exporter then effectively sells to its country’s Central Bank in return for domestic currency (on that front, The Netherlands is, like Germany, a huge beneficiary of the Euro).
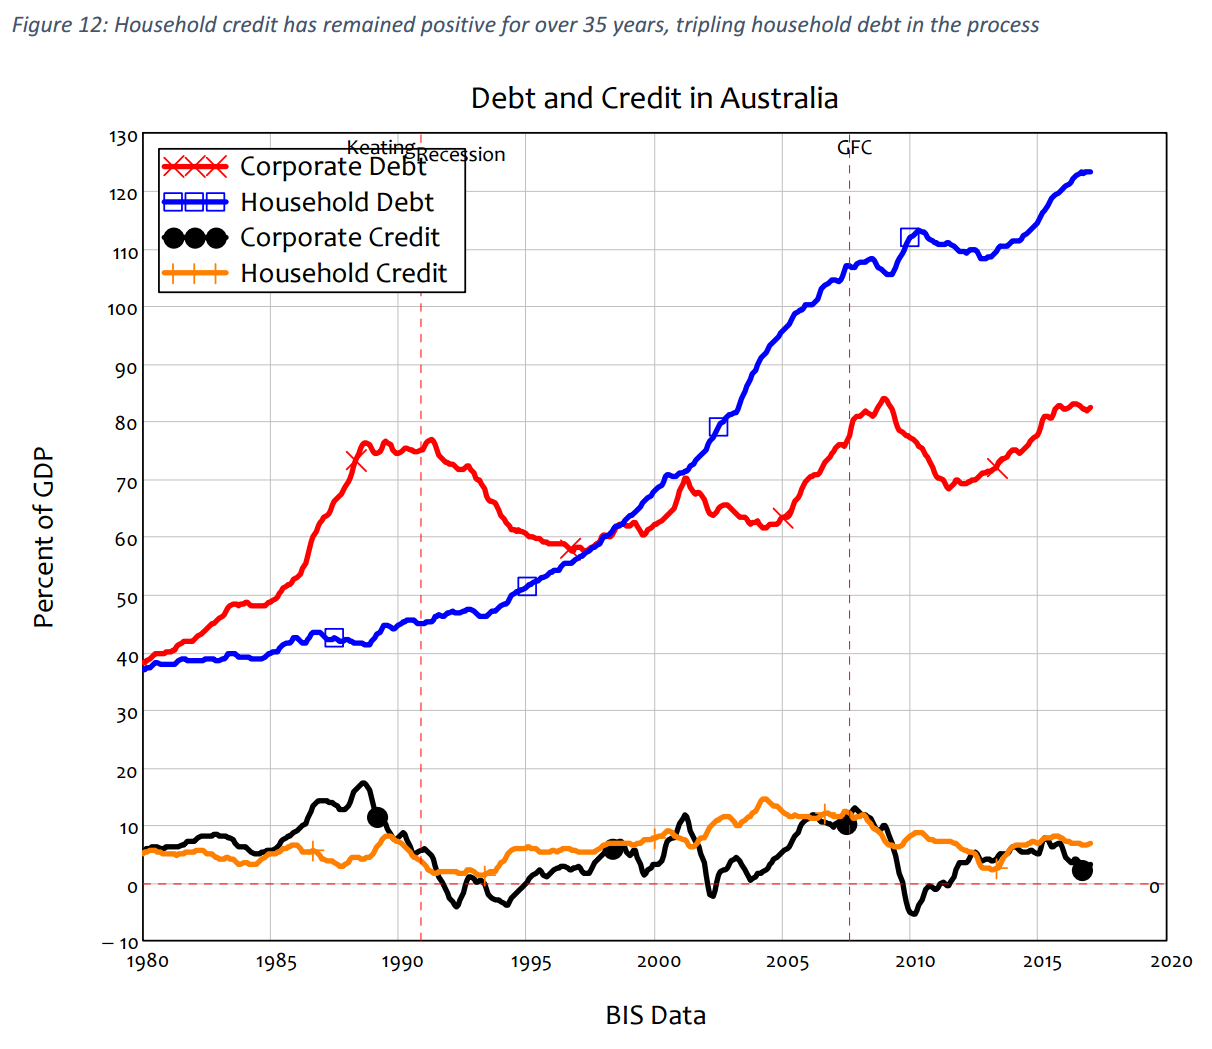
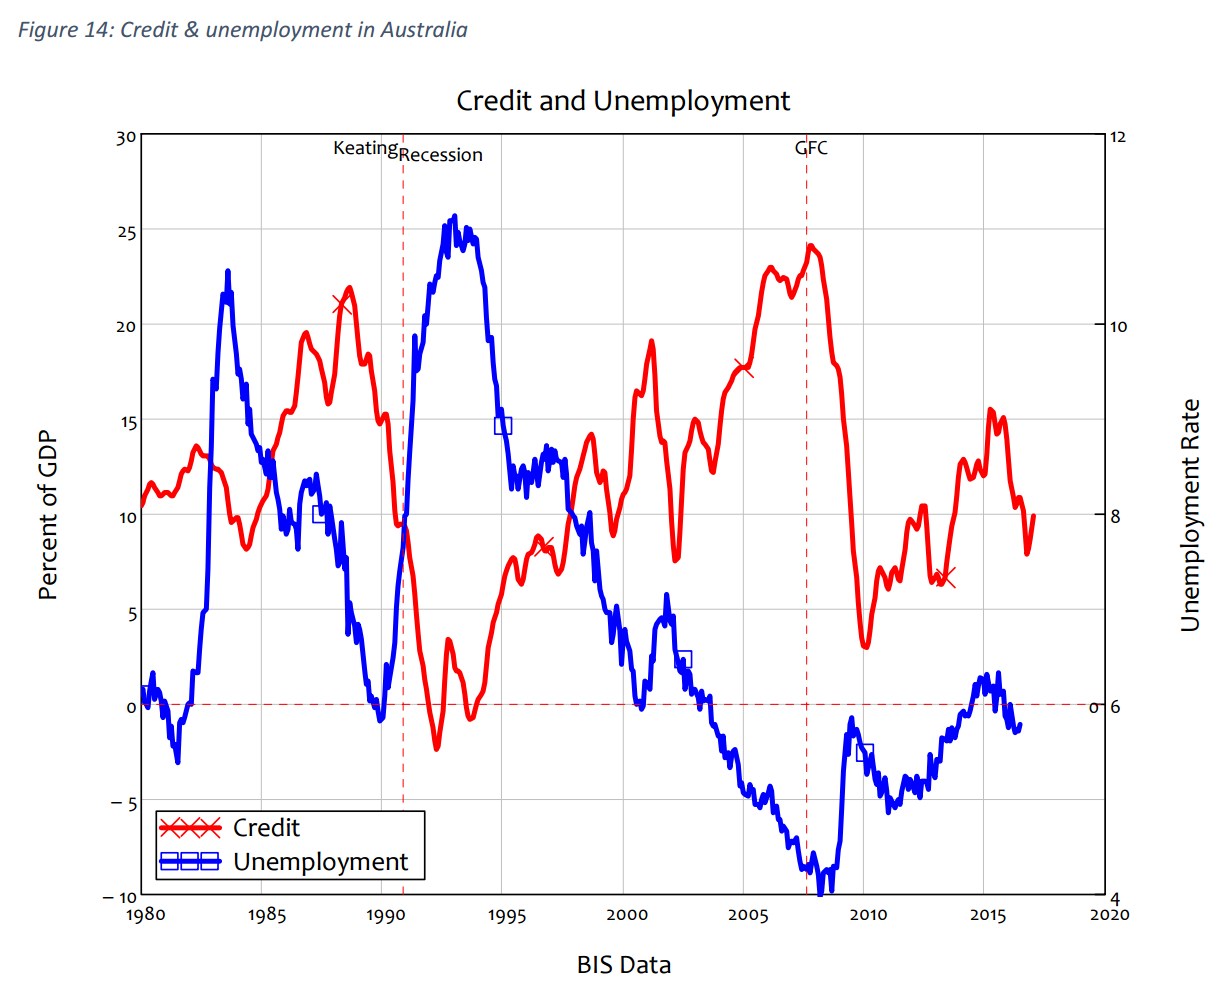
With the China export boom over, and its history of sustained trade deficits, Australia has zero chance of emulating The Netherlands on the trade surplus front. That leaves expanding private debt, which is the method that Australia has relied on throughout its long boom: Australia hasn’t had a period of negative credit (falling private debt) since Keating’s “recession we had to have”, and that was the only time that credit was negative in Australia in the last sixty years.
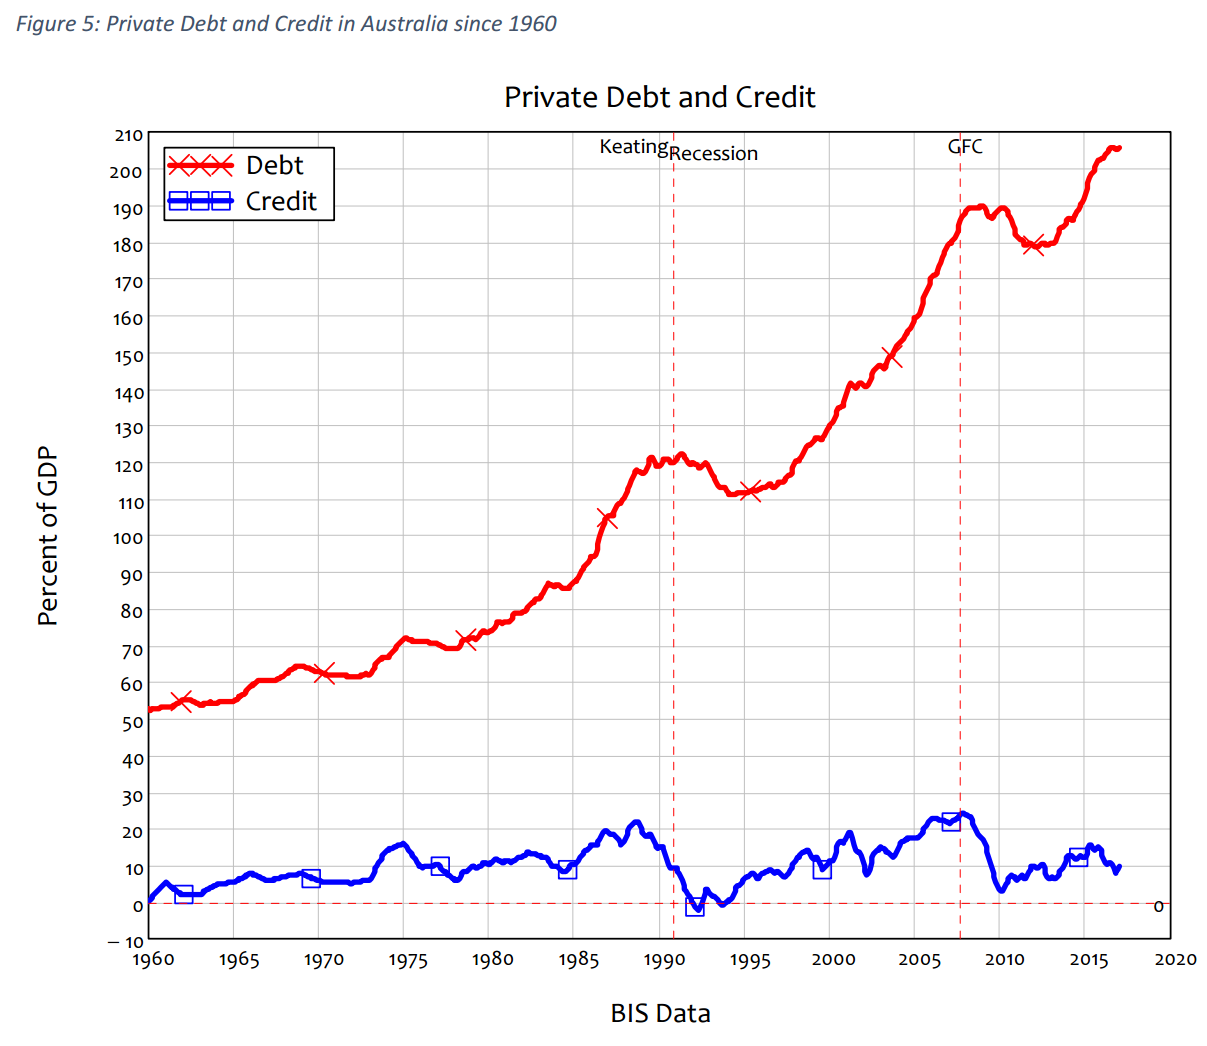
Since bank credit is matched one for one by new bank debt, this has driven Australia’s private debt to GDP ratio from just over 50% of GDP in 1960 to almost 210% of GDP today.
(As an aside, this was not simply in response to falling interest rates: in 1960, when private debt was less than ¼ of today’s level, the interest rate on mortgages was 5%, much the same level as it is today.
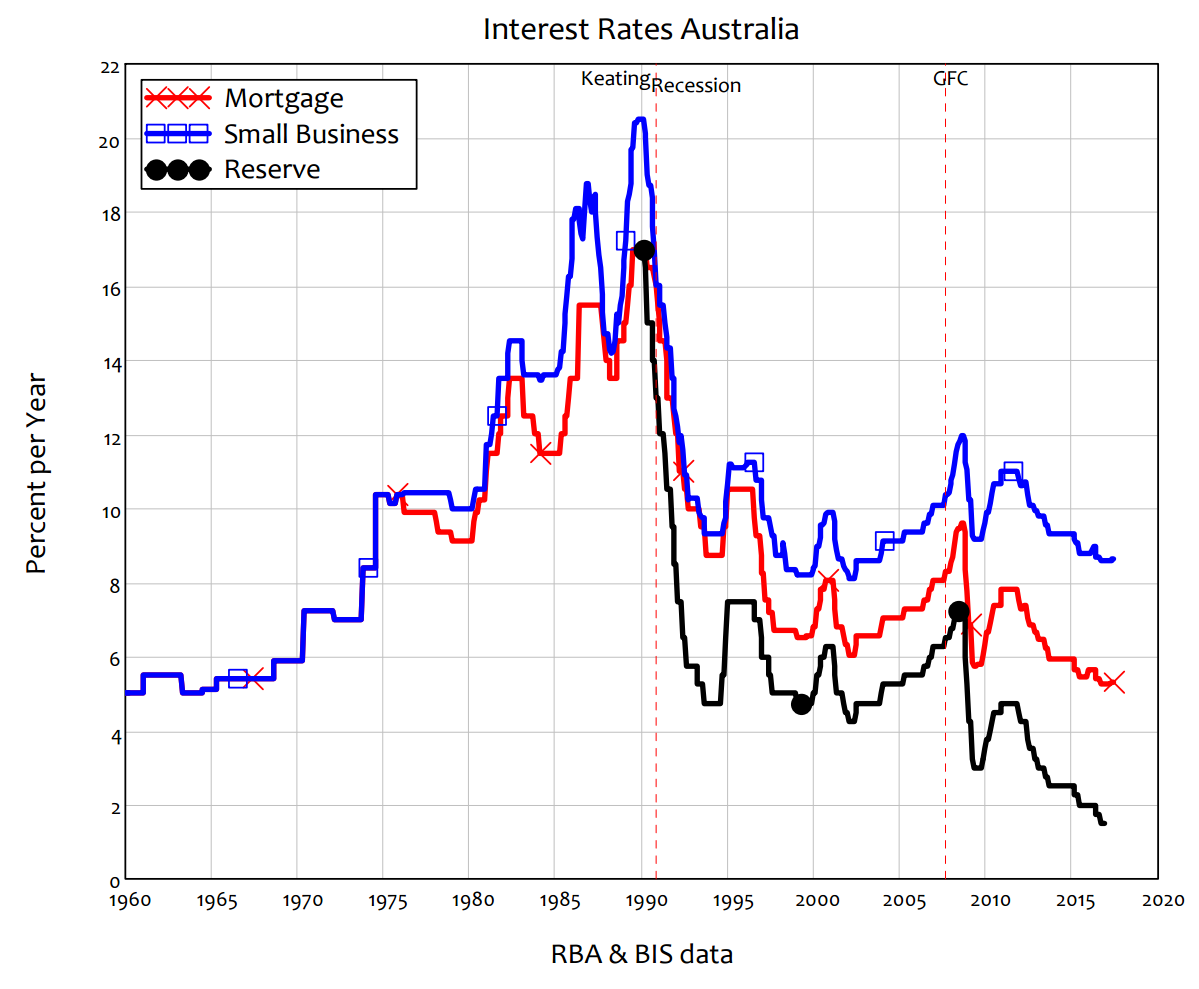
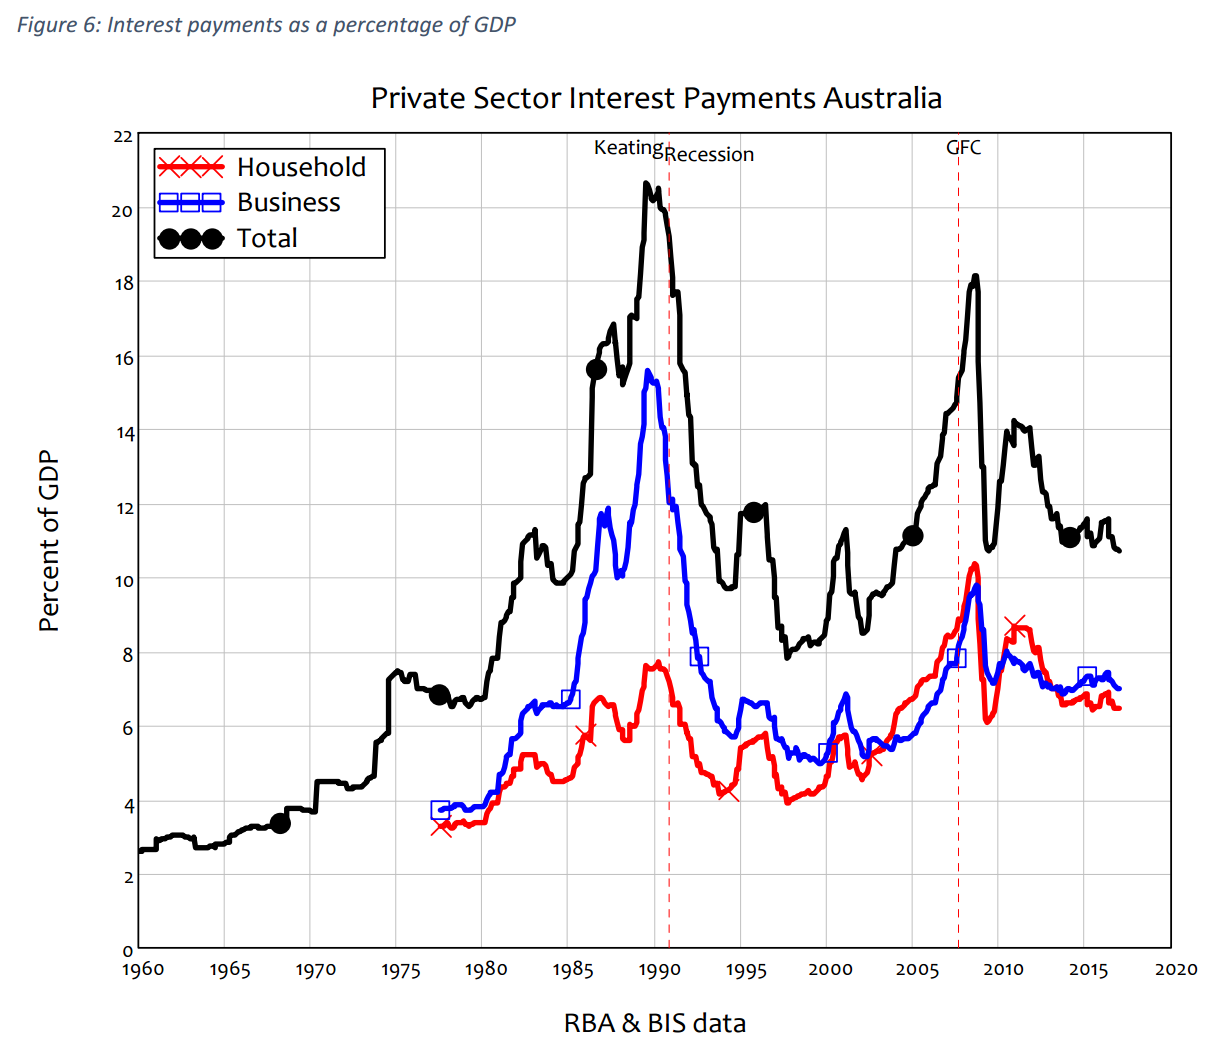
Interest payments as a percentage of GDP are lower than they were during the 1990s when interest rates and inflation were several times today’s levels, but even on a conservative estimate, interest payments today are three times as large a percentage of GDP as they were in the 1960s).
So how did Australia avoid recording a recession in 2008? It did so by encouraging the private sector to continue getting into debt, via government policies like Rudd’s First Home Vendors’ Boost (as I prefer to call it). Credit fell dramatically from 24% to 3% of GDP between August 2007 and January 2010, but it never turned negative (as it did during the Keating Recession, when it hit minus 2.3% of GDP in March 1992).
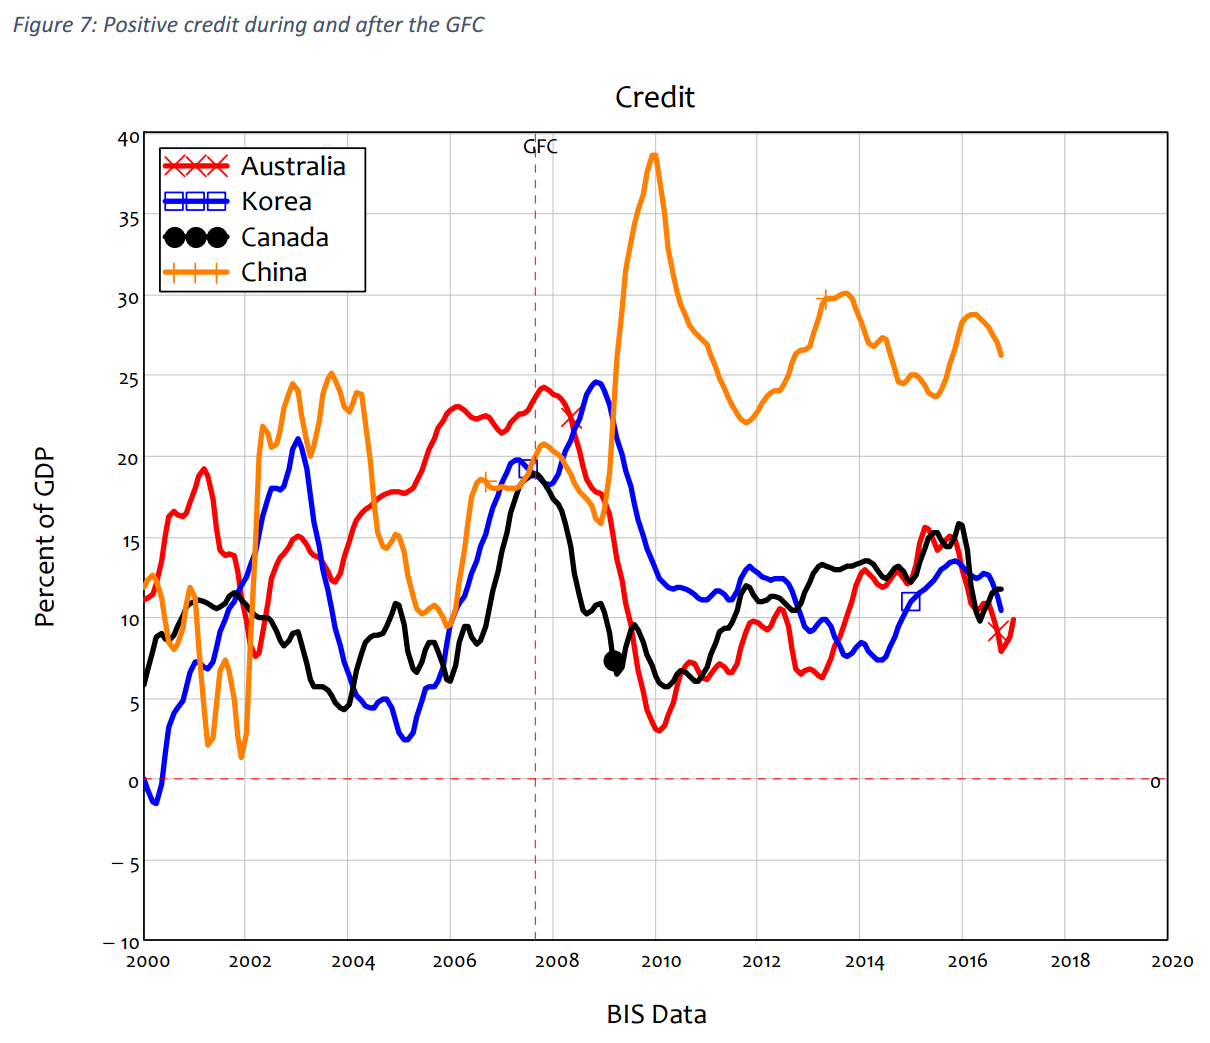
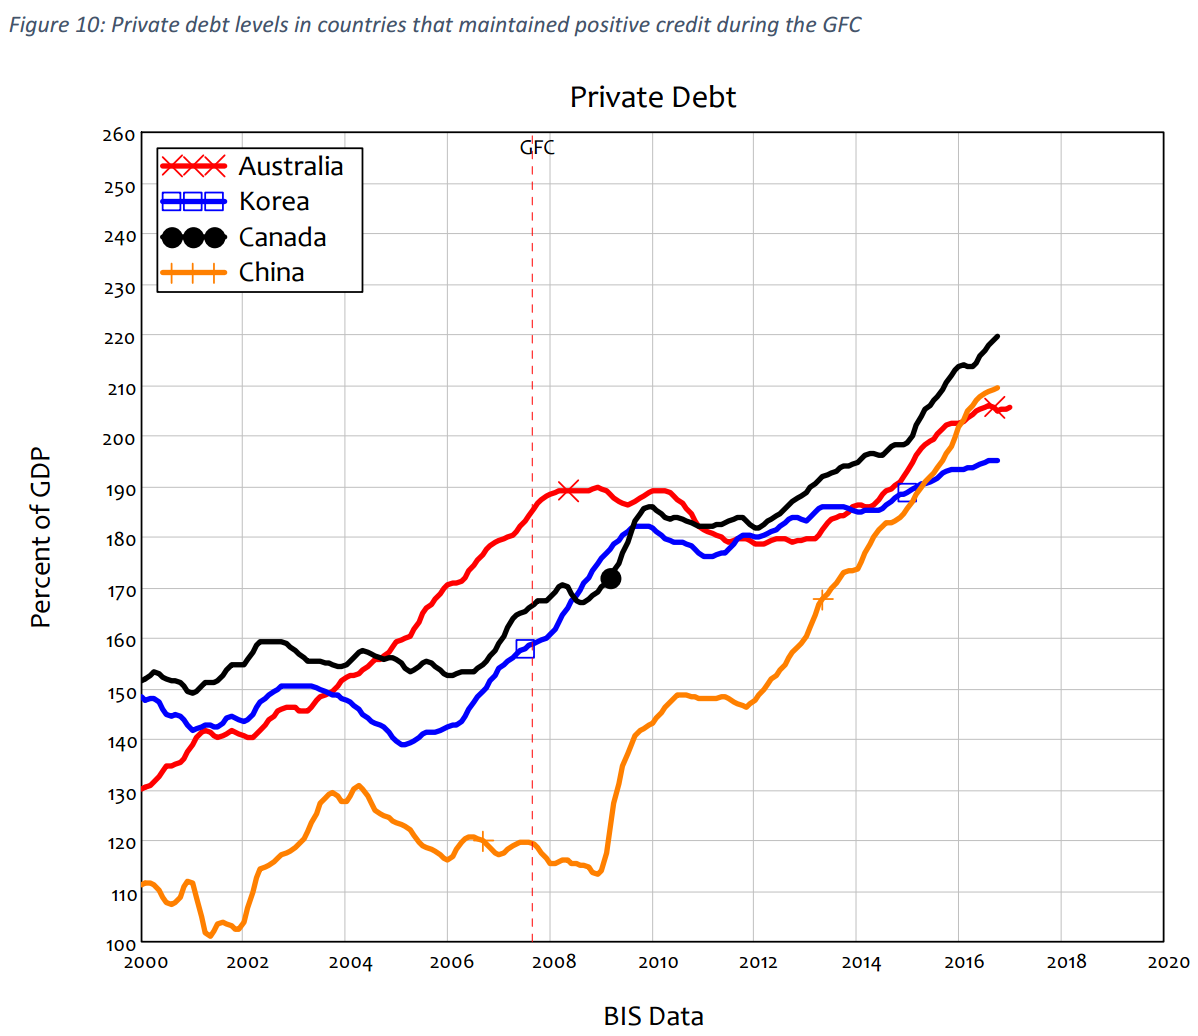
The same observation applies to numerous countries which had a “good” GFC, in that they either didn’t have a recession at time (Australia and South Korea were the only OECD countries not to have a recession in 2008-09), or they didn’t have a sustained slump afterwards: they all did so by increasing private sector leverage. The four largest such economies are (in size order) China, South Korea, Canada, and Australia.
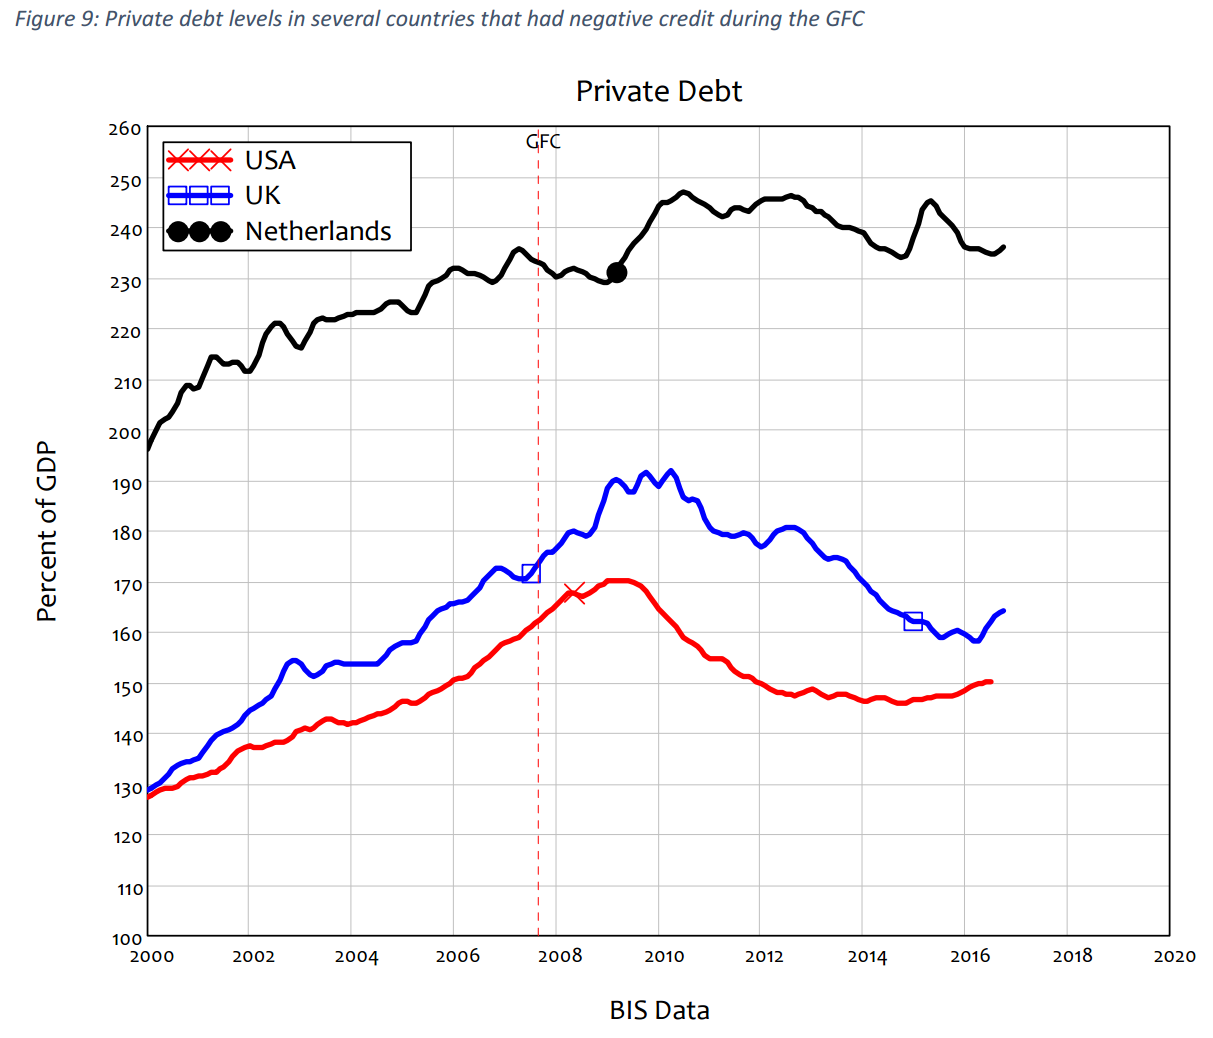
On the other hand, those countries that had a “bad” GFC, with both a serious recession and sustained below-par growth afterwards, had negative credit during the GFC itself, and have had anaemic levels of credit since.
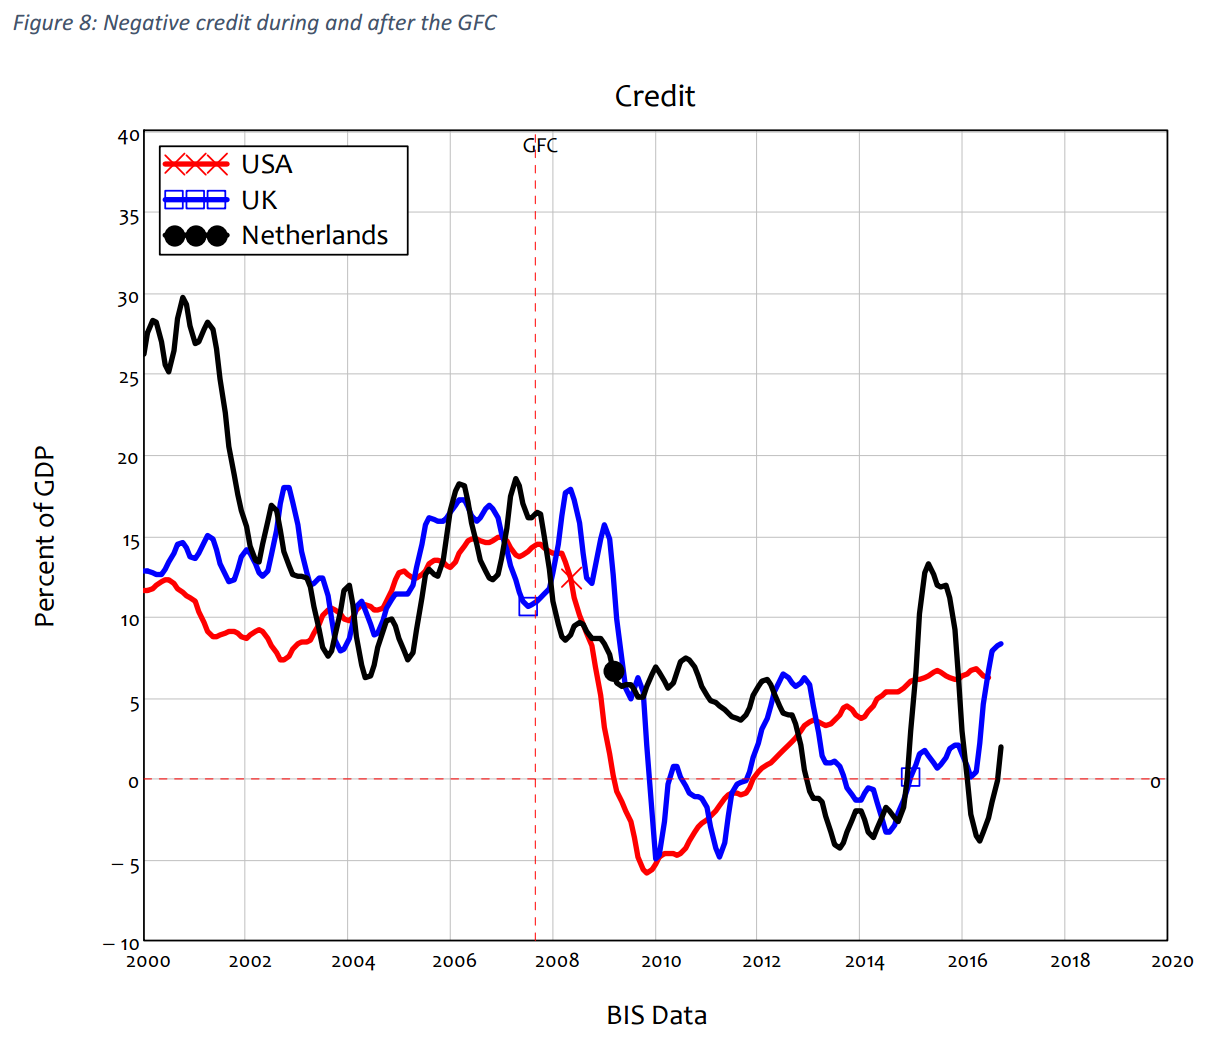
Countries that had negative credit during the GFC have de-levered to some extent—the UK’s debt is 25% of GDP lower than at the GFC, and the USA’s is about 20% (the Netherlands is the outlier here— its debt level is marginally higher than at the GFC—but it is still below its peak level of over 245% in 2010).
In contrast, the countries that powered their way through the GFC with credit all have substantially higher levels of private debt than they had back in 2008. Australia’s increase was actually relatively modest, though still substantial: private debt rose from 185% at the time of the GFC to 205% today. Korean private debt rose from 160% to 195% of GDP, Canada from just under 170% to 220%, and the big whopper of them all, China, rose from 120% to 210%.
These countries avoided a crisis during the GFC because they kept demand expanding via credit. They can continue booming only if they keep credit—the annual change in private debt—positive. This is the Faustian bargain of private debt: because total demand is the sum of the turnover of existing money plus credit, then once private debt is very large compared to GDP, aggregate demand can fall even if GDP and private debt are still rising. When you have become dependent on credit to sustain demand, you need to continually increase debt faster than GDP rises, or you suffer a fall in aggregate demand, and therefore a recession.
To appreciate this, imagine an economy where private debt is growing twice as fast as GDP—debt is growing at 20% per annum in nominal terms, and GDP is growing at 10%—and where credit is 100% used for asset purchases, rather than for goods and services. Ignore for the moment any feedback between credit and GDP growth. What happens to aggregate expenditure on goods and services and assets if the rate of growth of debt simply slows down to the same as the rate of growth of GDP?
If GDP is one trillion dollars a year, and the debt ratio is 50%, then debt is $500 billion and credit that year is $100 billion (20% of $500 billion). Total expenditure is $1.1 trillion—$1 trillion from the turnover of existing money (GDP in this hypothetical example), and $100 billion from credit.
Next year, if GDP grows by 10%, and debt growth slows down from 20% a year to 10%, total demand will be $1.16 trillion: $1.1 trillion from GDP, and $60 billion from credit (10% of $600 billion). This is $40 billion less demand from credit than the year before, but overall demand is $60 billion higher than in the previous year, because of the increase in GDP.
If the debt ratio starts at 200% of GDP, then total expenditure in the first year is much higher at $1.4 trillion—$1 trillion from the turnover of existing money and $400 billion from credit (20% of $2 trillion). But when the growth of credit slows to 10% the following year, total demand falls to $1.34 trillion: $1.1 trillion from GDP, and $240 billion from credit (10% of $2.4 trillion). This is $60 billion less expenditure than the year beforehand—even though both GDP and debt have continued to grow.
So Australia can’t avoid a crisis by merely stabilising its level of private debt to GDP: to avoid a crisis—or rather to delay it even further—Australia’s private debt has to keep growing faster than GDP forever.
This can’t happen: the higher debt gets compared to GDP, the more of available income is taken up by debt servicing, the more bad debts are taken on, the more wary both banks and borrowers (and even so-called regulators like Australia’s asleep-at-the-wheel champions APRA and the RBA) get about yet more debt. This process is already clearly visible in Australia.
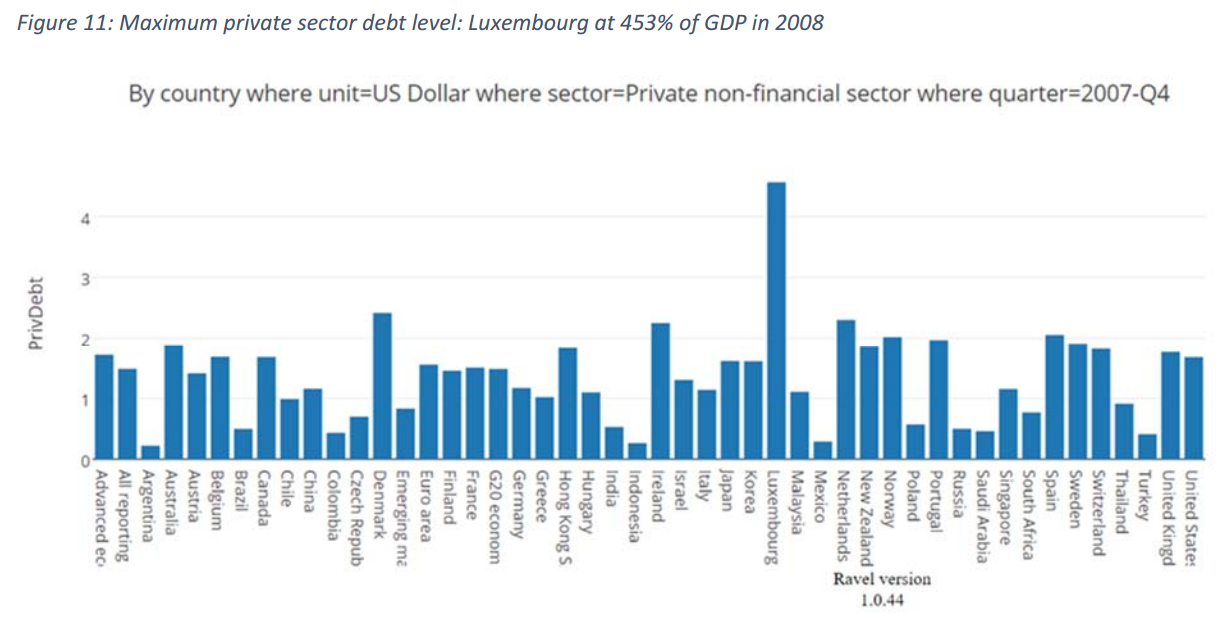
It’s also never happened: no large country has ever exceeded 250% of GDP as its private debt level. The record is held by the tiny tax-haven of Luxembourg in 2008 (when its population was 488,000) at 453% of GDP (it’s since fallen to 410%). The Netherlands maxed out at 247% in 2010 (it’s now 236%), Japan at 220% in 1994 (it’s now 156%). They all have the luxury of trade surpluses that enable a larger level of private debt (tiny Luxembourg has averaged a current account surplus of 8.2% of GDP, lower only than Switzerland); Australia is unlikely to reach their levels before its recession begins.
Credit-based demand certainly won’t be forthcoming from Australia’s business sector, which generally borrows to invest, which has regularly de-levered during recessions in the past, and which has shown a marked reluctance to exceed 80% of GDP as its aggregate debt level. For Australia to do keep credit demand high, the household sector would need to push even further into record household debt territory.
It may continue to do so for a while, particularly if encouraged by government policies like a renewed First Home Vendors Grant, further interest rate cuts by the RBA, or some policy doozie like letting suckers—sorry, I meant first home buyers—use their superannuation for a house purchase. But it will reach a plateau, and before it does, credit-based demand will at best fall to zero. Far more likely is that it will turn negative, as it has done in every other country that has experienced a recession caused by falling credit, with both the business sector and the household sector deleveraging.
Which brings me to Australia’s favourite topic: its housing bubble.
“It’s not a bubble”©™
When prices took off in response to the RBA’s unplanned cuts in its reserve rate from 2012 on (when the inflation bogey-man the RBA expected after the GFC failed to materialise), the property lobby trotted out the standard argument that house prices were determined by supply and demand, and with inflexible supply, well, prices had to rise to clear the market, and therefore there isn’t a bubble, is there?
Now virtually everyone agrees there’s a bubble, and that households have taken on too much debt. But the persistent delusions are: (a) that there won’t be much macroeconomic fallout from the end of the housing bubble, since (so long as unemployment doesn’t rise) the households that have the debt can service it (thanks to low interest rates); and (b) that house prices won’t fall much, because demand is still high (given immigration and overseas buying).
There will be serious macroeconomic fallout from the end of the bubble, because credit-based demand will turn negative.
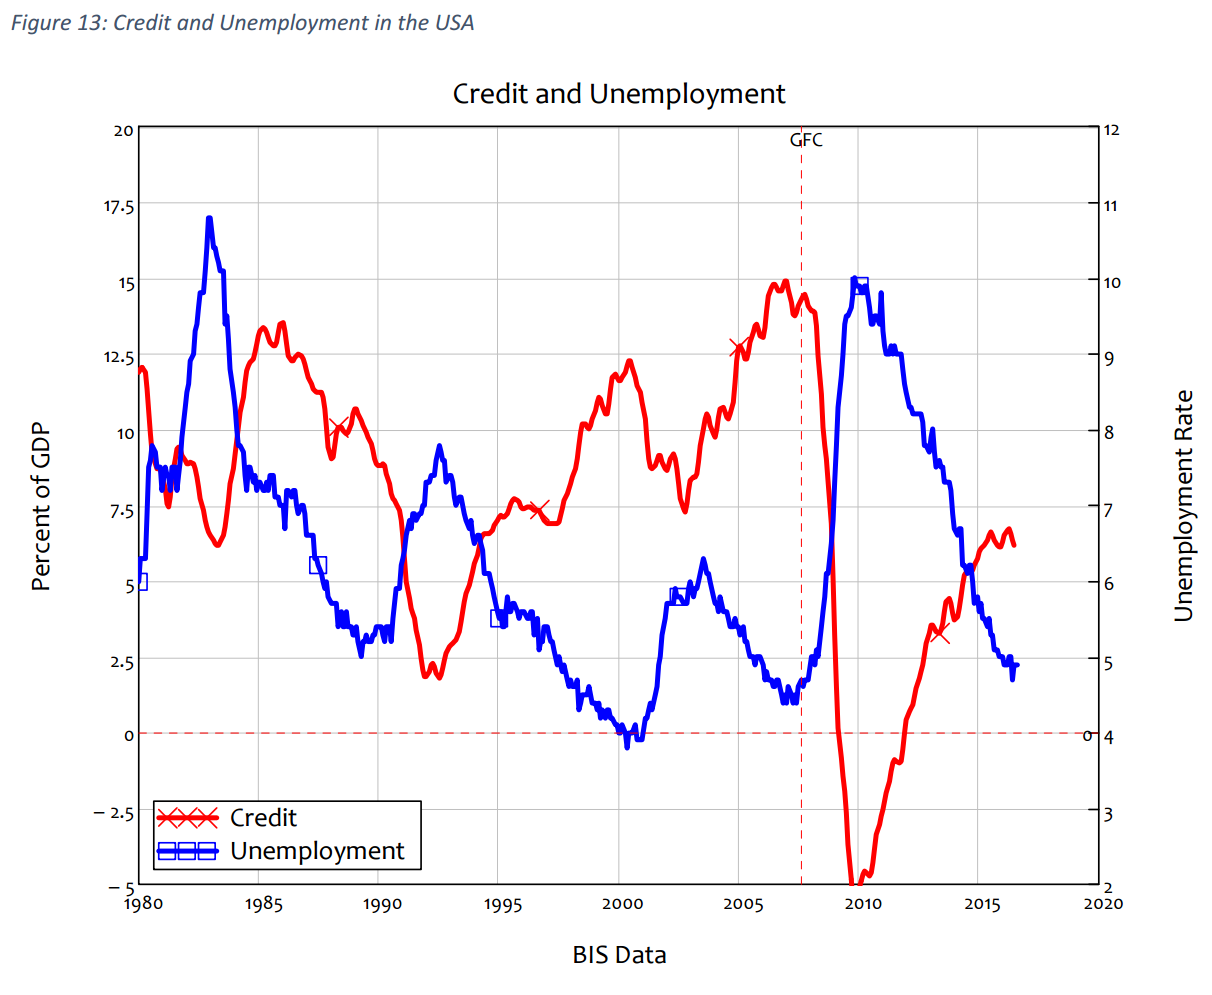
As the world’s largest and, despite Donald Trump’s protestations, still most self-contained economy, the USA provides the best example of this phenomenon. Credit fell from plus 15% of GDP at the peak of its Subprime Boom in 2007 to minus 6% of GDP in the depths of its recession in 2010. Because credit had become such a large component of aggregate demand, the fall in credit directly caused economic activity to fall and unemployment to rise.
The USA’s experience of negative credit was shared by every country that had a bad GFC—including the Netherlands. Credit turned negative, subtracting from aggregate demand rather than adding to it. Unemployment rose and asset markets tanked. Australia therefore didn’t avoid a recession: it has merely delayed it, at the price of an increased level of private debt from which its recession will soon spring (though the fall from peak credit will not be as steep as it could have been at the time of the GFC, when credit peaked at 24% of GDP).
The belief that house prices will hold up so long as unemployment doesn’t rise too much also gets the causal mechanism arse-about-tit (to use a quintessential Australian expression). House prices will fall first, as they did in the USA, because “people” don’t buy houses: people with mortgages buy houses. This little detail is overlooked by property lobbyists who point to rigid supply as the cause of higher prices.
The monetary demand for housing is overwhelmingly sourced from new mortgages. Divide the flow of new mortgages per year by the price level, and you have the physical flow of demand for houses per year. There is thus a relationship between the flow of new mortgages and the price level.
It follows that there is a relationship between the change in new mortgages per year and the change in the price level. While the strength of this relationship varies between countries given variations in government policy and the impact of non-resident purchases of real estate, it applies in countries whose experience has been as disparate as the USA and Australia. Therefore, to maintain forever rising house prices, mortgage debt not merely has to rise, but has to continue rising at an increasing rate. This simply can’t happen: nothing accelerates forever, even private debt. At some point households reach saturation levels of debt compared to income. Before this happens, the rate of growth of debt reaches a peak and then starts to fall.
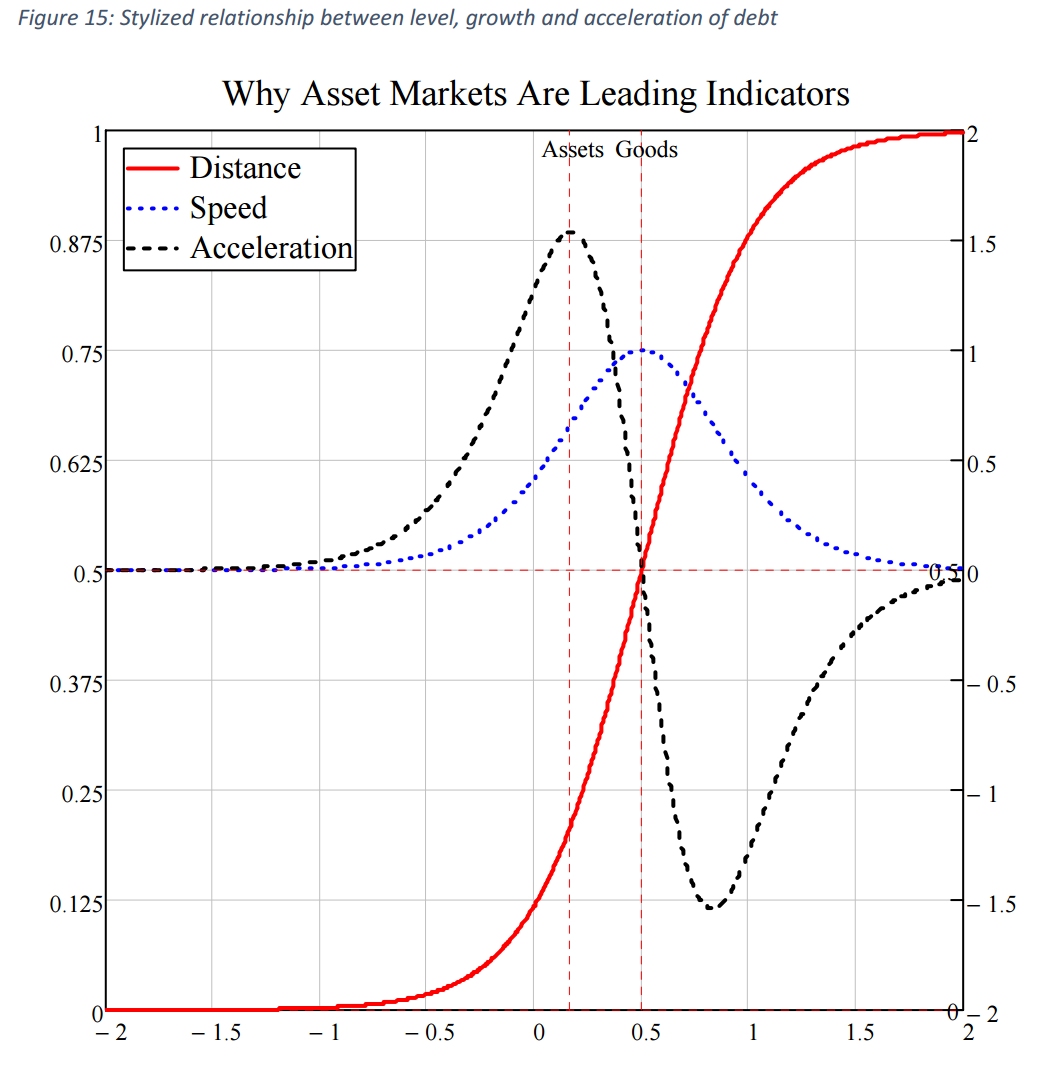
Since the acceleration of (mortgage) debt determines house prices, and the rate of growth of (all private) debt determines credit-based demand in general and hence a major component of aggregate demand, the fall in asset prices tends to precede the decline in economic activity in a credit-driven recession. Therefore, rather than a rise in unemployment being needed to cause house prices to fall, deceleration in mortgage debt causes the rate of increase of house prices to slow and ultimately turn negative, and the overall decline in credit causes unemployment to rise.
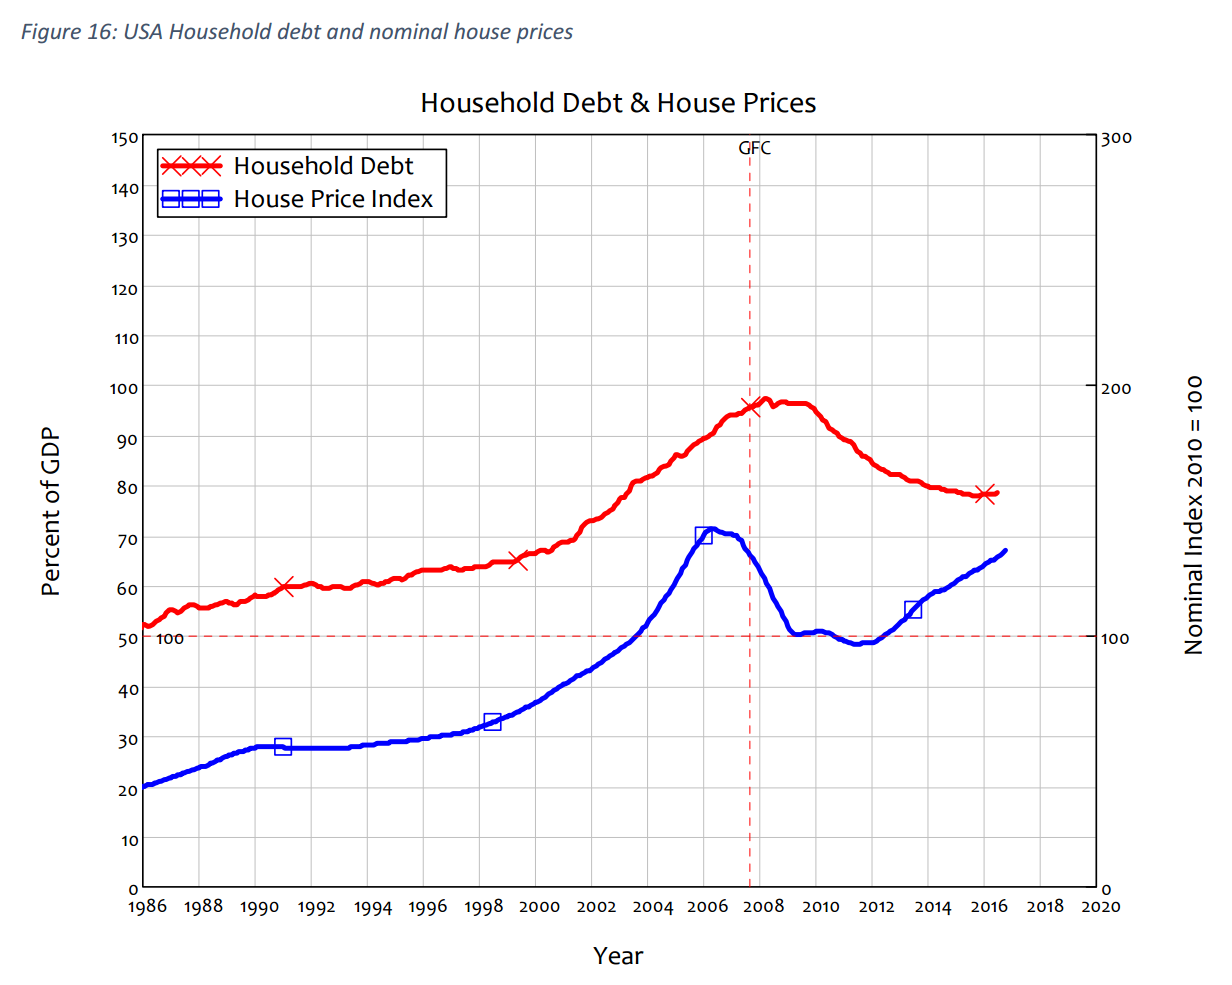
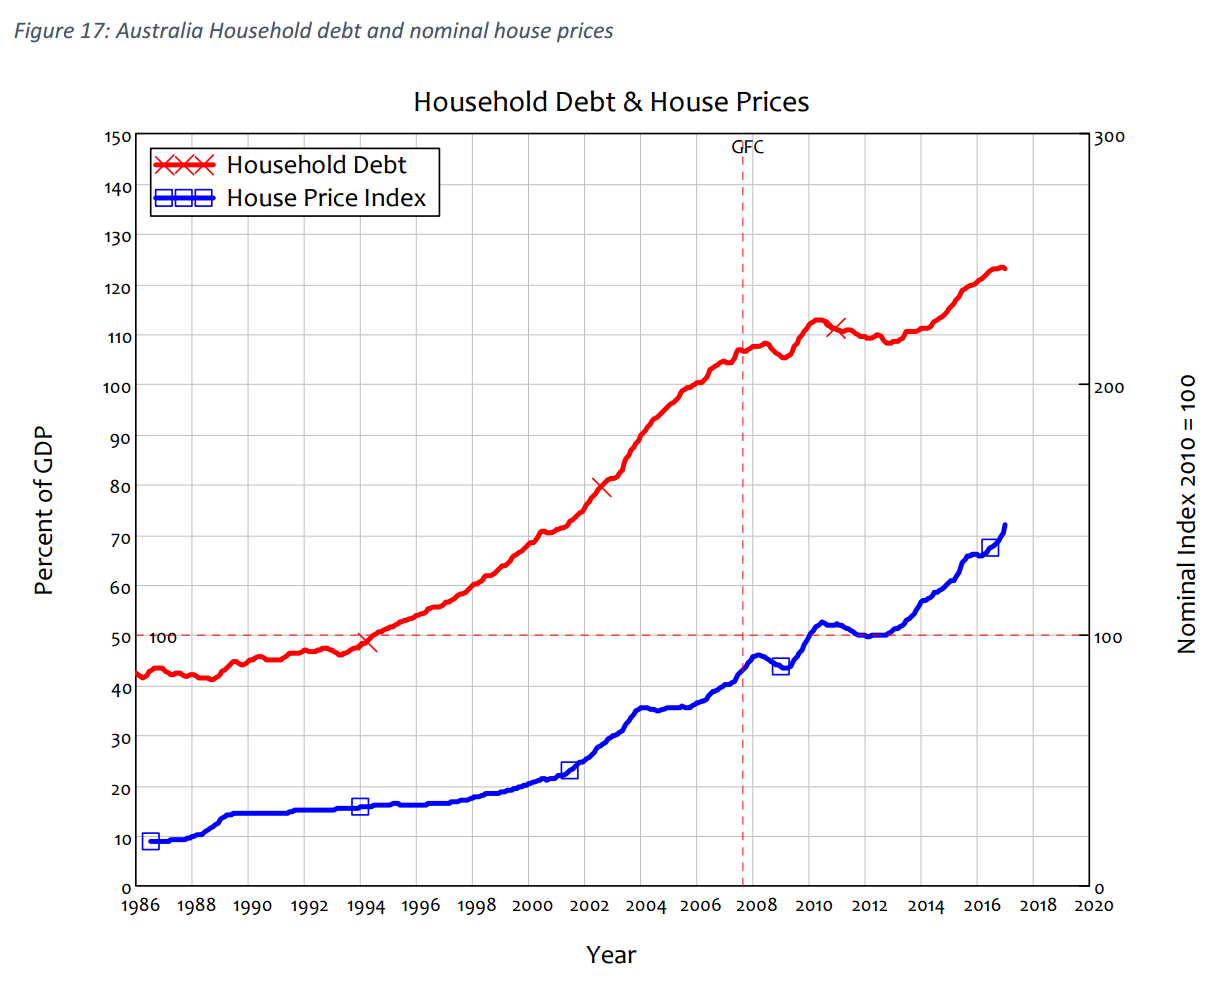
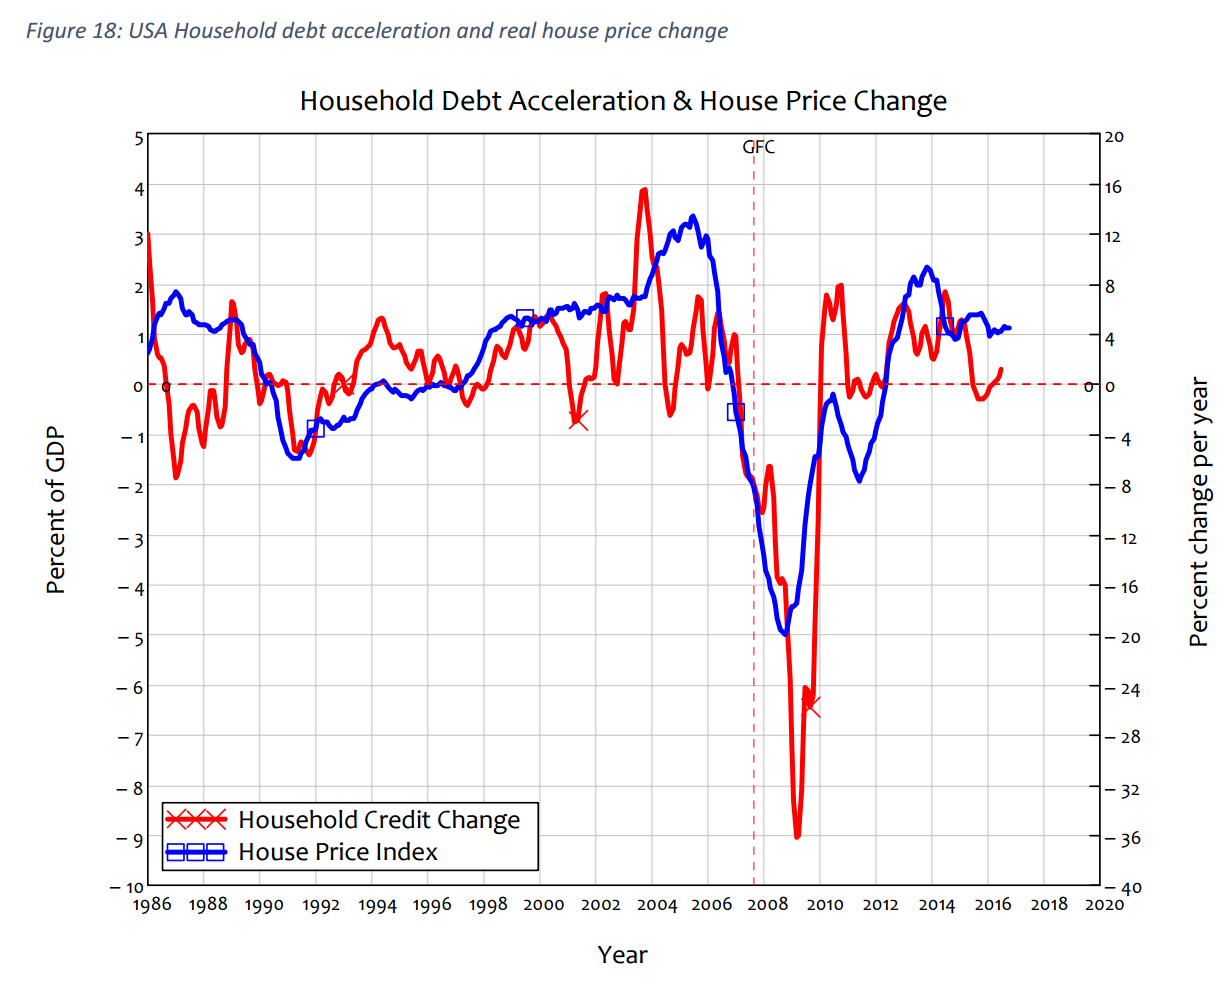
This effect can be seen by comparing the USA, which obviously had a crisis in 2008, to Australia, which managed to delay its crisis. At first glance, the US and Australian experiences appear fundamentally different. The USA had rising household debt in the lead-up to the GFC, and it has fallen since. House prices rose and peaked before the GFC, fell through it, bottomed in 2011 and are now rising again.
Australia, on the other hand, has had rising household debt and rising house prices almost continuously since 1986, which is superficially a very different pattern.
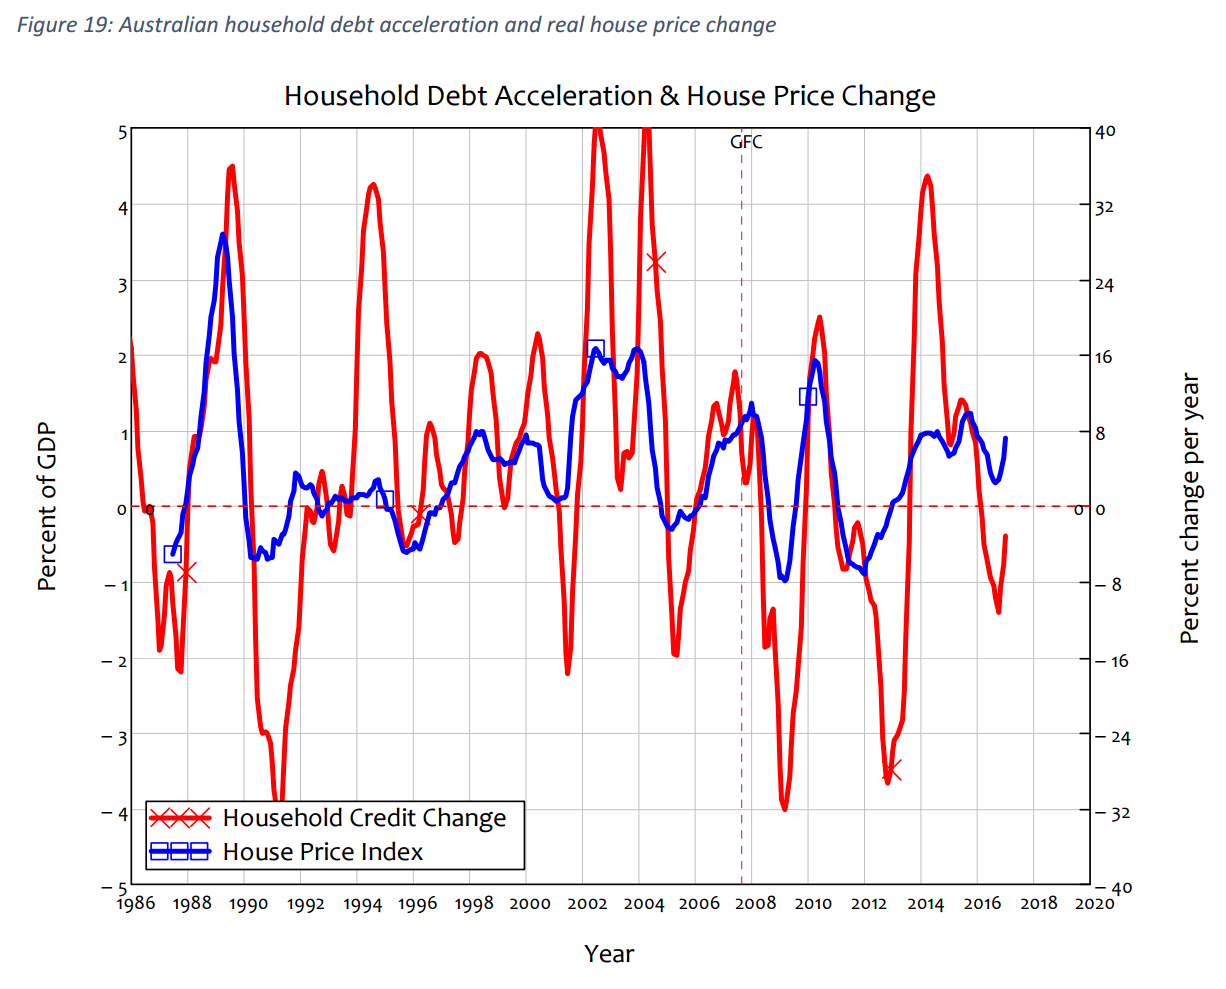
But when you consider the change in household credit (the acceleration of household debt) and change in inflation-adjusted house prices, the causal similarities are obvious: the rate of change of house prices rises when household debt acceleration is increasing and falls when it is falling. The fall in the rate of growth of house prices in the USA also clearly preceded the economic crisis itself.
Australia has avoided a crisis to date because government policies have turned the acceleration of household debt up every time that a crisis has loomed. Doubtless more means to do this will be tried as the price fall takes hold, and they may work for a while. When the fall in house prices becomes widespread, we can expect the government to revamp the “First Home Vendors Boost”, or even worse, to allow first home buyers to use their superannuation for deposits. This will work for a while, as the First Home Vendors Boost did for the Rudd government.
Such policies will increase the maximum ratio for household debt to GDP—when Australia is already the second only to Denmark in 2010. But it cannot enable households to have a forever-rising ratio of debt to income, and this is what is required to forever delay the recession. As household debt level approach their ultimate peak, Australians will finally appreciate the real reason that Donald Horne described Australia as “The Lucky Country”:
“Australia is a lucky country run mainly by second rate people who share its luck. It lives on other people’s ideas, and, although its ordinary people are adaptable, most of its leaders (in all fields) so lack curiosity about the events that surround them that they are often taken by surprise.” (Donald Horne, 1964)