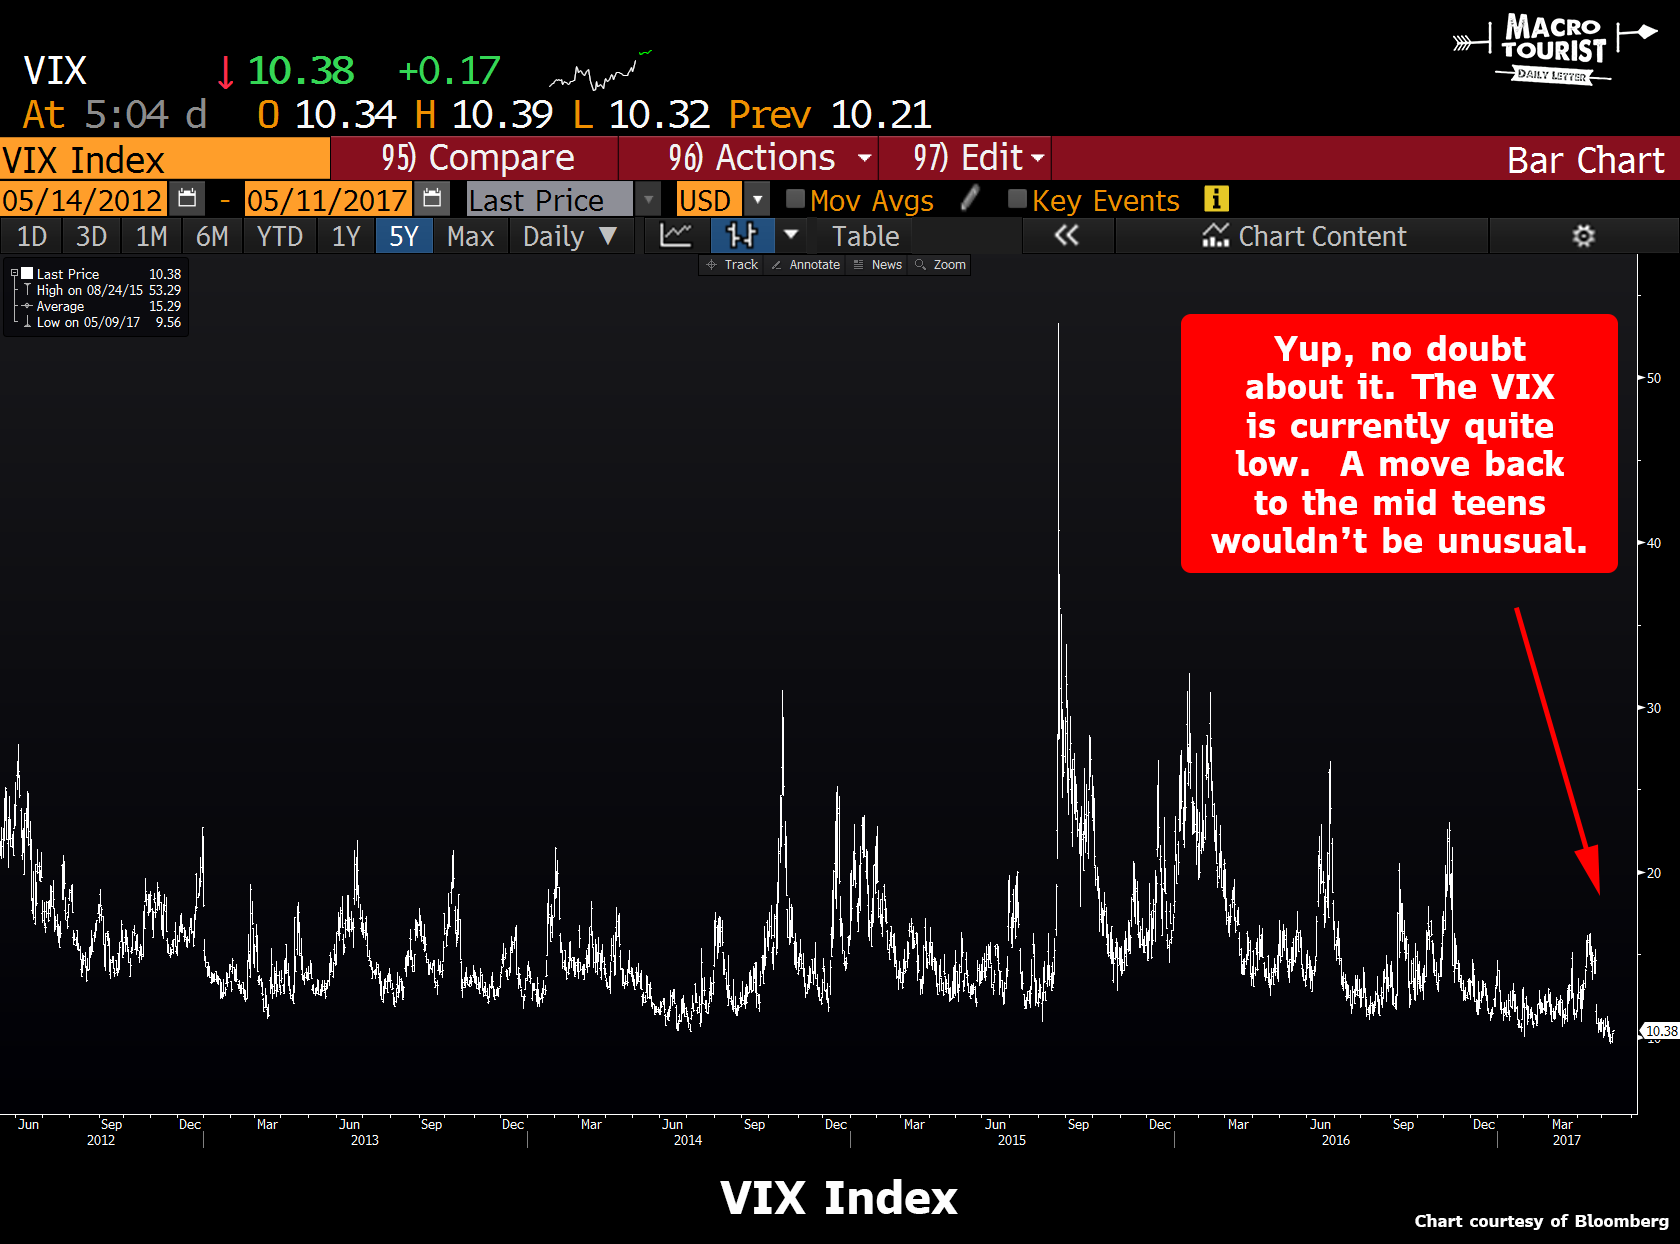
Talk of the town is the cratered volatility index (VIX) and whether or not it is signalling a golden period or imminent catastrophe. Convergex has some good material:
The CBOE VIX Index briefly broke 10 today, essentially half of its long run average of 19.6, and closed at 10.11. In its unofficial role as the primary forecasting tool of near term US equity volatility, that is the equivalent of a Los Angeles weather forecast. 80 degrees and sunny… Next weather update in 5 days. I got to wondering just how many days the VIX has closed below 10 and what that means for future equity returns. The answers:
The VIX has closed below 10.0 a total of nine times since 1990. There are three clusters on that timeline: late 1993 (December 22, 23, 27 and 28 1993), late 2006/early 2007 (November 20/21 with December 14 2006 and January 24 2007), and a standalone January 28 1994.
Three, six and twelve month S&P 500 price returns after December 28 1993 were: -2.3%, – 5.3% and -2.1%. (Worth noting – S&P 500 total returns for 1994 were +1.33%, but 3 month Treasuries returned 4.0%). Three, six and twelve month returns after January 28 1994 were, of course, similar at -6.2%, – 5.1% and -1.7%.
Three, six and twelve month returns after January 24 2007 were +2.8%, +4.9% and -6.1%. The following year was the bad one, with total returns for the S&P 500 of -36.6%.
The takeaway from these examples is clear: in the unusual instances (just 0.13% of the days since 1990) when the VIX closes below 10, one year forward returns have all been negative. In one case (2007 into 2008) the following year was terrible. In the other case (1994 into 1995) it was great – up 37.2%.
Important: the upshot of this quick analysis is this: a VIX close below 10 is historically correlated with a one year pause in S&P 500 returns. The year after that is where things get dicey. You could get a 1995 (+37%) or a 2008 (down 37%).
Now, 3 (2 and half, if we’re being honest) examples isn’t a great sample size. To round out the discussion we need to come to some conclusions about WHY US equity volatility is so low. And what might change that. Here are 10 equity “Puts”: commonly held investor beliefs about current market dynamics that help explain both low volatility and the march higher for US and global equities.
#1) The Fed Put. Ever since Alan Greenspan came to the US equity market’s rescue after the October 1987 crash, there has been a school of thought that says the US Federal Reserve views equity markets as a “Third mandate” along with price stability and full employment. If markets falter, the Fed will pass on a June rate increase and perhaps those scheduled for later in the year as well. Or so the logic goes…
#2) The ECB Put. To the degree to which the European Central Bank has mimicked the Fed’s policies of ultralow interest rates and the purchase of long dated bonds (quantitative easing), equity investors may well feel that there is also an ECB “Put”.
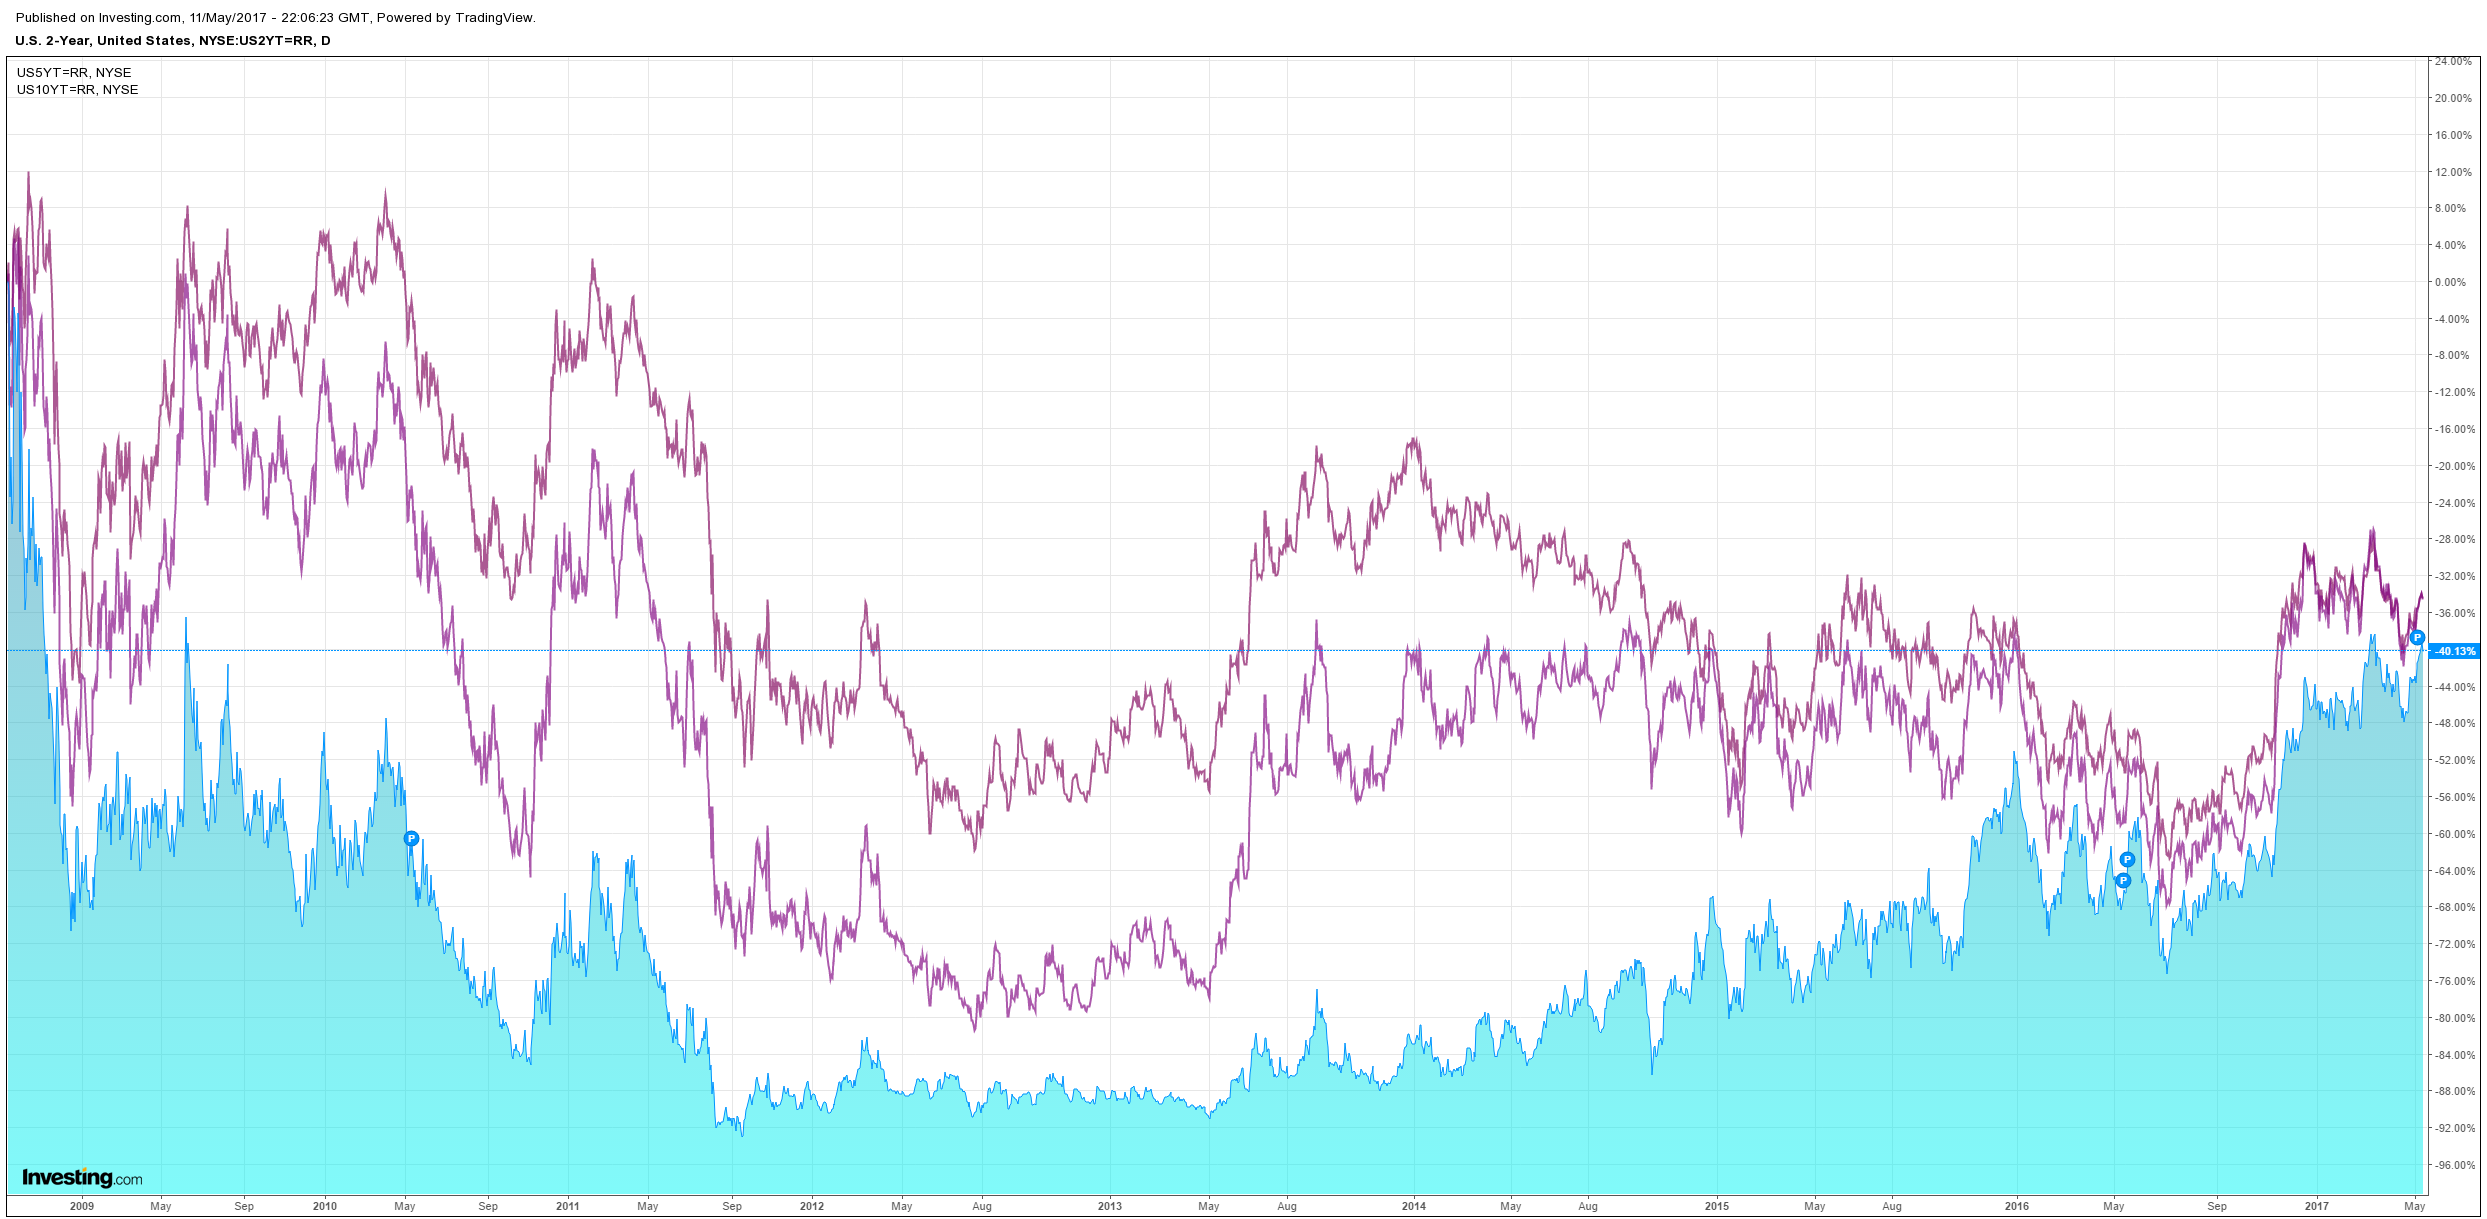
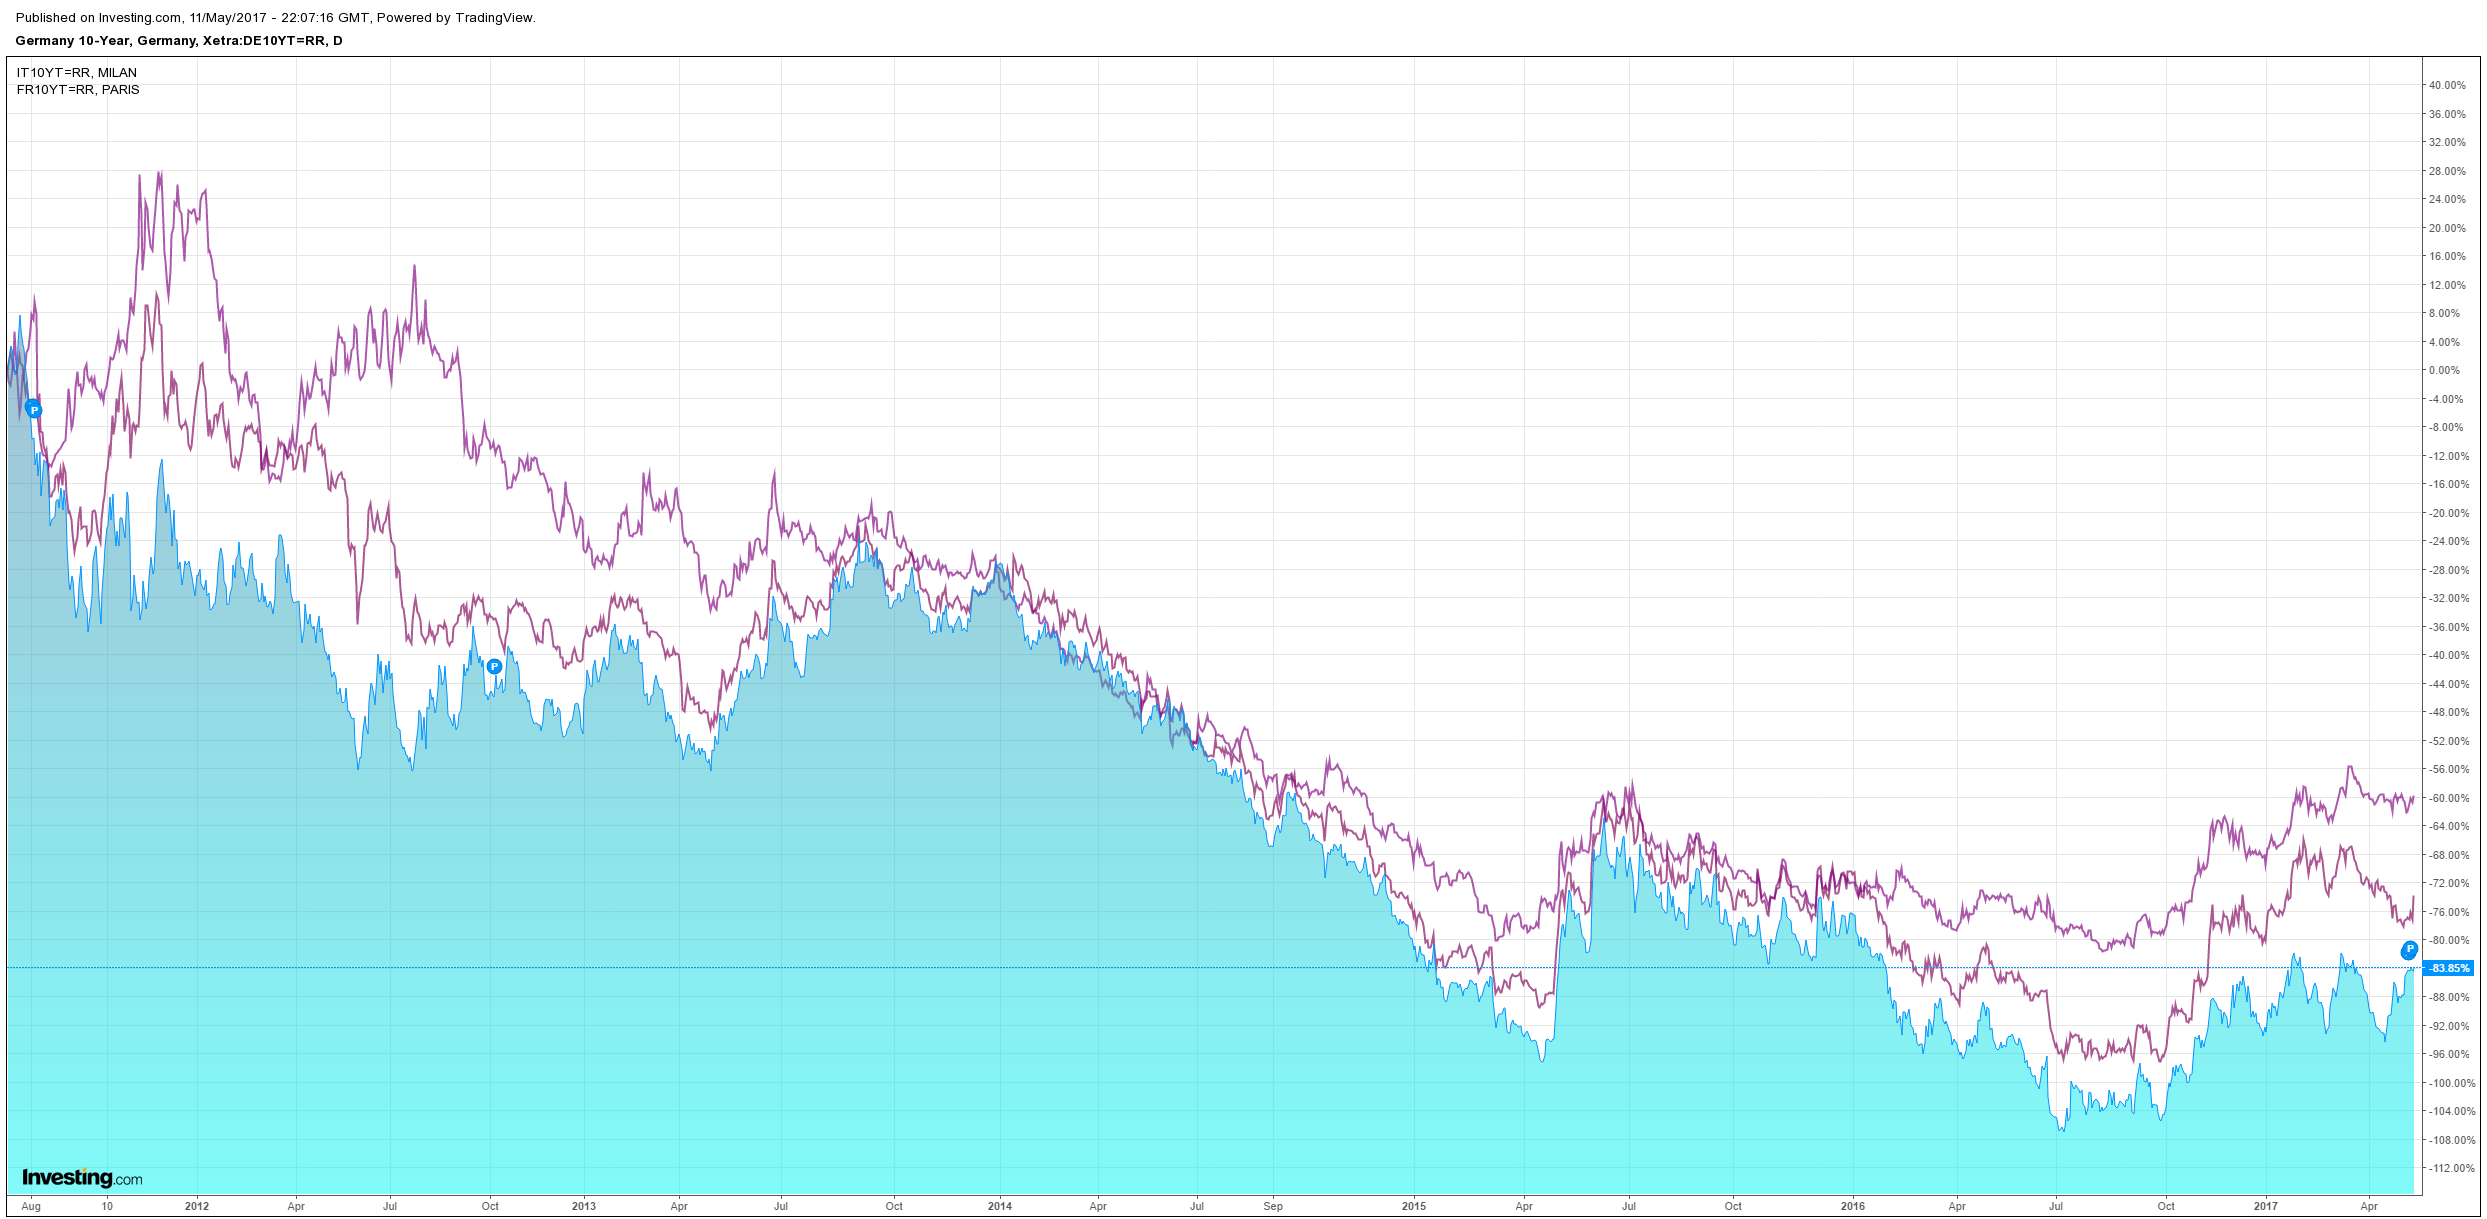
#3) “Long End of the Yield Curve” Put. If global economic growth is about to take a step function higher (as indicated by rallies in US, EAFE and Emerging Market equities) no one seems to have told sovereign debt markets. The US 10 year note for example, yields all of 2.3% and the 10 year German Bund pays a 0.3% coupon. Those low rates help support equity valuations, and if global growth falters those rates will go lower still (and continue to help valuations).
#4) “Trump/Republican Washington” Put. At some point before the mid-term US elections in 2018, President Trump and the GOP – controlled Congress should be able to pass tax reform. That gives equity investors the chance to see earnings estimates rise for 2018 and beyond, supporting current valuations.
#5) “Passive Money/ETF Flow” Put. Year to date money flows into equity US listed Exchange Traded Funds total $121 billion, a pace that will break all prior records if it continues through the end of 2017. Moreover, those flows are remarkably consistent whether you look at the last day, week, month, quarter to date or calendar year. As long as those trends continue, why worry about a market correction?
#6) “Offshore/Corporate Cash” Put. US public companies continue to operate at near-record profit margins, but they are still more likely to buy back their own stock or hold cash offshore rather than invest in their business with those cash flows. That leaves them less prone to financial stress during an economic downturn and therefore reduces their stock price volatility across the business cycle. Also worth considering: if corporate tax reform does come through, these same companies may be able to repatriate some of their offshore cash holdings for buybacks (which would also reduce price volatility, everything else equal).
#7) “Lower Sector Correlation” Put. Since the November US elections, sector correlations within the S&P 500 have dropped from +90% to 55-60%. Should this continue (and absent a major correction, it should), overall S&P 500 volatility will remain lower than when correlations were higher.
#8) “Earnings Beats GDP” Put. As it stands right now, the S&P 500 will post close to a 10% earnings growth rate for Q1 2017. Part of that is from smaller losses in the Energy sector, and part is actual earnings growth in Financials, Materials, and Tech stocks. All of it is enough to allow analysts to expect Q2 2017 earnings growth to run 8%, even though Q1 US GDP growth only showed 0.7% growth when it was released last Friday.
#9) “Receding Nationalism” Put. Now that equity investors seem certain Marine Le Pen will not be the next French president, the prospects for a “Frexit” seem distant. Polls currently have her at 40% of the vote versus Macron’s 60%. See here for a good poll tracker: http://www.bbc.com/news/world-europe-39692961
#10) “GDP Bounce Back” Put. After a lackluster Q1 GDP print, the closely watched (and accurate for Q1) Atlanta Fed GDP Now model has a 4.3% starting estimate for Q2 2017. Blue chip economists are sitting closer to 2.7%, but all agree for the moment that Q2 will be far better than Q1.
I could go on, but you get the point: there is an overwhelming market narrative that equates to “Don’t worry, be happy”. That should be no surprise. You don’t end up with a 10 handle VIX very often, and when you do it is the result of a unique set of circumstances.
I will close where I began, with the possibility of a single digit VIX reading. Historically, that signals the possibility of a pause in equity returns. This means at least a few of our 10 “Puts” will not actually work as anticipated. But the real question is not 2017 – it is 2018. Will next year resemble 1995 (+37%) or 2008 (- 37%). Again, that comes down to how many of these “Puts” survive the next 12 months.
Advertisement
My best guess at this point is that it will resemble neither. We’re going to get a half reflation for another year as inflation stays stubbornly low everywhere, even the US. That will hold back tightening enough to support higher equities but not that high.
But, come 2019 I can’t see how this can hold. Once the Trump sugar hit tax cuts are priced, the reality will be lackluster underlying economic conditions and a tightening Fed. That still appears to be the mot likely trigger fora global shakeout. Capital Economics agrees:
• It is often claimed that the current expansion has lasted so long that a recession must be just around the corner. But history suggests that there is no such hard-and-fast rule.
• If we are right to forecast continued growth in all the G7 economies until at least 2019, this would mark a decade of economic expansion for the group as a whole. However, we don’t think this means that an advanced-economy recession will quickly follow, for several reasons.
• For a start, only the US and UK have actually experienced uninterrupted expansion since 2009. While aggregate GDP of the G7 economies has grown continuously, recoveries in Germany, France, Italy, Japan and Canada have all been punctuated by more recent recessions.
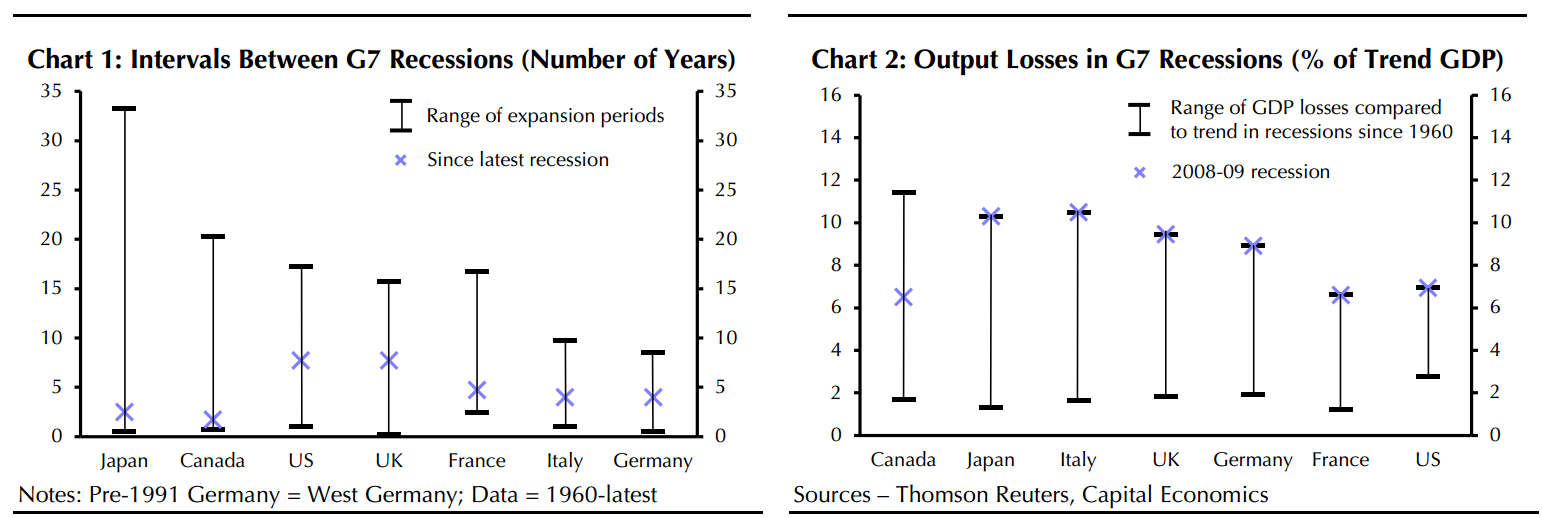
• More substantively, there is by no means a clear-cut rule about the duration of recoveries. Chart 1 shows that there has been enormous variation in the length of time between recessions – defined as at least two consecutive quarters of contracting GDP – across countries and over time. Most of the G7 economies have experienced periods of uninterrupted expansion far longer than their latest recoveries. Prior to 1993, Japan had managed to avoid technical recession since the end of US occupation in 1952!
• What’s more, while it has been many years since the global recession, it was the deepest economic slump for over half a century in most G7 countries. (See Chart 2.) The exception is Canada, whose recession in the early 1980s was deeper and lasted twice as long as its contraction in 2009. As such, the current recoveries began from very low starting points, meaning that they have had further to run before exhausting spare capacity and potentially stoking inflationary pressures.
• Even if an economy is close to or at full capacity, this does not necessarily mean that a recession is imminent. Monetary policy can, in theory, prevent economies from overheating and keep them bumbling along at trend growth rates. Economies can also benefit from boosts to potential growth, such as from new technologies, which can extend non-inflationary expansions.
• Of course, recessions don’t only occur in the “mature” stage of business cycles. Policy mistakes, financial crises and external shocks can bring on an economic slump even when there is a large degree of spare capacity – the euro-zone’s sovereign debt and banking crisis is a case in point. But we are not anticipating any damaging monetary policy mistakes or crises anytime soon, particularly as the euro-zone and Japanese economies are now faring much better than in recent years.
• But none of this is to say that there is no risk of recession. G7 trend growth rates are closer to zero than before 2009, which makes a technical recession more likely. This is especially true of Japan. In addition, Canada is exposed to sharp falls in energy prices, the UK to the Brexit deal, and the euro-zone to ongoing problems in the periphery. Finally, since the risks are higher the closer economies are to full employment, the chances of a recession look greatest in the US, where we see growth slowing in 2019.
Advertisement
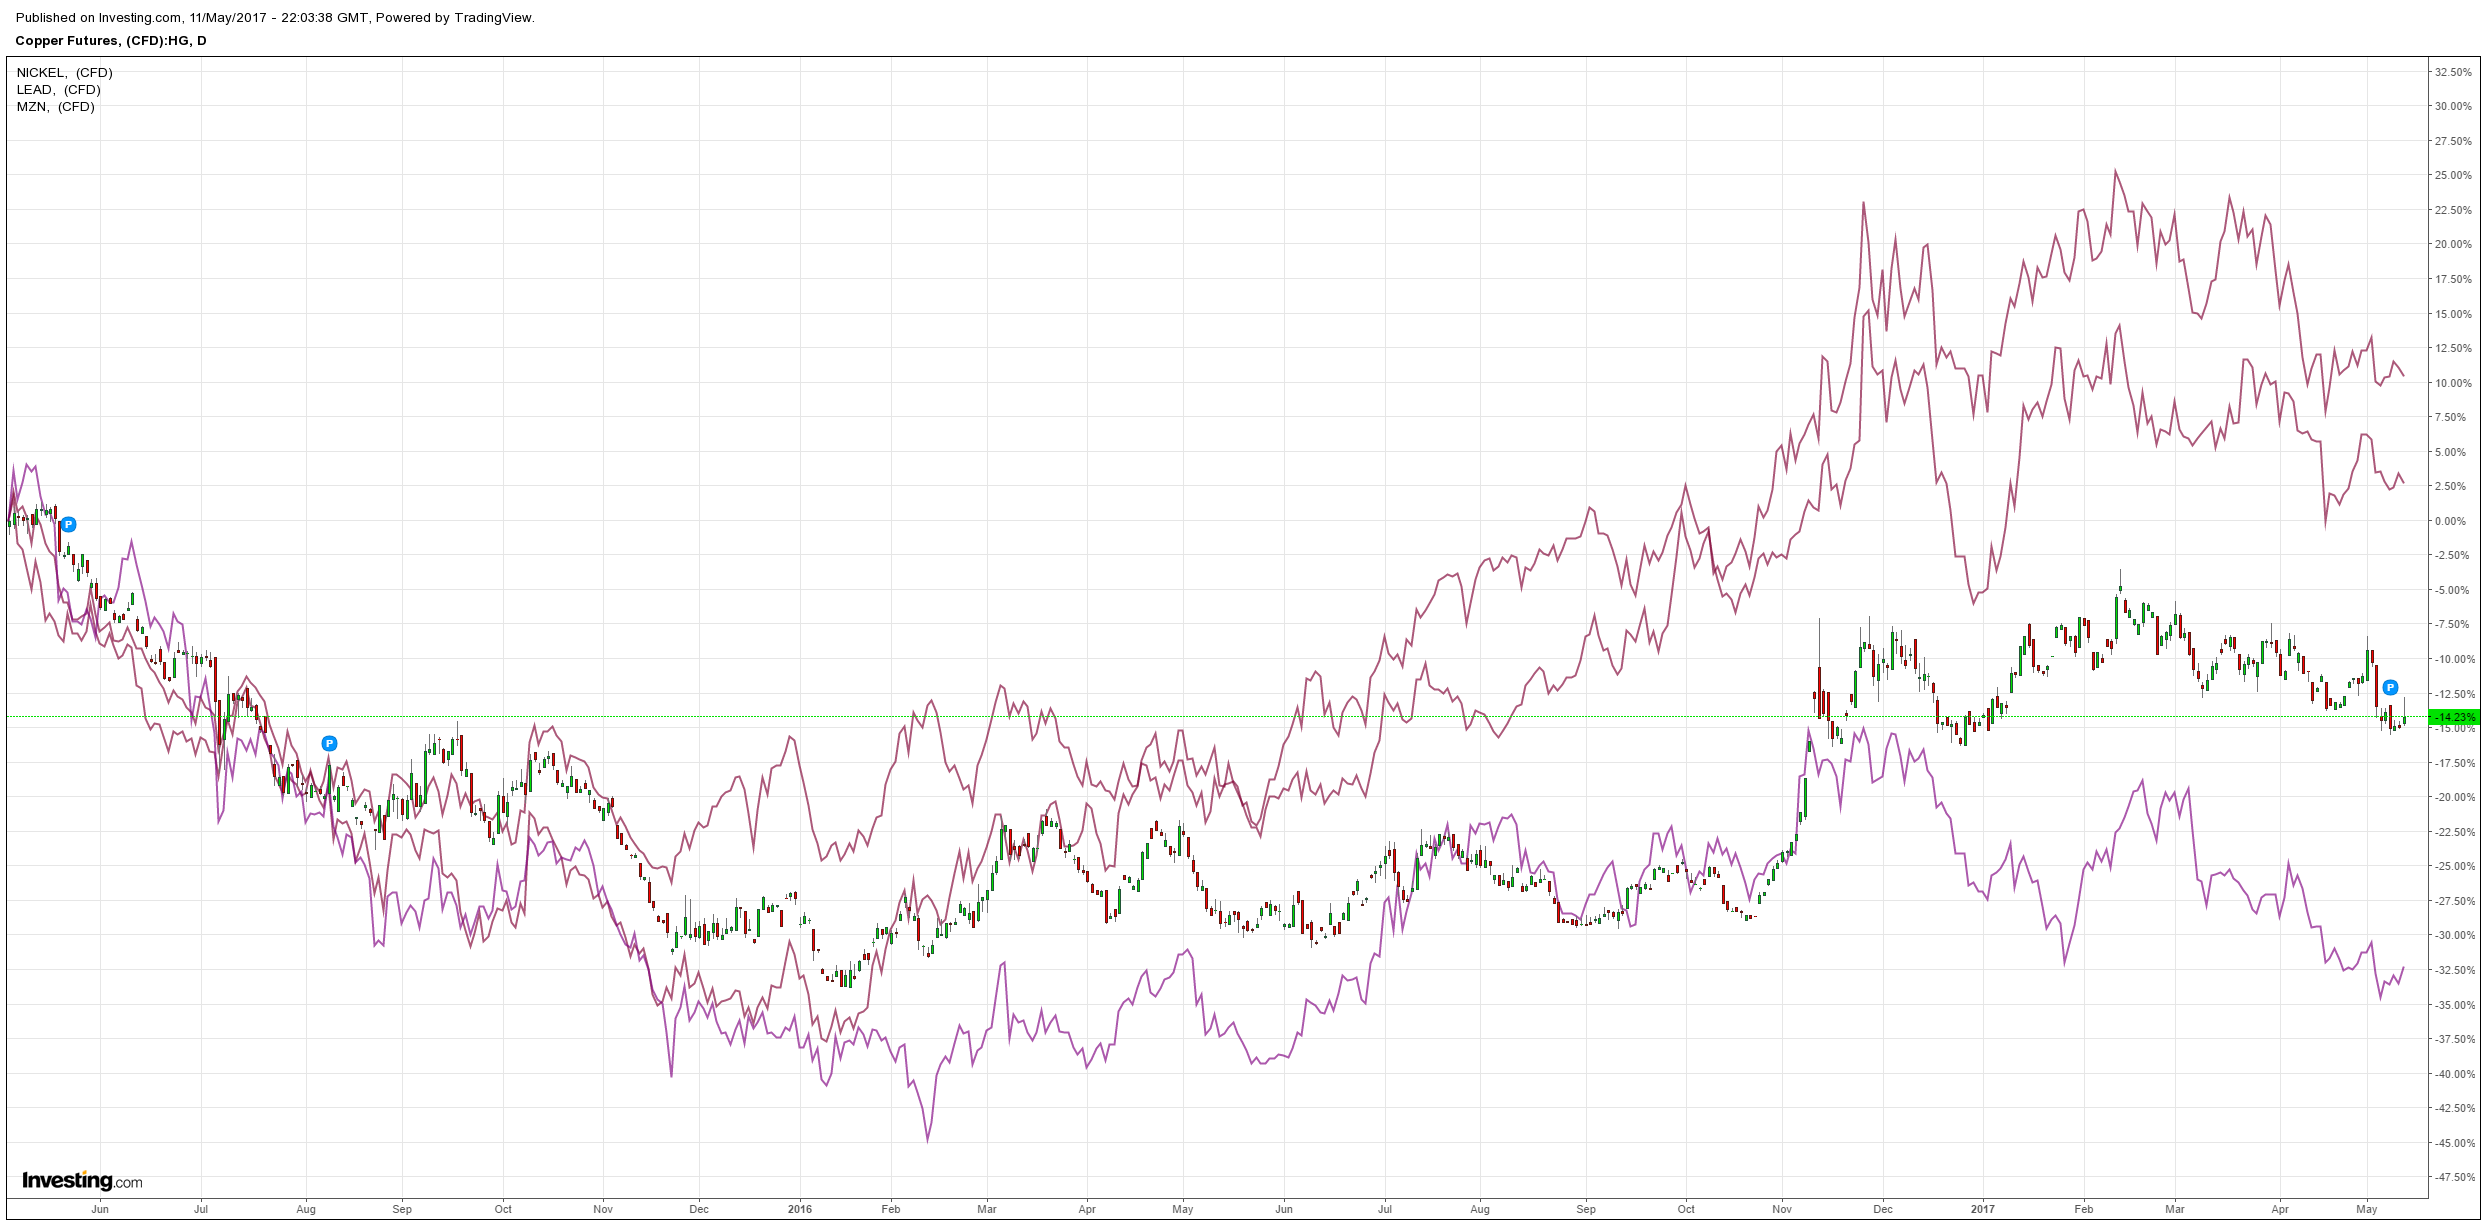
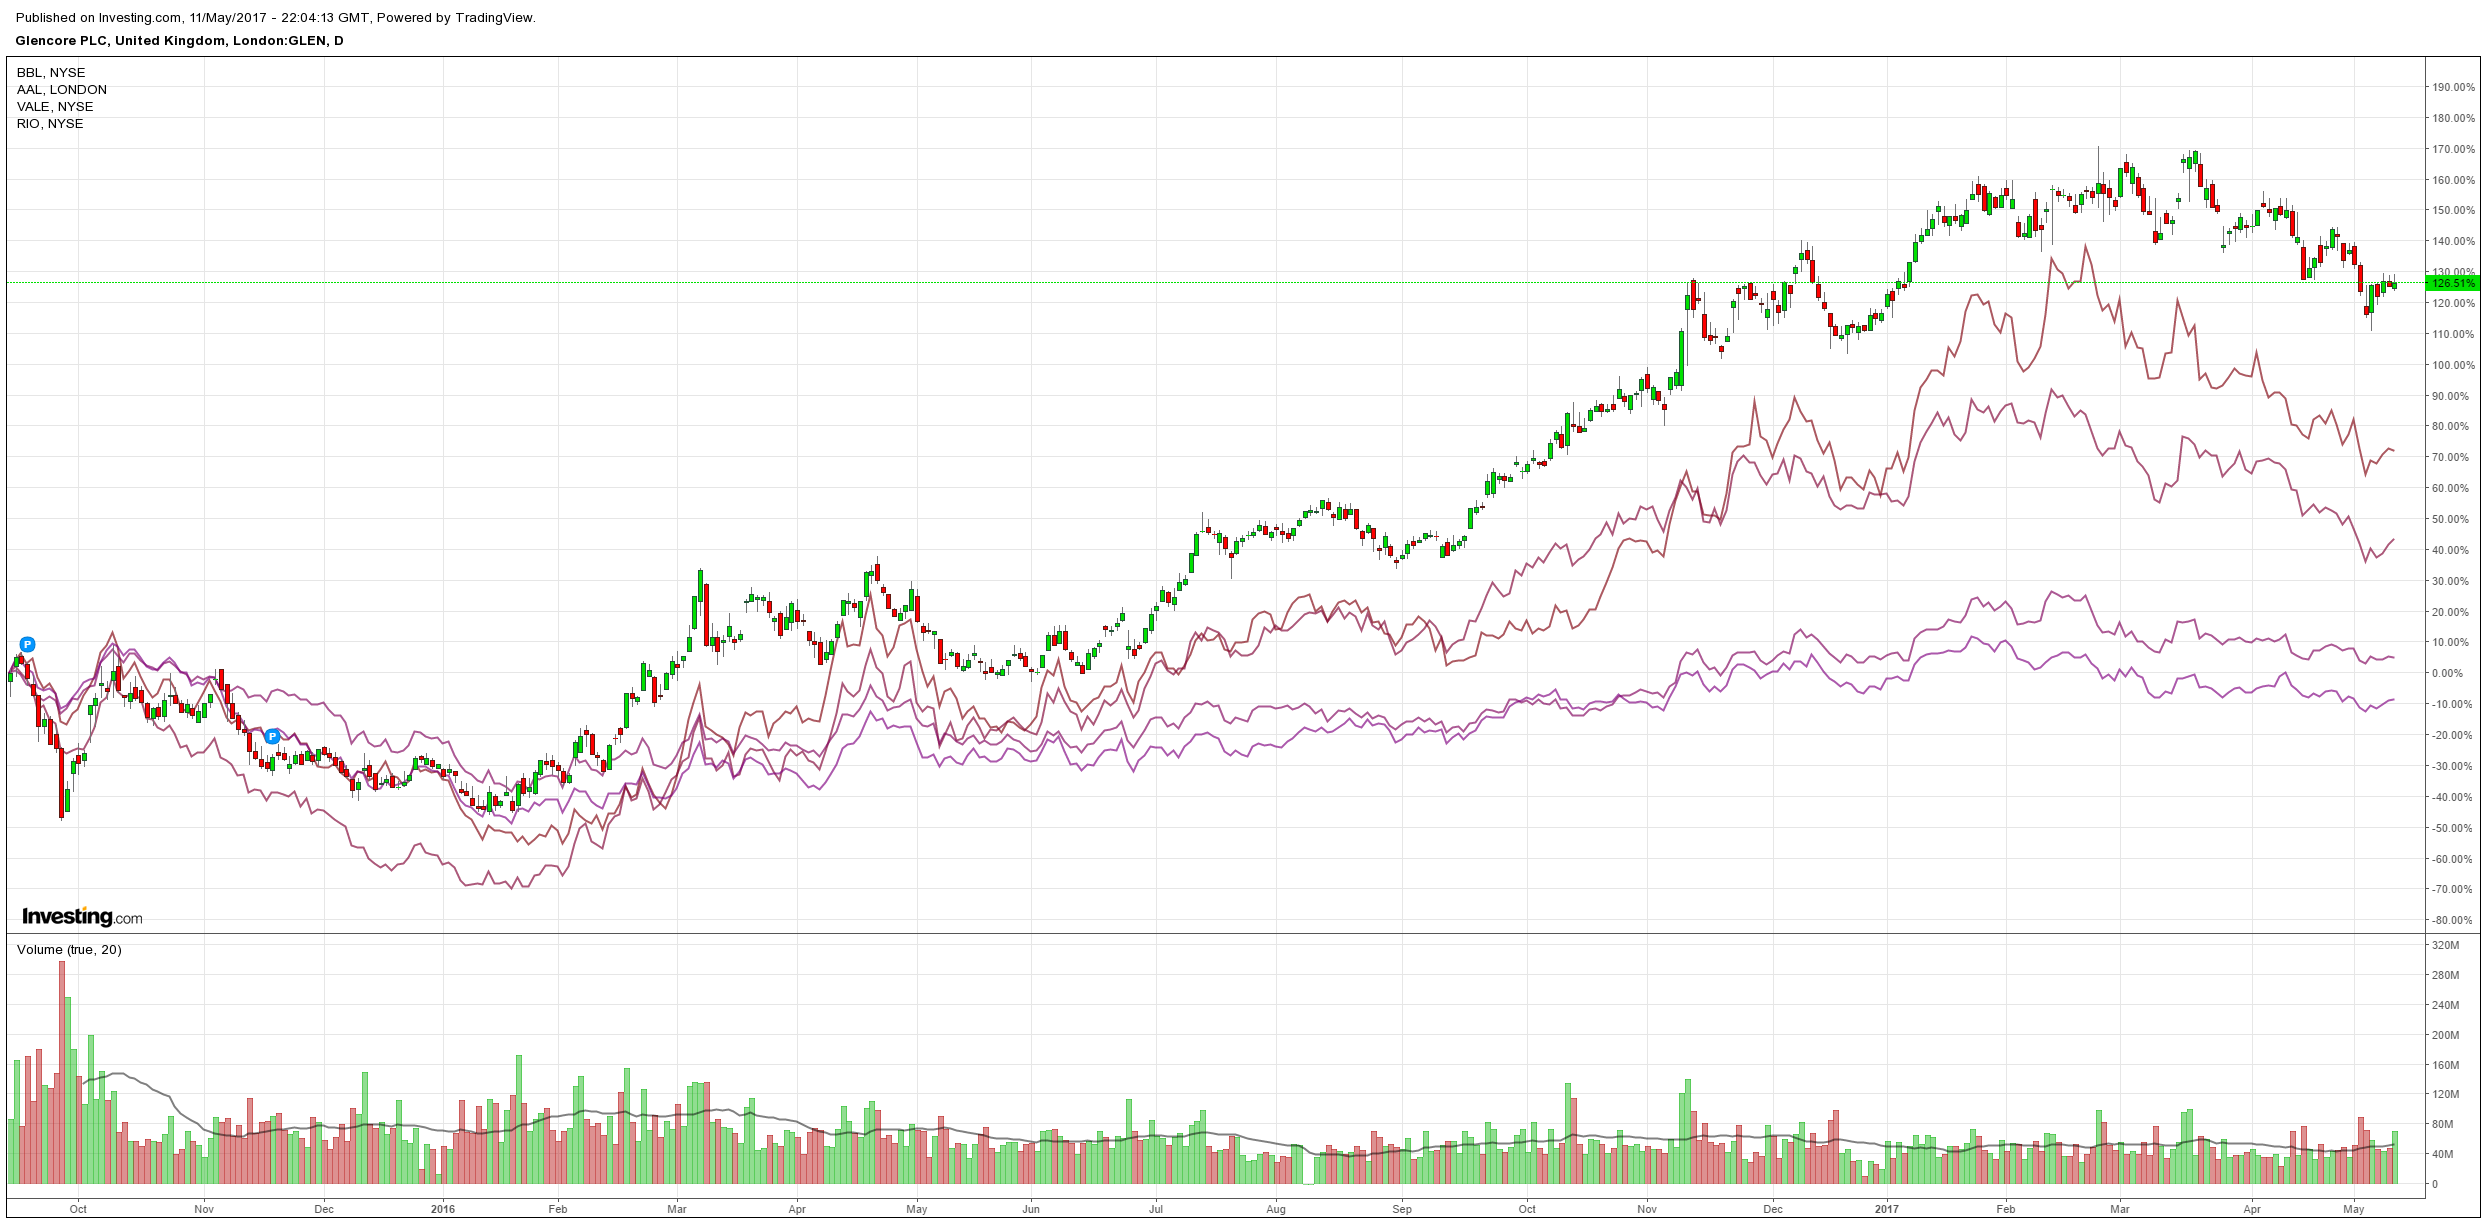
The long tail risk to this outlook remains the Chinese tightening. At some point relatively soon it is going to have a long-cycle credit bust. Whether it is the current round of tightening nobody knows.
David Llewellyn-Smith is Chief Strategist at the MB Fund and MB Super. David is the founding publisher and editor of MacroBusiness and was the founding publisher and global economy editor of The Diplomat, the Asia Pacific's leading geo-politics and economics portal.
He is also a former gold trader and economic commentator at The Sydney Morning Herald, The Age, the ABC and Business Spectator. He is the co-author of The Great Crash of 2008 with Ross Garnaut and was the editor of the second Garnaut Climate Change Review.