Anyone that lives in Sydney or Melbourne will have experienced the crippling rise in congestion on our transport networks first hand. Morning and evening peaks now run for hours, traffic is forever thick on the weekends, and the time taken to travel from point A to point B now takes longer than ever.
Over the weekend, The Australian confirmed what we living in the big cities already know: commuting is fast becoming a nightmare:
The number of vehicles travelling in Australian cities has grown almost tenfold in the past 70 years and, with exponential population growth not being met with adequate road infrastructure upgrades, traffic speeds are crawling to a standstill…
Last year, a report from the Committee for Economic Development of Australia said congestion could cost the nation more than $50 billion in lost productivity by 2031 unless addressed.
The latest congestion bill was $16.5bn in 2015.
Congestion levels on major arterial roads are at a high, with most cities suffering much slower travel times and lower average speeds than previously recorded…
Sydney, which last year was named the nation’s most congested city by peak transport body Austroads, has seen significant reductions in average speeds even since 2011. The population of Greater Sydney has risen by almost 300,000 people during that time, reaching almost five million…
Melbourne is growing by 2000 new drivers each week, with more than 200,000 vehicles travelling across the West Gate Bridge between the CBD and western suburbs each day…
Between 2006 and 2013, speeds on Melbourne’s major arterial roads have slowed by an average of 13km/h, with speeds on the West Gate Freeway entry ramp from Williamstown Road slowing to half the speed limit of 100km/h during morning peak hours…
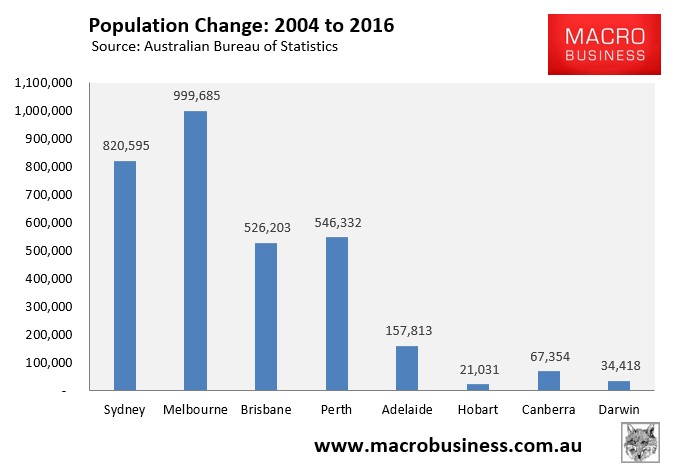
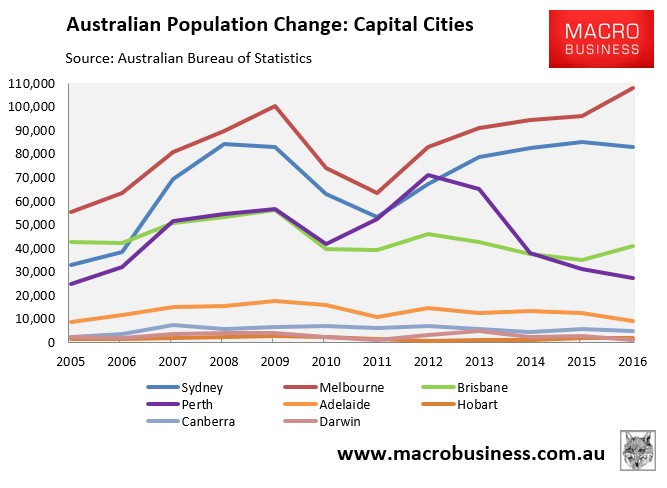
The primary culprit is pretty obvious for those that care to look: the explosion in population growth, which has seen Melbourne add one million people over the past 12 years (a 27% increase) and Sydney add 821,000 people (a 20% increase):
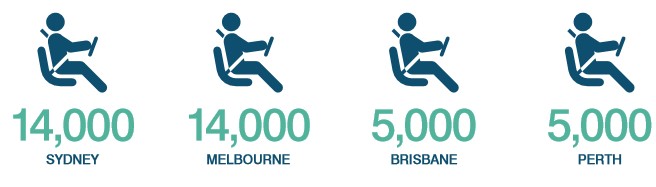
In October last year, Infrastructure Partnerships Australia (IPA) released a report that used Uber driver information to measure “road network performance” in Sydney, Melbourne, Brisbane and Perth to drill down into average travel times at different hours of the day.
The results were based on the following number of drivers in each city:
And found that “efficiency” pretty much followed the level of population growth:
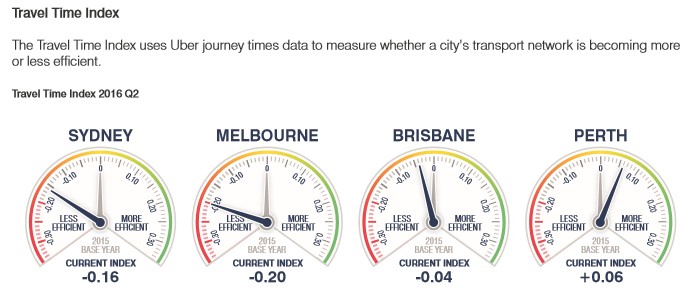
In Melbourne, which is the population ponzi king, travel times have worsened materially, followed by Sydney, which has also experienced strong population growth. Brisbane only experienced a minor worsening in travel times. Whereas in Perth, where population growth has cratered, travel times have actually improved.
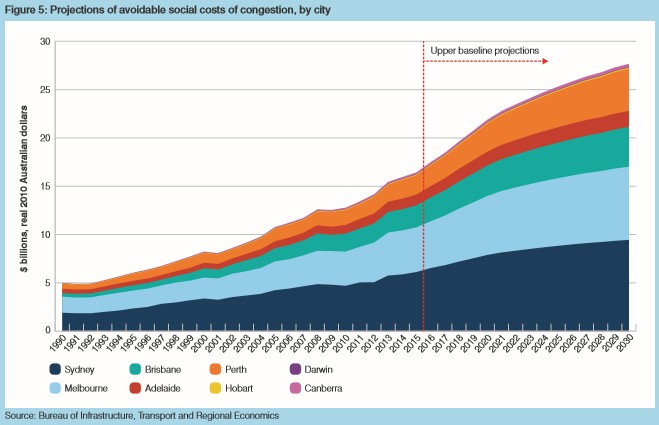
The Bureau of Infrastructure and Regional Economics has also forecast soaring costs of congestion, particularly in Sydney and Melbourne, over the next 15 years:
The underlying driver of this population growth and rising congestion is the ‘Big Australia’ mass immigration program being run by the federal government and supported by the three major political parties – the Coalition, Labor and The Greens.
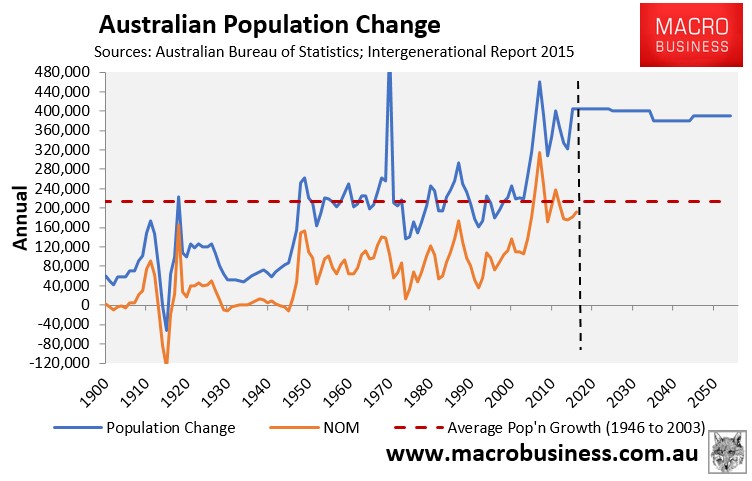
While net overseas migration (NOM) has fluctuated as long-stay temporary migrants have come and gone, the fact remains that Australia’s immigration settings are set at turbo-charged levels and are projected to remain so for decades to come, thus maintaining Australia’s population growth at around 400,000 people a year – equivalent to adding a Canberra to Australia’s population:
Underpinning this high NOM is Australia’s permanent migration program, which is currently 200,000 a year, comprising:
- 128,550 Skill stream places (of which half includes skilled migrant’s family members);
- 57,400 Family stream places;
- 308 Special Eligibility stream places; and
- 13,750 Humanitarian places.
This permanent migration program was ramped-up massively from the early-2000s, as shown in the next chart:
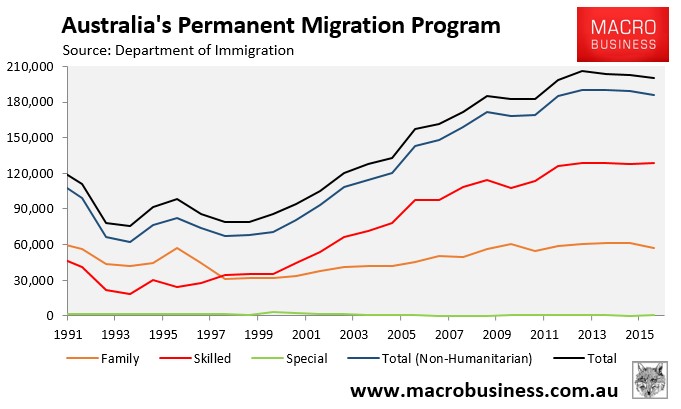
Accordingly, in the 16 years to 2016, Australia’s net overseas migration (NOM) rocketed to an annual average of 200,000 people a year – almost triple the historical average of around 70,000 people a year.
As shown in the next chart, which comes from the Productivity Commission’s (PC) recent Migrant Intake into Australia report, 86% of immigrants lived in the major cities of Australia in 2011, whereas only 65% of the Australian-born population did:
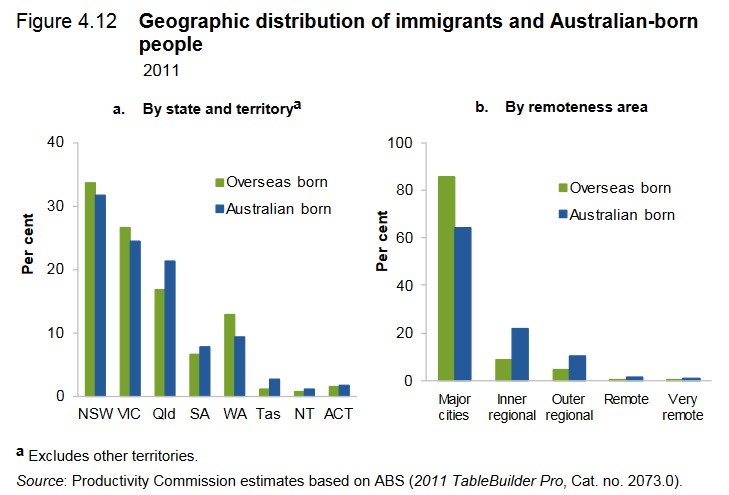
Moreover, “of the immigrants living in capital cities in 2011, most lived in either Sydney or Melbourne, with 1.5 million residents of Sydney and 1.3 million residents of Melbourne born overseas”. Thus, immigration is having a particularly big impact in Australia’s two largest cities, which are already suffering the worst housing affordability and congestion in Australia.
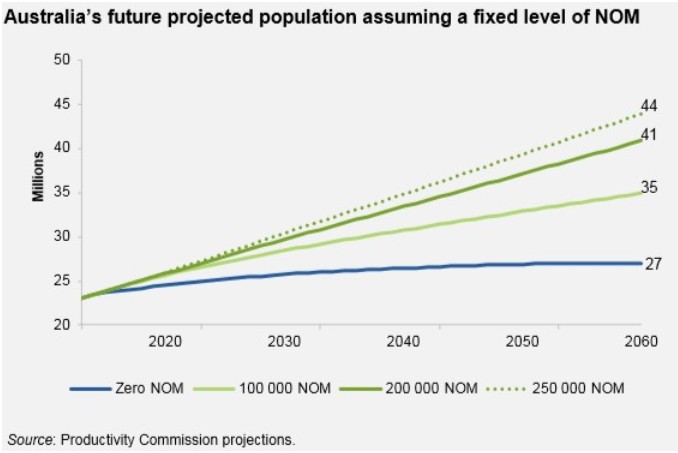
The situation is set to deteriorate even further, too, with Australia’s population expected to grow to around 40 million mid-century under current settings, driven almost exclusively by mass immigration:
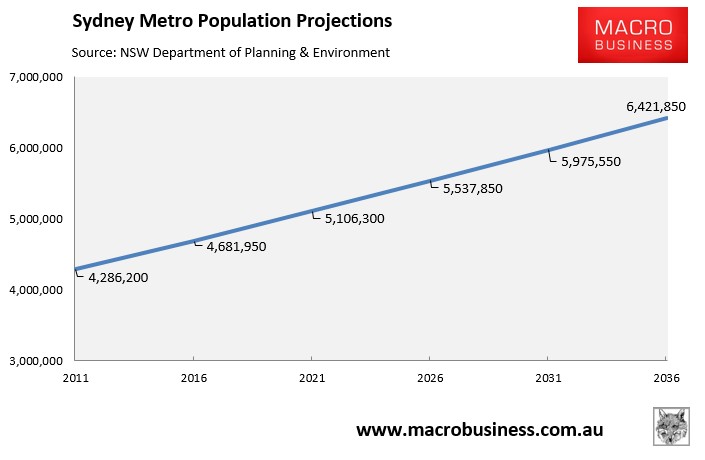
And because of this mass immigration, Sydney’s population is projected to grow by 87,000 people per year (1,650 people each week) to 6.4 million over the next 20-years – effectively adding another Perth to the city’s population:
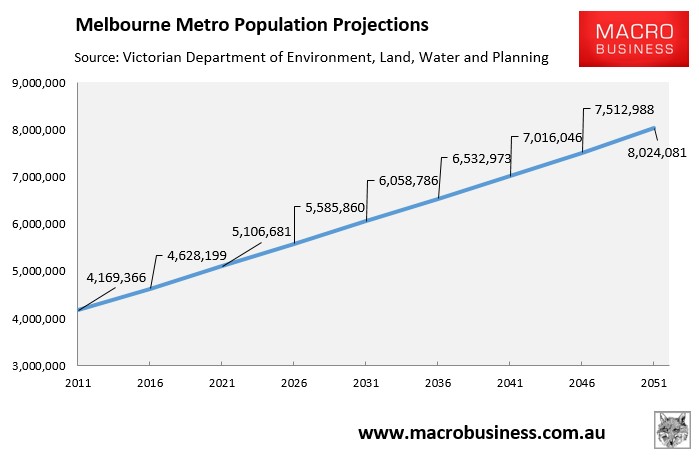
It’s even worse in Melbourne, whose population is projected to balloon by 97,000 people per year (1,870 people each week) over the next 35 years to more than 8 million people – effectively adding 2.5 Adelaide’s to the city’s population over this time period:
It’s common sense that ramming 80,000 to 100,000 extra people into Sydney and Melbourne each year will create immense pressures on housing, infrastructure, congestion, and overall livability.
Even former Treasury secretary Ken Henry gets it, last year sounding the alarm that rapid population growth has overrun infrastructure and housing in the big cities:
“My observation in Sydney, in Melbourne, today is that people already think – with very good reason – that the ratio of population to infrastructure is too high,” he said.
Australia will need to construct a new city every year as big as Canberra or Newcastle to accommodate the expanding number of people, he said. Or, every 5 years,
Australia would need to build an entire new city from scratch for 2 million people; or an entire new city as big as Melbourne every decade.
Without such action, there will be more congestion, longer commute times to work and increasing problems with housing affordability…
Where is the national plan to cope with this mass immigration? How will Australia’s governments and businesses ensure that incumbent Australians’ living standards will not be eroded by the associated pressures on infrastructure, housing, the environment, and the dilution of Australia’s fixed mineral endowment, which is a key driver of our wealth and living standards?
Residents of Sydney and Melbourne, in particular, know that their living standards will be smashed if mass immigration is allowed to continue. Therefore, reducing immigration back to the long-run average of 70,000 people annually, as advocated by the Sustainable Australia party, is becoming critical. This would see Australia’s population stablise at around 32 million mid-century, rather than the current projection of around 40 million.
Because as it stands, Australia cannot possibly hope to build enough infrastructure to supply a Canberra-worth of new residents each and every year for decades to come, which is what we are facing under Australia’s current mad immigration settings.
