MacroBusiness

  • Home
  • Invest with MB
  • Primers
  • Aust. Economy
    • Back
    • Aust. Economy
    • Australian Politics
    • Australian Property
    • Australian Shares
    • Australian Dollar
    • Australian interest rates
    • Australian banks
    • Australian budget
  • Global Macro
    • Back
    • Global Macro
    • Carbon Economy
    • China Economy
    • European Economy
    • New Zealand Economy
    • US Economy
    • Economics
    • Capitalism
    • Global Housing
  • Commodities
    • Back
    • Commodities
    • Iron ore price
    • Australian LNG
    • Gold

Start your free 14 Day Trial

  • Access Subscriber Only Content
  • Special Reports with Unique Insights
Subscribe
Already a member?
Log in here
  • Search
  • Login
  • Start Free Trial

left

MacroBusiness

right

right mobile

MacroBusiness
  • Search
  • Login
  • Start Free Trial
  • Home
  • Invest with MB
  • Primers
  • Aust. Economy
    • Australian Politics
    • Australian Property
    • Australian Shares
    • Australian Dollar
    • Australian interest rates
    • Australian banks
    • Australian budget
  • Global Macro
    • Carbon Economy
    • China Economy
    • European Economy
    • New Zealand Economy
    • US Economy
    • Economics
    • Capitalism
    • Global Housing
  • Commodities
    • Iron ore price
    • Australian LNG
    • Gold

Primary Section

Share on Facebook Share on Twitter Share on Reddit
+
-

The terrifying 157 year history of Australian mortgages

By Houses and Holes in Australian banks, Australian Property, Featured Article

at 8:53 am on April 7, 2017 | 38 comments

In the words of UBS’s Jonathon Mott, a picture tells a thousand words:

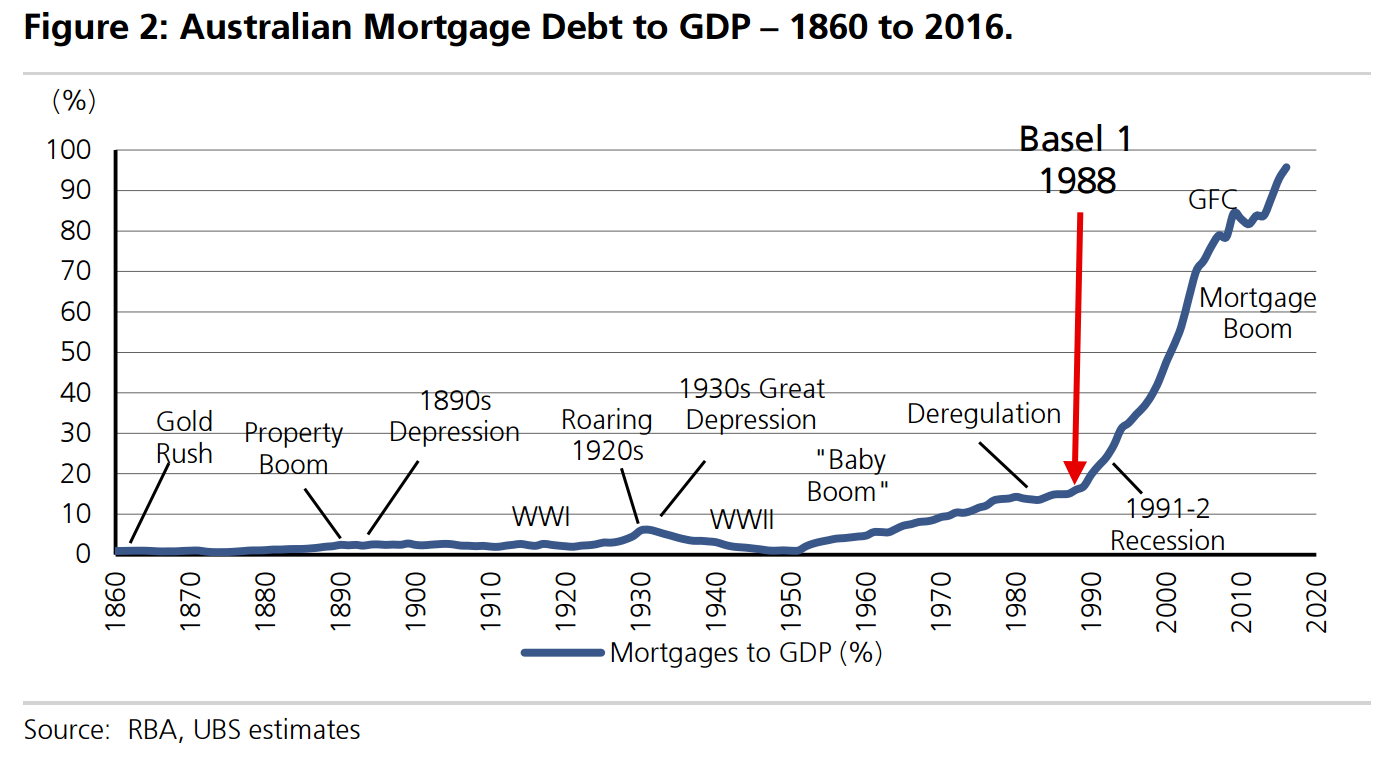
Figure 2 provides a clear illustration of the increase in household indebtedness. We look at Australian Mortgage debt to GDP back to 1860 from RBA data. We found that Australia has historically had a very low level of mortgage debt, even though previous cycles such as the 1880s property boom and the Roaring 20s. Although mortgage credit began to accelerate post WWII, especially via Building Societies leverage was low. With the introduction of the Basel Accord in 1988 and the reduction in mortgage risk weights to 50% mortgage indebtedness hit an inflection point. From this time banks could leverage their mortgage books more significantly, than other lending products and allocated a greater proportion of their book to mortgages.

The introduction of Basel 2 in 2007 took this further with the Major Banks moving to internal models (A-IRB) and reducing mortgage risk weights down to mid-teen levels. With low CET1 ratios this implied mortgage books could be leveraged ~80 times. While APRA’s decision to increase mortgage risk weights back-up to an average of 25% from July 2016 and the banks stronger capital ratios have unwound some of this excessive mortgage leverage, we see APRA’s announcement yesterday that it will release an Information Paper which further increase capital held against the mortgage book as a positive move for financial stability.

No worries, mate.

Share on Facebook Share on Twitter Share on Reddit
+
-

YOU MAY ALSO BE INTERESTED IN

Does falling mortgage growth matter for house prices?

Does falling mortgage growth matter for house prices?

By Leith van Onselen Following yesterday's

CoreLogic: Listings surge causes heavy vendor discounting

CoreLogic: Listings surge causes heavy vendor discounting

By Leith van Onselen This week's Housing Pulse

Final auction clearance rate dives back into the 40s

Final auction clearance rate dives back into the 40s

By Leith van Onselen Last weekend, CoreLogic

Mortgage credit growth accelerates downwards

Mortgage credit growth accelerates downwards

By Leith van Onselen The Reserve Bank of

Comments are hidden for Paid Subscribers only.

Start your free 14 Day Trial

  • Access Subscriber Only Content
  • Special Reports with Unique Insights
Subscribe
Already a member?
Log in here
MB Fund

Put the power of MacroBusiness into your portfolio.
Click for more information

Recent Performance* Jan 2019 Since Inception (p.a.)
MB International +4.3% +10.3%
MB Tactical Growth +3.6% +7.7%
MB Tactical Foundation +2.3% +6.2%
*The above returns include trading costs and maximum administration fees – clients with higher balances will have better performance. Note individual client performance will vary based on the amount invested, ethical overlays and the date of purchase. Past performance is not an indication of future performance.
Special Reports
  • Asset allocation in the great Australian adjustment
  • Australia and the 100 year bust
  • How to profit from a house price crash
  • Is the commodities crash finally over?
  • MacroBusiness Seminar Series
  • Master yourself, then markets
  • Tackle risk for super returns
  • The economy in February
  • The great housing "shrinkflation"
  • The negative gearing bible
Recent Posts
  • Julie Bishop deals death blow to Scummo | 77 comments
  • Australian dollar hammered as China bans Aussie coal | 67 comments
  • Bill Evans breaks: RBA to cut, cut, cut! | 21 comments
  • Westpac hit with class action over ‘irresponsible’ mortgages | 48 comments
  • McGrathmageddon: “Exceptional” property market “resurgent” | 38 comments
  • Corruption swamps Scummo Government | 82 comments
Meet the bloggers
  • Cameron Murray
  • Chris Becker
  • Damien Klassen
  • David Llewellyn-Smith
  • Deep T.
  • Delusional Economics
Follow us on social media
Back to Top
  • About
  • Contact
  • Subscribe Free
  • Comment rules
  • Disclaimer
MacroBusiness
Copyright © 2019 Macro Associates ABN: 17 149 497 530.
Website Design &
Development by Emmix