Does the RBA understand what it’s taken on in household debt?
From Bill Evans of Westpac today:
Given the Reserve Bank’s intense concentration on stability issues, including the introduction of new guidelines from APRA, the April Stability Review is of particular interest.
Our interest is twofold. Firstly to gauge the degree of concern with which the Bank views the current risks and secondly whether it has released any new research which sheds more light on the issues.
Evidence on the first issue confirms the Bank’s concerns. “Risks to household balance sheets and housing markets have increased.” Compare that assessment with the previous Review in October last year, “Risks to financial stability from lending to households have lessened a little over the past 6 months.”
The risk that was emphasised back in October – “risks around the projected large increases in supply in some inner city apartment markets are coming to the fore, especially in Brisbane and Melbourne” – is still seen to be a major consideration – “concerns about an oversupply of apartments in pockets of Melbourne and in parts of Brisbane.”
Current risks around household balance sheets are seen to be macroeconomic in nature rather than direct risks to the stability of financial institutions. The key dynamic is seen to be “a highly indebted household sector is likely to be more sensitive to declines in income and wealth and may respond by reducing consumption sharply”.
Of most interest is the investor. While the Bank recognises that arrears data shows that investors have historically performed better than owner occupiers, this observation has not been tested “in a severe downturn.”
The recent guideline from APRA to limit the interest only component of new lending to 30% appears to be aimed at investors. Only around 23% of owner occupier loans are interest only whereas 64% of investor loans are interest only. IO loans have a higher average indebtedness over the loan than principal and interest; while after the IO period expires (typically 5-10 years) repayments are considerably higher.
Since the October Review, household indebtedness has increased further primarily due to rising levels of housing debt and weak income growth.
The Bank has emphasised in the past that offset accounts and redraw facilities have increased considerably (at around 17% of outstanding balances or around 2.5 years of scheduled repayments at current interest rates).
But around one third of borrowers have either no accrued buffer or a buffer of less than one month’s repayments. For the vulnerable “highly indebted households”, which represent the top 10% on the household debt to disposable income ratio measure, only 40% hold any kind of buffer.
Presumably as new lending lifts this ratio will continue to rise since minimal buffers are dominated by newer mortgages or lower income or lower wealth households. This ratio strongly debunks the assertion that the “buffer” is an important source of stability.
However, in previous Reviews a much more relaxed Bank has emphasised the point that those borrowers with the high leverage tend to be the high income earners who can best manage debt. The Review takes a revised look at “Highly Indebted Households”.
The aggregate household debt to income ratio has increased further in recent years up to 160%, but 30% of households have no debt.
In assessing the characteristics of highly indebted households the Bank uses information on the distribution of debt, income, and wealth which is available in the Household, Income, and Labour Dynamics Survey (HILDA). Unfortunately this data is only available to 2014. In fact it is only collected every 4 years with the next survey due for 2018 – an interminable wait for an update to the critical issue of whether debt is accumulating with those borrowers who are the most vulnerable.
The Household Debt to Disposable Income ratio has risen from around 150% to over 160% (latest available). The Bank defines a “highly indebted” household as one with debt to income ratio in the top 10%. Over the 10 years to 2014, households in that group had a debt to income ratio above 550% and represented 35-40% of total household debt. Around 30% of the “highly indebted” households’ debts were investor loans.
Of some concern is that around 25% of the highly indebted households are in the bottom two quintiles for income and wealth, although this group only owes 12% of the debt owed by the highly indebted households. These “ratios” confirm the Bank’s previous position that much of the debt held by highly indebted households is owed by households with high income and wealth. However, the lift in household indebtedness since 2014, coupled with the lack on any significant “buffer” for the highly indebted borrower, must be presenting reasons for the Bank and APRA to raise concerns.
The other issue is around the risks of relying on “averages” . Even though the 2014 data indicated that only 12% of the debt of highly indebted borrowers is held in the two bottom income quintiles, that still represents nearly 5% of total household debt.
The policy challenge for the Bank is clear. It’s most comforting “defence” of the risks associated with Australia’s high household debt is that high debt levels are associated with those in the best position to deal with them – high income / high wealth. But this data is already three years out of date and an update will not be available for another year at least. Household debt to disposable income ratios have lifted from 150% to above 160% over that time period and appear to be rising further.
Vulnerable borrowers with limited buffers appear to be growing. The higher risk aspects of interest only loans may be exacerbating that issue.
All the Bank can really do is focus on slowing the rise in household debt without really having much comfort about the risks they face.
For our part we remain reasonably relaxed about these risks, not because of the distribution of the debt, but because we see that Australia has sufficient flexibility around policy; its exchange rate and strong banking system to ameliorate the impact of shocks.
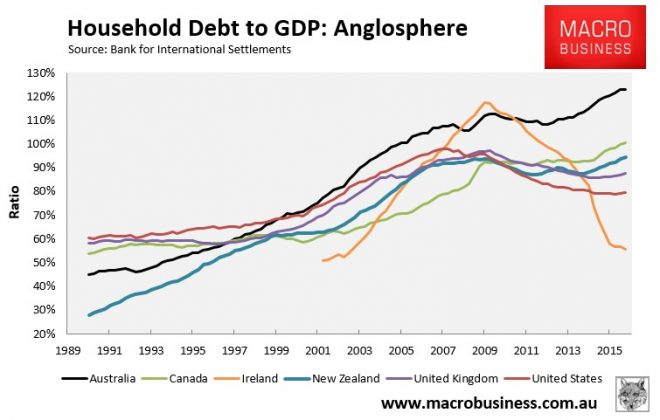
Whether it is fast or slow, if it is still rising then it is making risk worse. This is where the RBA’s stand on household debt turns from admirable to quixotic. You can’t seek to cap or reduce it without causing very serious structural change in the economy, including causing a lot of pain to various interests.
Whenever we’ve deleveraged households before, domestic demand has suffered a lot:
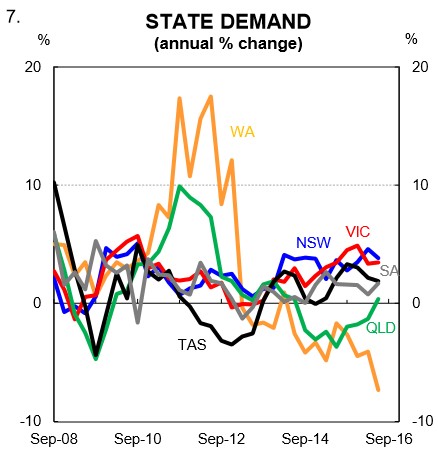
In the period from 2010 to 2012 we did it to “make room” for the mining boom but that had much of the east coast economies in effective recession, offset by insane levels of investment and growth in mining states, the notorious “two speed” economy, chart from CBA:
Now just imagine doing it with all states at once. We’ll be in and out of recession like a metronome. There are several other unavoidable conclusions.
Even if household debt is only stable relative to GDP and income at, say, 2.5% growth per annum, then that I very much doubt that that is enough to keep house prices rising. Much more likely they’d be falling. That means that consumption will be hit hard and so will housing construction. So, some 66% of GDP inputs would be contracting at some pace:
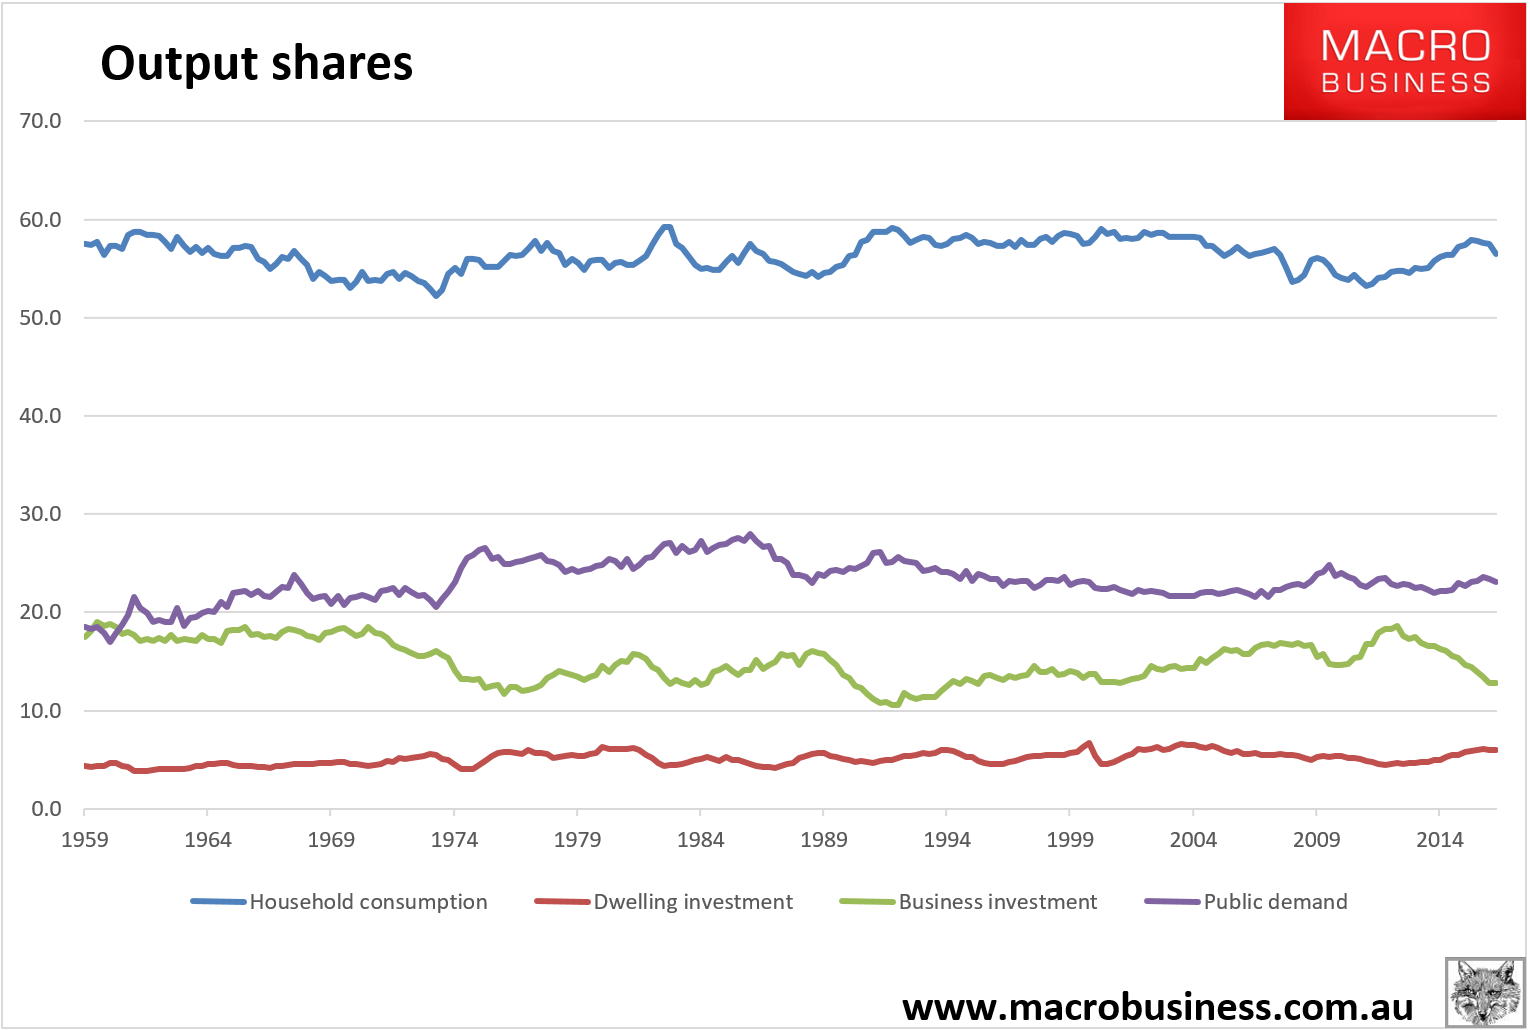
I think it highly unlikely that business investment would be growing amid such lackluster demand so let’s call that zero as well.
That leaves public demand and net exports to drive growth. The former would almost certainly be growing its debt load very fast, and its share of the economy too, but even that would be constrained by sovereign downgrades that would threaten to turn the private sector disleveraging into a dislocation.
So, in truth, that bring us to the only real option on the table to grow the economy post-household debt: net exports.
40% of the economy is tradable – exports and import competers – and it is this external sector that would have to drive growth. It would hopefully grow fast enough to provide some uplift in business investment, enough to give us net growth in that segment, by offsetting the downdraft coming from falling investment in domestic-exposed business.
How are we doing on that front? Great at the moment:
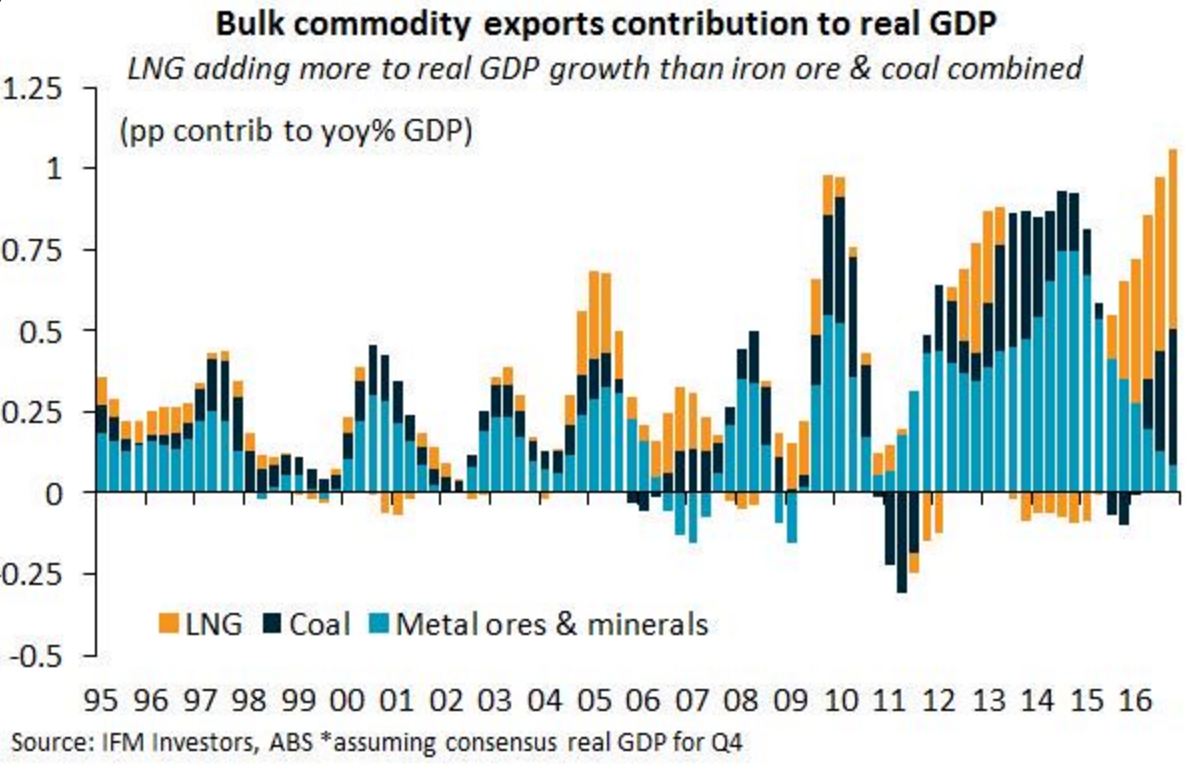
Agriculture has been good too. But note that these contributions will all fall back to 1990s levels soon and then the hard work really gets started as volume growth must come from non-mining tradables.
Alas, that sector has been decimated for year after year by the Double Dutch Disease of banking and mining led growth. These charts are a little old and things have improved a little but give you the general idea:
In policy terms, this is the sector that we’re still largely ignoring and even actively shedding (in areas such as vehicle assembly). What it will take to turn this around is nothing short of a political revolution requiring:
- huge productivity-based structural reform:
- a push towards industry policy;
- permanently fixing the energy crisis;
- a whole range of policies aimed at lowering the currency;
- land price deflation;
- across the board tax reform…
And on it goes. All of this will have to be couched in such a way that Australia’s rabid vested-interests are held at bay enough that the pain can be shared or political chaos will also accelerate. We have to rely on today’s crop of outright political morons to deliver this.
All of this is going to happen one way or another but given the parlous state of politics I’m more inclined to think that it will happen via the exhaustion of every available resource to prevent it happening then markets forcing it one almighty crash.
More power to Phil Lowe for pushing this cap on household debt. He’s doing what should be done (alas five years too late) and forcing at least some responsibility back onto fiscal policy.
But let’s not kid ourselves, he’s picking at a scab under which is not some shallow graze but the ruptured artery of the Australian economy. The current government will provide no support. Labor is better positioned with its negative gearing reforms and non-mining tradables focus but nobody yet has fully articulated the gravity of what is going on here.
Households are going to delever and there are no policy settings in place, or planned, to cope with it.
