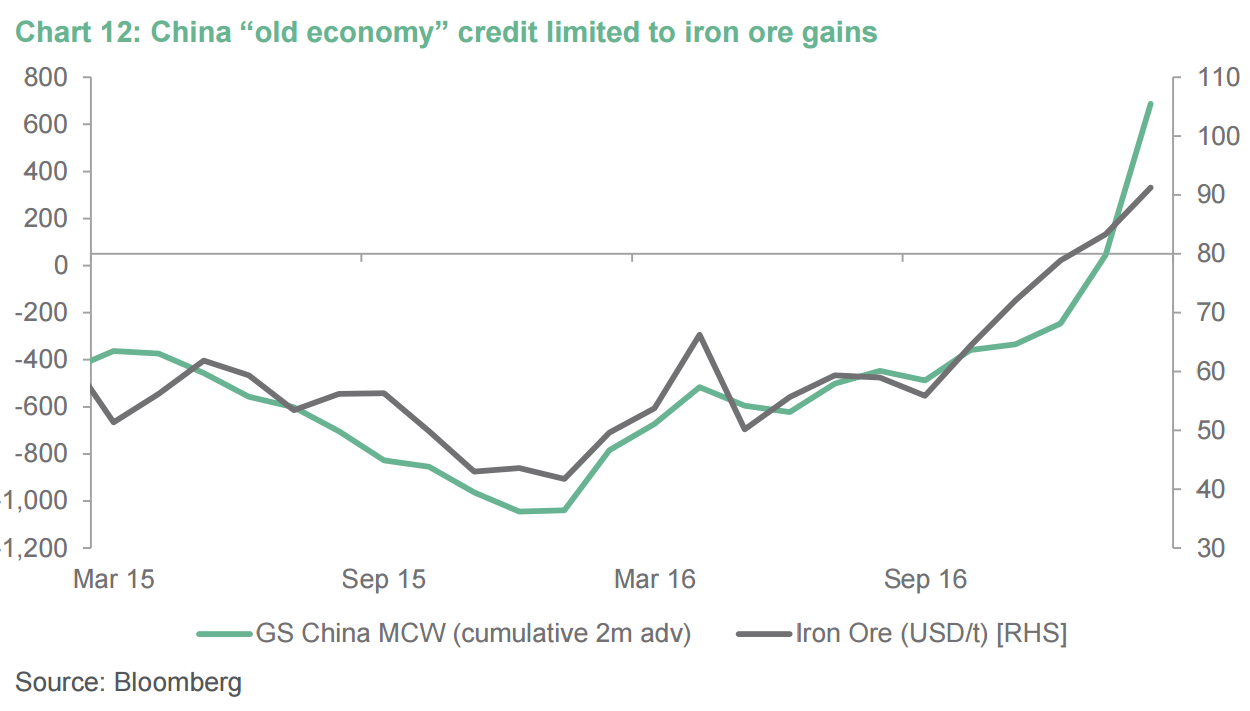
Nothing we didn’t know but take it as s stark warning. The entire iron ore cost curve is in the money, from Deutsche:
Restarts well underway north of US$60/t
At US$90/t, the spot iron ore price (62% CIF to China) is well into incentive pricing territory. We have updated our proprietary global iron ore cost and margin curves with 2H16 actual cost data for the global listed iron ore players. At spot prices for fines, lump, pellets, product discounts (58% material) and spot cost inputs (oil/diesel, FX; AUD, BRL etc, freight), the curve shows that only a handful of smaller mines are losing cash (see Figure 1). Our last run of the global curves in mid 2016, where we stated the “40/60 rule: 40 to shut, 60 to start”, showed that only 5% of global production was cash flow negative at US$60/t. With the bounce in FX and oil in 2H16, we now estimate that 14% of supply loses cash at US$60/t. Nevertheless, swing supply is returning at US$90/t, with Chinese domestic production now operating at a 280mtpa runrate, up from an average of 220Mtpa in 1H16, and “non-traditional suppliers” shipping at a rate of 195Mtpa to China, a recovery from 170Mtpa. In addition, although Chinese steel demand is robust, we think more low cost supply from the majors and juniors in 2017 will result in a retracement in the iron ore price to US$60-70/t by mid-year.
Capitalism does not allow areas of excess profitability to persist.
David Llewellyn-Smith is Chief Strategist at the MB Fund and MB Super. David is the founding publisher and editor of MacroBusiness and was the founding publisher and global economy editor of The Diplomat, the Asia Pacific's leading geo-politics and economics portal.
He is also a former gold trader and economic commentator at The Sydney Morning Herald, The Age, the ABC and Business Spectator. He is the co-author of The Great Crash of 2008 with Ross Garnaut and was the editor of the second Garnaut Climate Change Review.