Shanghai? Shenzhen? Sydney! Property in Sydney is now the second most expensive in the western world based on house price to income ratios. Melbourne is the sixth most expensive. Since 2009 house prices in Australia’s two largest urban centres have risen by 106% and 89%, respectively. In today’s report, we continue our analysis of an important driver of higher Aussie house prices – the Chinese buyer. New data we have gathered from state governments reveal the size, source and recent changes in foreign demand for Australian housing. We find that foreign buyers are currently purchasing NSW and Victorian housing at an annualised rate of A$8bn. This is equivalent to 25% of new supply in NSW and 16% in Victoria. China dominates the list of foreign buyers and currently accounts for almost 80% of all international demand. There has been a noticeable pick-up in foreign capital entering Sydney and Melbourne in late 2016. Despite the numerous impediments, Chinese buyers continue to finance their Aussie purchases. Australian housing is at peak cycle and we believe the pace and severity of the coming downturn will be cushioned by Chinese demand. There remains obvious reasons why the Chinese will continue to be big buyers of Aussie property. Importantly, many housingexposed stocks are now priced for a sharper slowdown which we think is too cautious. We add Adelaide Brighton to our Long Portfolio and remove Caltex.
Castles in the sky
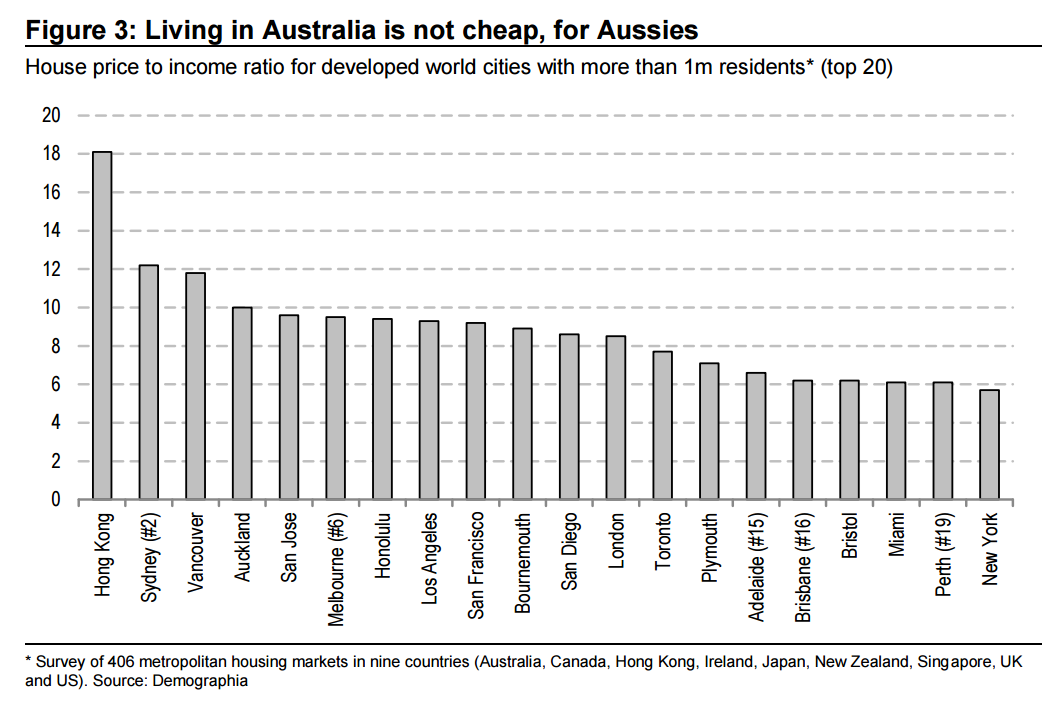
Sydney and Melbourne house prices have risen by 106% and 89% since 2009, respectively. House price-to-average incomes are now at 12.2x for Sydney and 9.5x for Melbourne. On this measure, our two largest urban centres are the second and sixth most expensive large cities in the western world, according to Demographia. It is clear housing demand is outstripping supply in Australia and we believe a major component of this strong demand comes from abroad – China.
Since our initial reports estimating the amount of Chinese buying of Aussie housing (here and here) there have been a number of important policy changes regarding this part of our property market. We think the most significant of these changes has been the introduction of taxes on foreign purchases.
Raising taxes
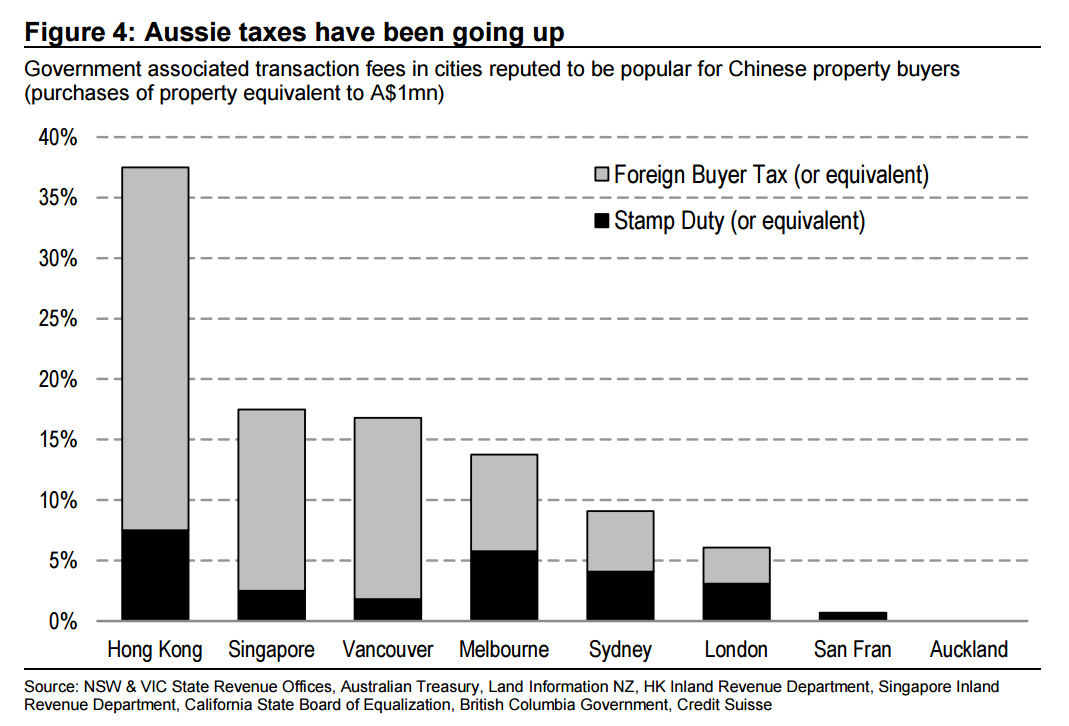
Like a number of other countries, Australian authorities have introduced taxes on foreign purchases of local property. In 2015 the Federal government announced a c1% fee for foreign buyers while the Victorian government introduced an additional 3% tax. These were the first Australian taxes on foreign buyers. Since then Victoria has raised its tax to 7% while NSW (4%) and Queensland (3%) have also introduced new taxes. A foreign buyer of a Melbourne property, that costs A$1mn will have to pay taxes equivalent to 13.8% of the purchase price. The cost of purchase for the same property in Sydney will be 9.1%. While Australian taxes on foreign buyers are higher than say in Auckland, they remain lower than other cities like Hong Kong and Vancouver (Figure 4).
New taxes, new data
We have been able to gather new data from the state revenue offices of NSW and Victoria that reveal the size, source and changes in foreign demand for Aussie housing. The data is new and is available because state governments now collect taxes from foreign buyers. Our analysis highlights that (1) foreigners are purchasing the equivalent of 25% of new housing supply in NSW and 16% in Victoria, (2) China currently accounts for almost 80% of all foreign demand, and (3) there has been a pick-up in both Sydney and Melbourne settlements around the end the year, despite the numerous impediments for foreign buyers. We discuss each of our findings below.
Foreign purchases annualising at A$8bn for NSW and Victoria
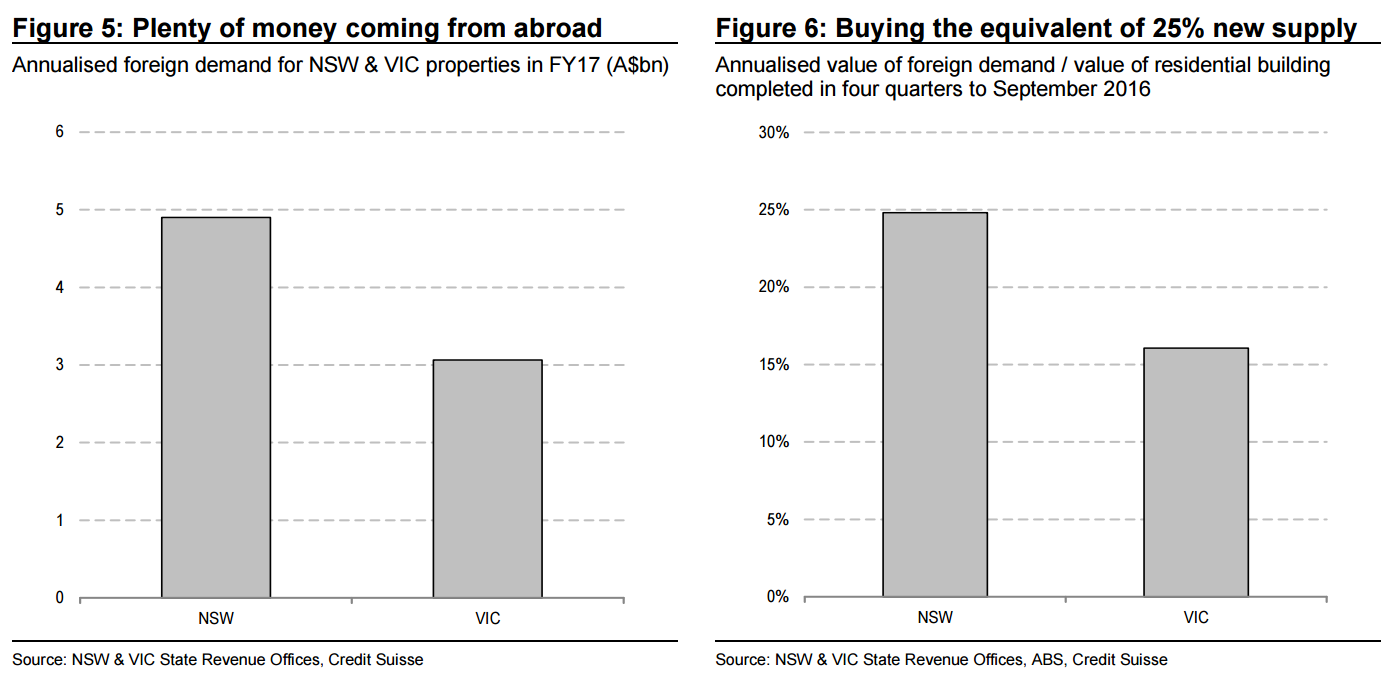
The Victorian government has collected taxes from foreign buyers since July 2015. The NSW government began collecting taxes in the middle of 2016. The taxes collected imply foreigners are currently purchasing an annualised A$4.9bn of NSW housing and A$3.1bn in Victoria. The taxes are paid and recorded when the property is settled, not when the sale takes place.
These flows imply foreigners are acquiring 25% of newly completed supply in NSW and 16% in Melbourne, or 21% if we combine the two states. The value of housing completions in both states totaled A$39bn over the most recent 12 months we have data for.
China dominates foreign demand
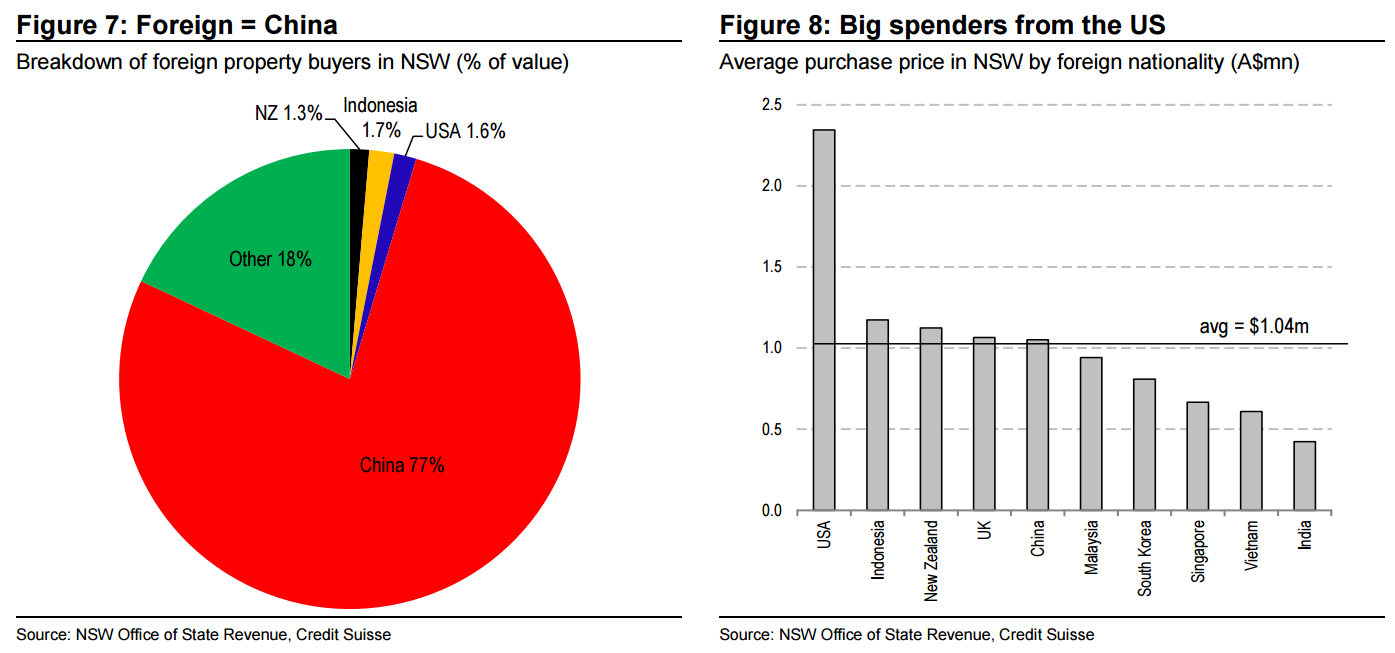
The data gathered from the state governments makes it clear that Chinese buyers dominate the value and volume of foreign purchases in Australia. In NSW there were 1,503 properties settled involving foreign buyers from October 2016 to January 2017 and they totaled A$1.63bn in value (or A$4.9bn annualised). Chinese buyers settled on 1,211 or 80% of them and accounted for 77% of the total purchase value. We define Chinese buyers as those from the Mainland, Hong Kong, Macau, and Taiwan.
The average transaction price by a foreign buyer in NSW was A$1.04mn. However, this masks a big spread by nationality. For example, the average purchase price for Indian buyers (19 transactions since July 2016) was just A$420k. Meanwhile, the average purchase price for US citizens was more than five times greater at A$2.35mn. Indonesian buyers made the second most expensive purchases, on average (Figure 8).
Chinese still able to settle despite…
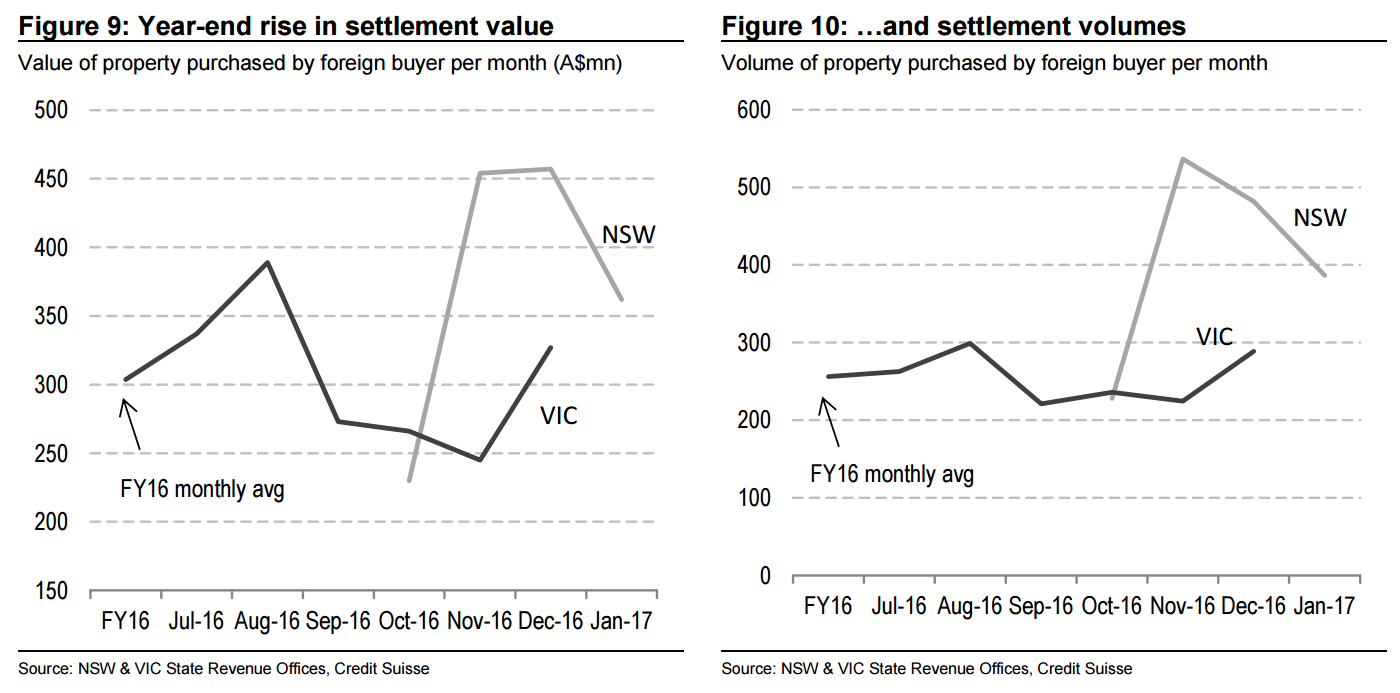
The state government data illustrates a pick-up in the value of monthly settlements towards the end of the year. In NSW there were A$225mn of foreign settlements in October 2016 and this rose to more than A$450mn in both November and December. In Victoria the value of December settlements was 50% higher than in November. So despite the capital controls put in place in China, and the local banks refusing to lend to purchasers from abroad, foreign buyers were still able to find the financing to complete their transactions.
Chinese demand to remain solid
Chinese demand for Aussie housing is strong. While there is likely to be short-term periods where these flows stall, over the longer term we believe there is good reason to expect more, not less, Chinese demand for Aussie housing.
Wealth creation in China is considerable
Of course the main reason why capital will continue to flow from China to Australia is because the middle-kingdom is huge. Not only is China an enormous economy, wealth creation is occurring at an impressive rate. The Credit Suisse Global Wealth Report estimates that there are 1.6mn USD millionaires in China at the moment. There were only half as many in 2010. Looking ahead we expect the number of USD millionaires to grow by just over 7% p.a. and will total more than 2.5mn by 2021.
Aussie housing is relatively cheap
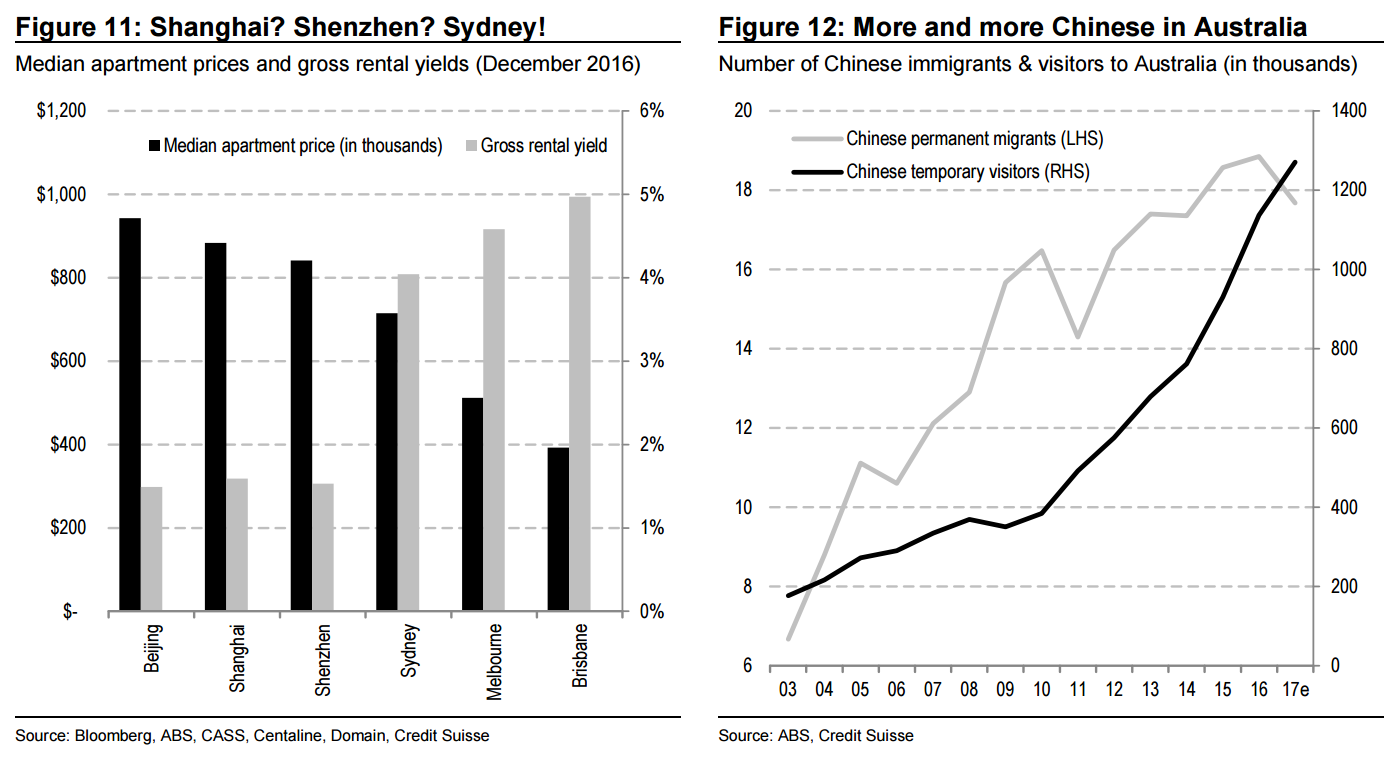
It is hard for many Australians to think of property as a cheap asset, but from a Chinese investor’s perspective, there could be plenty of value in Aussie housing. The median price for a two-bedroom apartment in Shanghai is around A$900k which is 25% more than the median apartment price in Sydney. Also, the gross rental yield in Shanghai is a paltry 1.5% and is less than half the gross rental yield for the equivalent property in Sydney. Yes, our property is expensive when we compare it to our own history, but it is cheap when compared to Chinese property.
Greater integration between Australia and China While international integration may be beginning to reverse in the US and Europe, it continues to grow in Asia. Australia has a free-trade agreement with China which has made it easier for citizens of each country to visit. There were more than 1.1mn Chinese visiting Australia in 2016 and the number has tripled from ten years ago. Meanwhile, the number of Chinese settlers has also grown (but not nearly as much as visitors). Integration between both economies continues to grow and should underline demand for assets.
Strategy outlook
We believe Aussie housing is around peak cycle and will be a headwind for our economy and corporate profits in the years to come. But the severity of the coming housing downturn is set to be less painful than many fear – dare we say “it could be different this time!” Indeed, a major reason why the coming downturn in Aussie housing will be different to those in the past is because of Chinese demand. The Chinese buyer will help cushion the coming downturn in housing and she may already be doing so in some parts of Australia. While these flows from abroad may wax and wane, new data from state governments gives us confidence that they will not stop. We forecast Chinese demand for Aussie housing will continue to grow over the longer term. We add Adelaide Brighton to our Long Portfolio and remove Caltex.
Appendix: Data and assumptions
To estimate Chinese demand for residential property in NSW and Victoria, we employ data from the NSW and Victorian State Revenue Offices. The revenue offices collect data on taxes paid when property is settled by foreign buyers. A foreign buyer is classified as an individual who is not an Australian permanent resident, Australian citizen or New Zealand citizen holding Subclass 444 visa. For NSW, we obtained the monthly breakdown of the number, value and nationality of foreign buyer duty payments from July 2016 to January 2017. For Victoria, we obtained the FY16 full year value of foreign buyer duty payments and monthly observations from July 2016 to December 2016.
We apply the 4% tax rate to derive how much foreigners spent on NSW residential property. Likewise, we apply the 3% foreign buyer tax rate to calculate the value of Victorian residential property purchased by foreigners in FY16, and begin to apply the 7% tax rate to estimate the value of foreign purchases in FY17. We then annualise the FY17 foreign property demand in NSW with four months of data from October 2016 to January 2017. These four months seem to have the most complete data. Similarly we use six months of data, from July to December 2016, to annualise the foreign property demand in Victoria.
We compare the median apartment prices and gross rental yields for apartments in Sydney, Melbourne and Brisbane to those in Beijing, Shanghai and Shenzhen (Chinese Tier 1 cities). For Australian capital cities, the Australian Bureau of Statistics provides quarterly data on median apartment prices. We collect the data on gross rental yields for apartments from the Domain Rental & House Price Report (December Quarter 2016). For Chinese Tier 1 cities, we obtained the December 2016 median sales price per sqm from Chinese Academy of Social Sciences, a research institution affiliated with China’s State Council. We assume that a median apartment size in China Tier 1 cities is 90 sqm. We obtained the gross rental yields for Chinese apartments from Centaline, a leading property research group in China. For currency conversion, we assume AUDCNY is 5.2.
A couple of points:
CS ignores skyrocketing political risk. This trade is going to get shut down at dome point or there will be a revolution, and
I have witnessed first hand what happens to Chinese buyers when the cycle turns. They bolt much faster than the locals. While Chinese buyers may cushion a local downturn a little, they will exacerbate a bust if it really gets moving, or a downturn hits China.
David Llewellyn-Smith is Chief Strategist at the MB Fund and MB Super. David is the founding publisher and editor of MacroBusiness and was the founding publisher and global economy editor of The Diplomat, the Asia Pacific’s leading geo-politics and economics portal.
He is also a former gold trader and economic commentator at The Sydney Morning Herald, The Age, the ABC and Business Spectator. He is the co-author of The Great Crash of 2008 with Ross Garnaut and was the editor of the second Garnaut Climate Change Review.