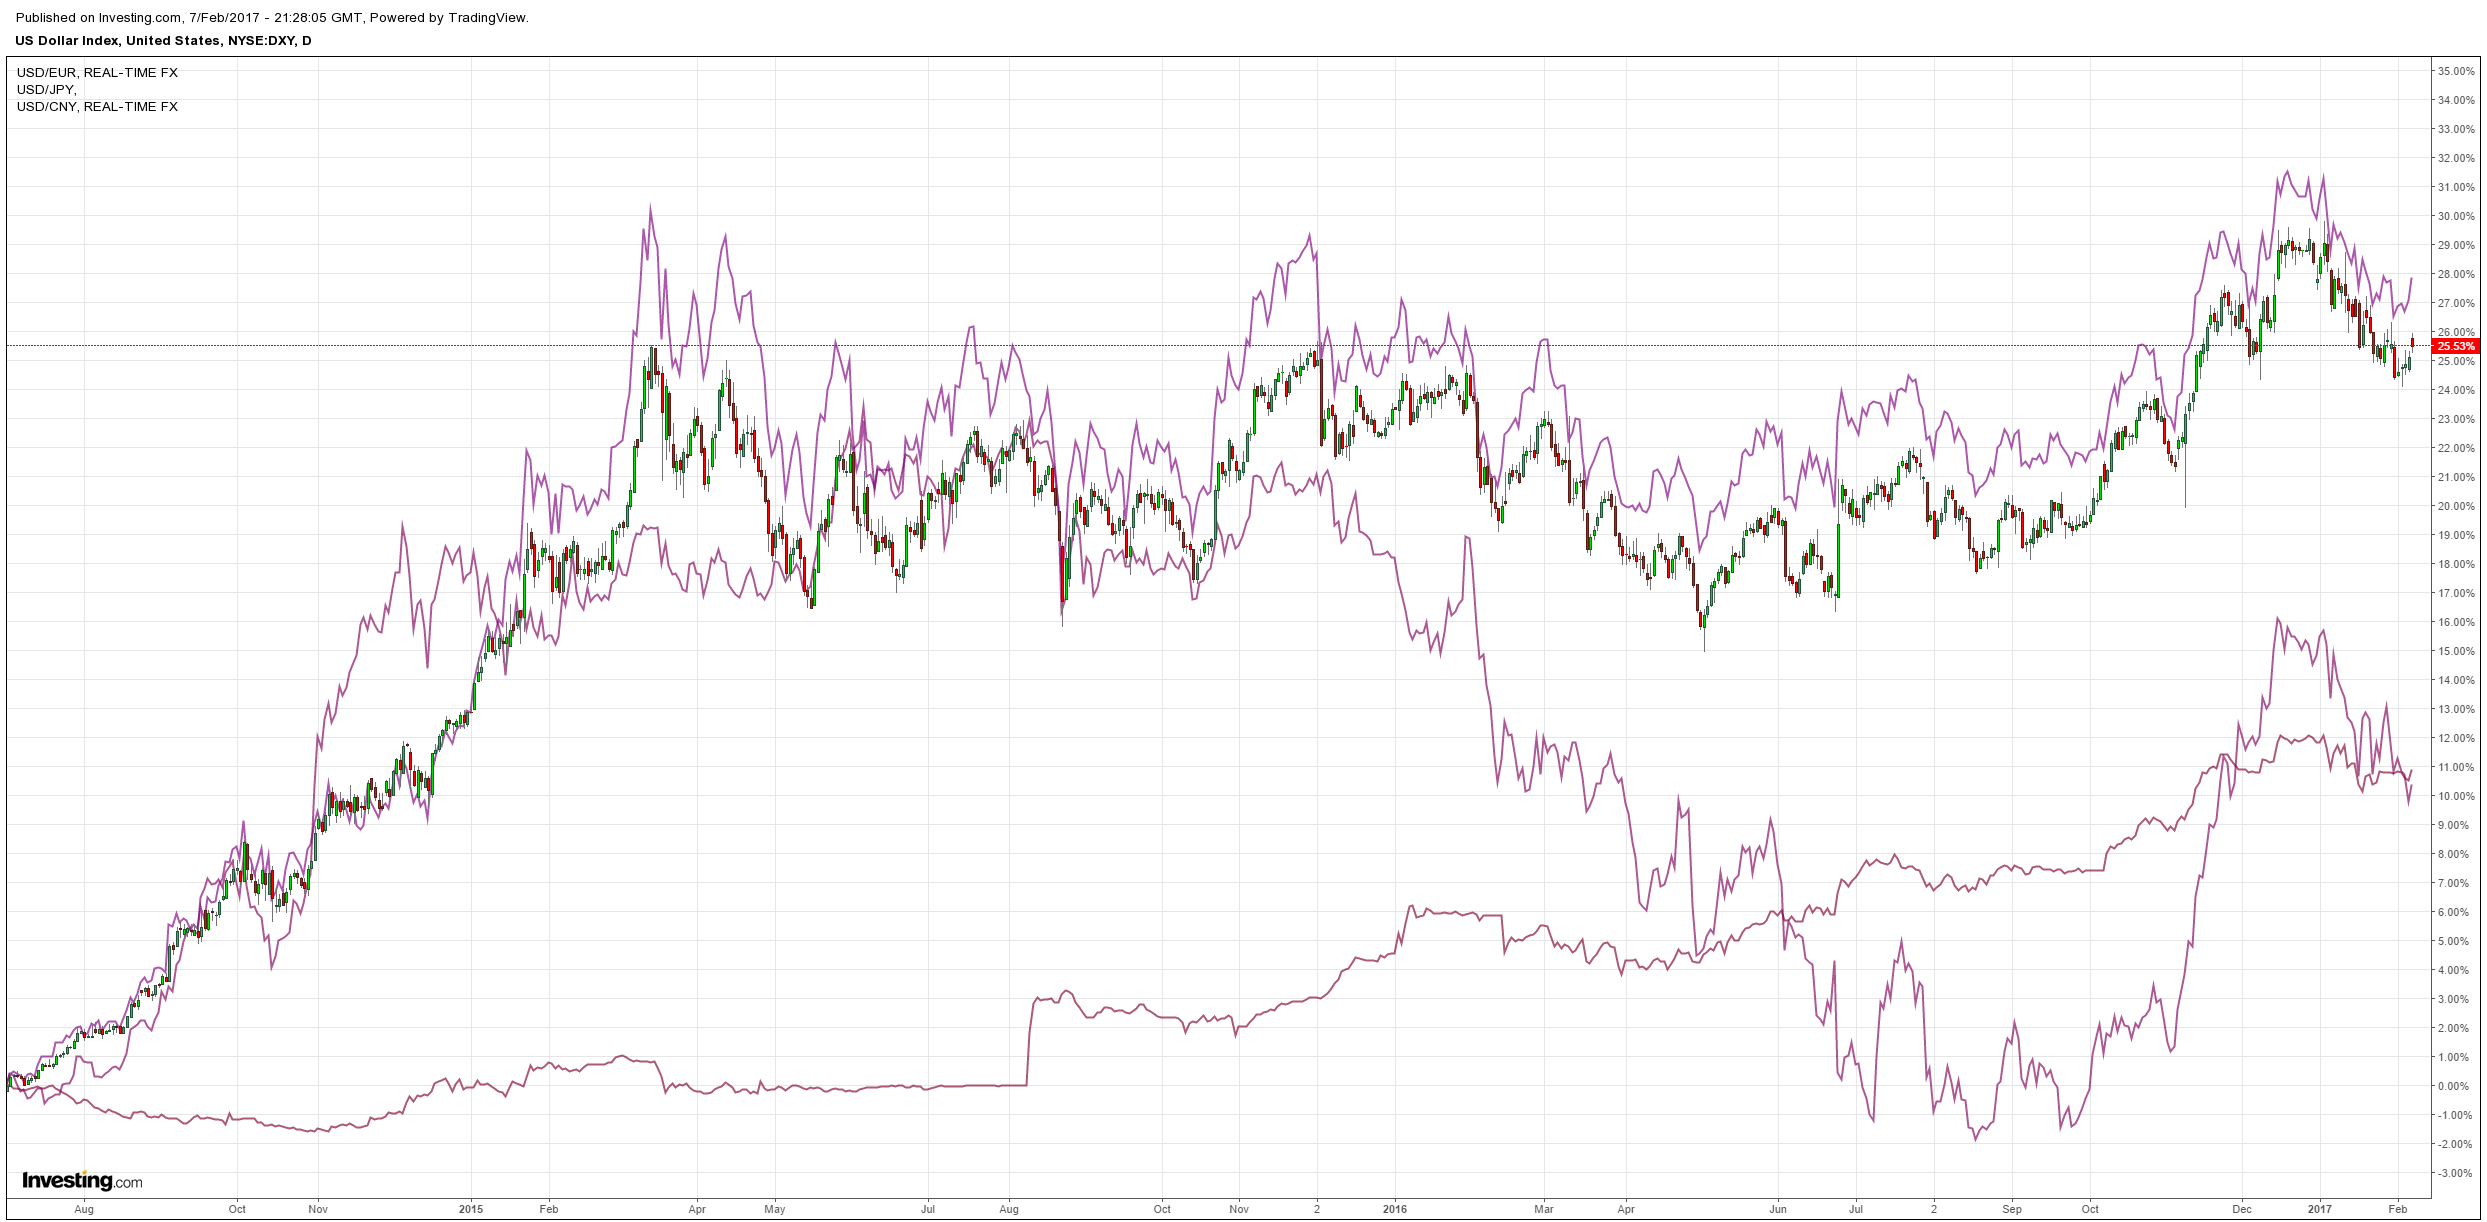
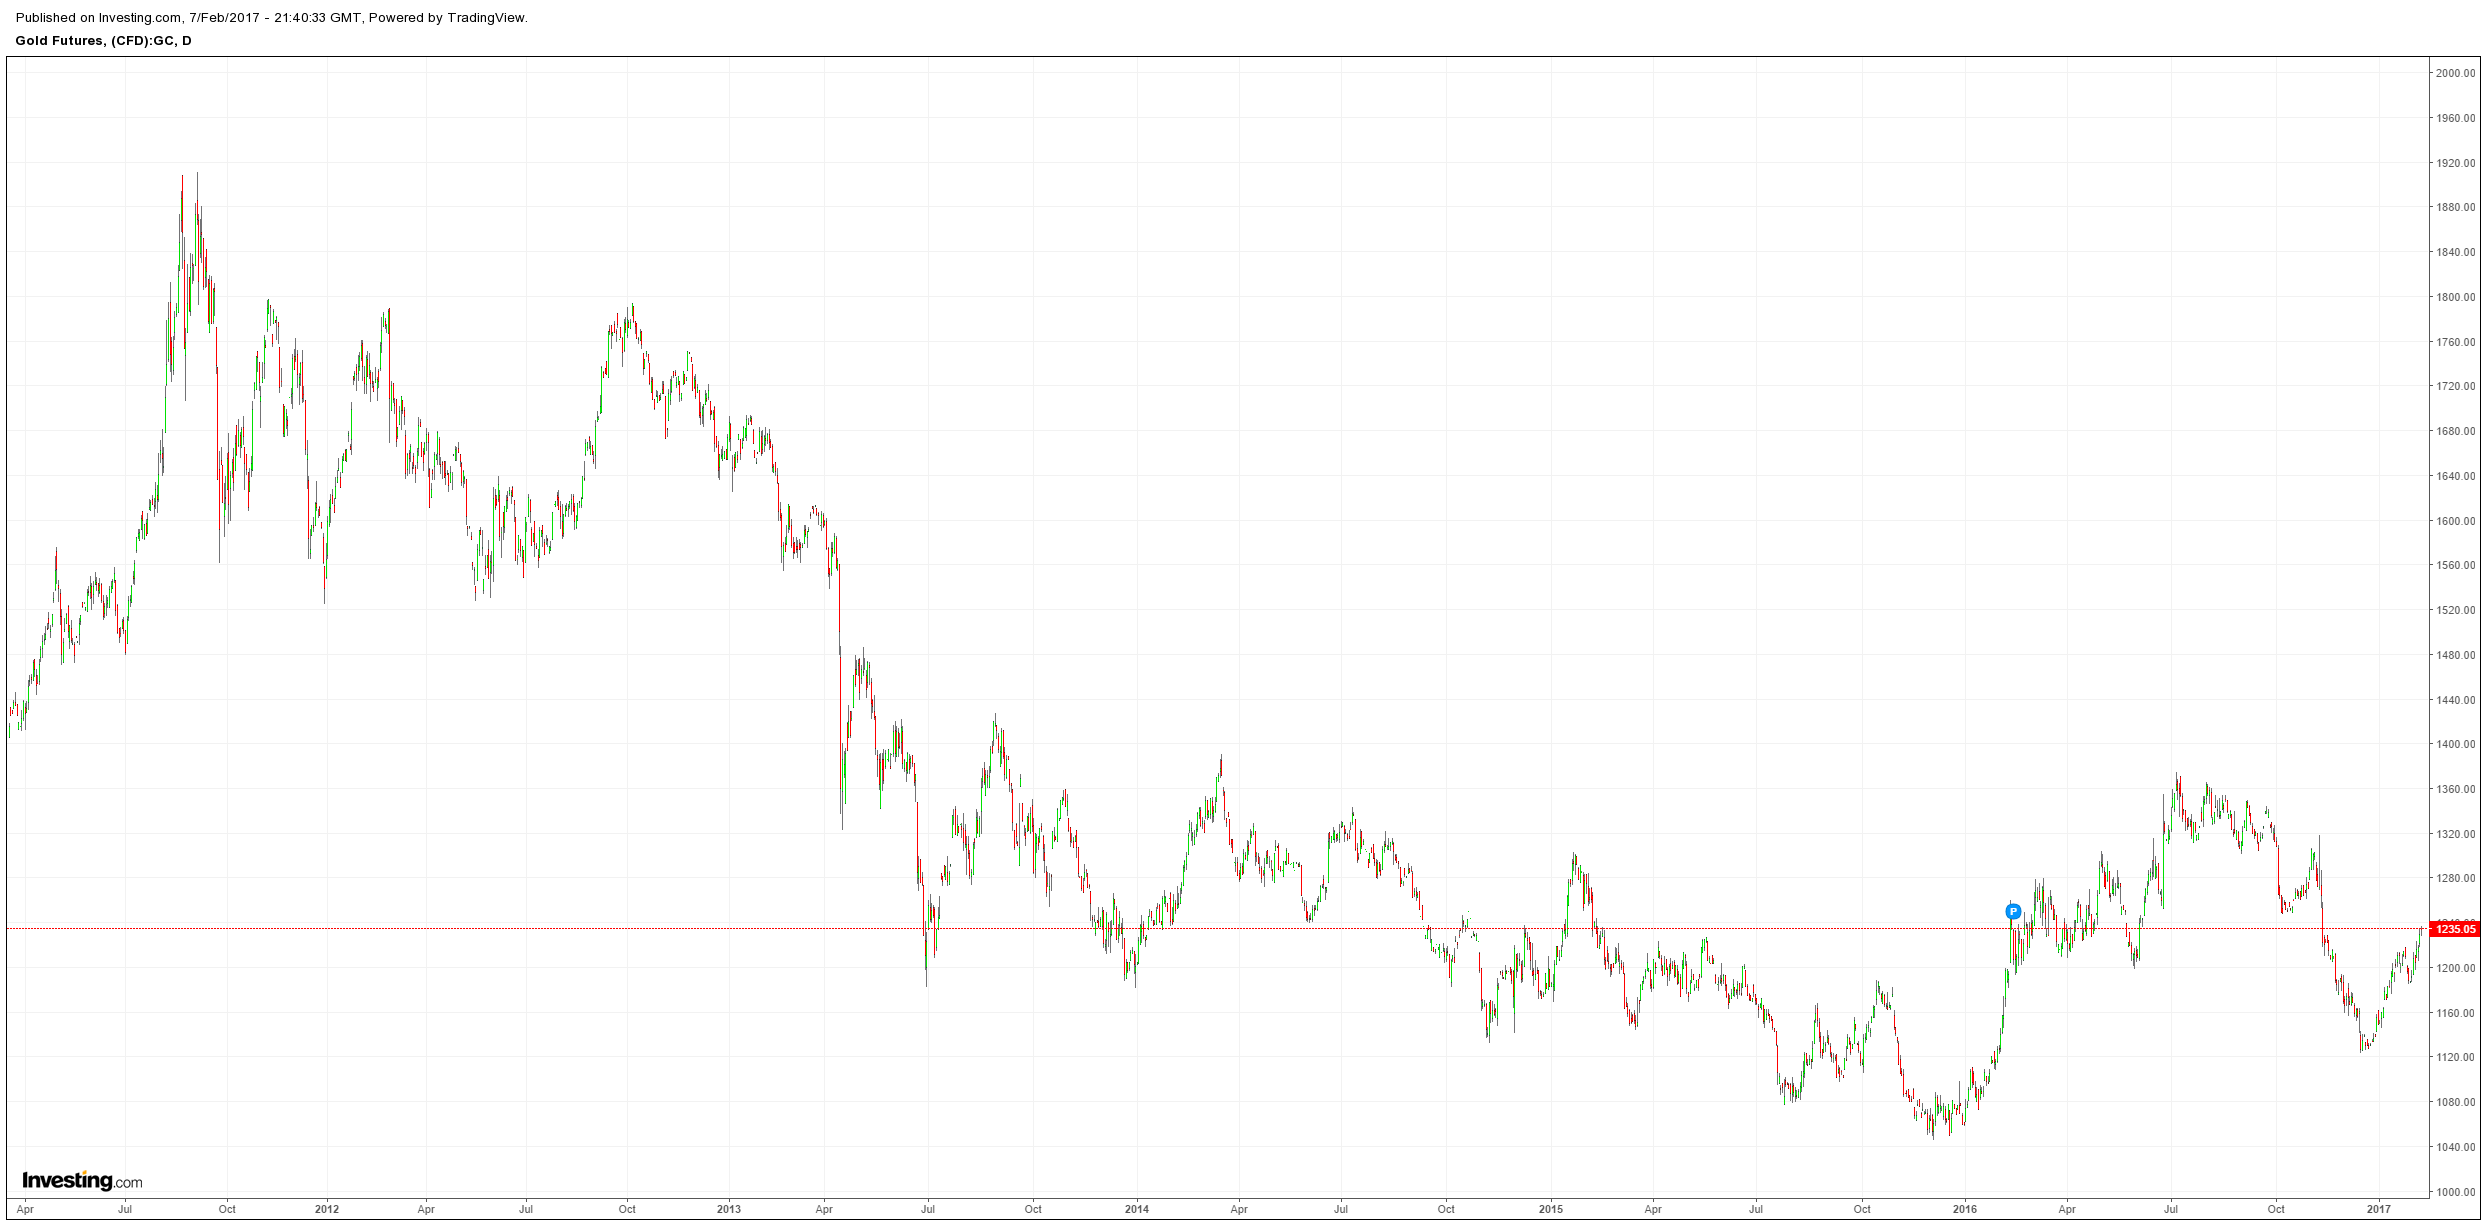
Gold rallied anyway but it’ll get harder if DXY resumes its climb:
Advertisement
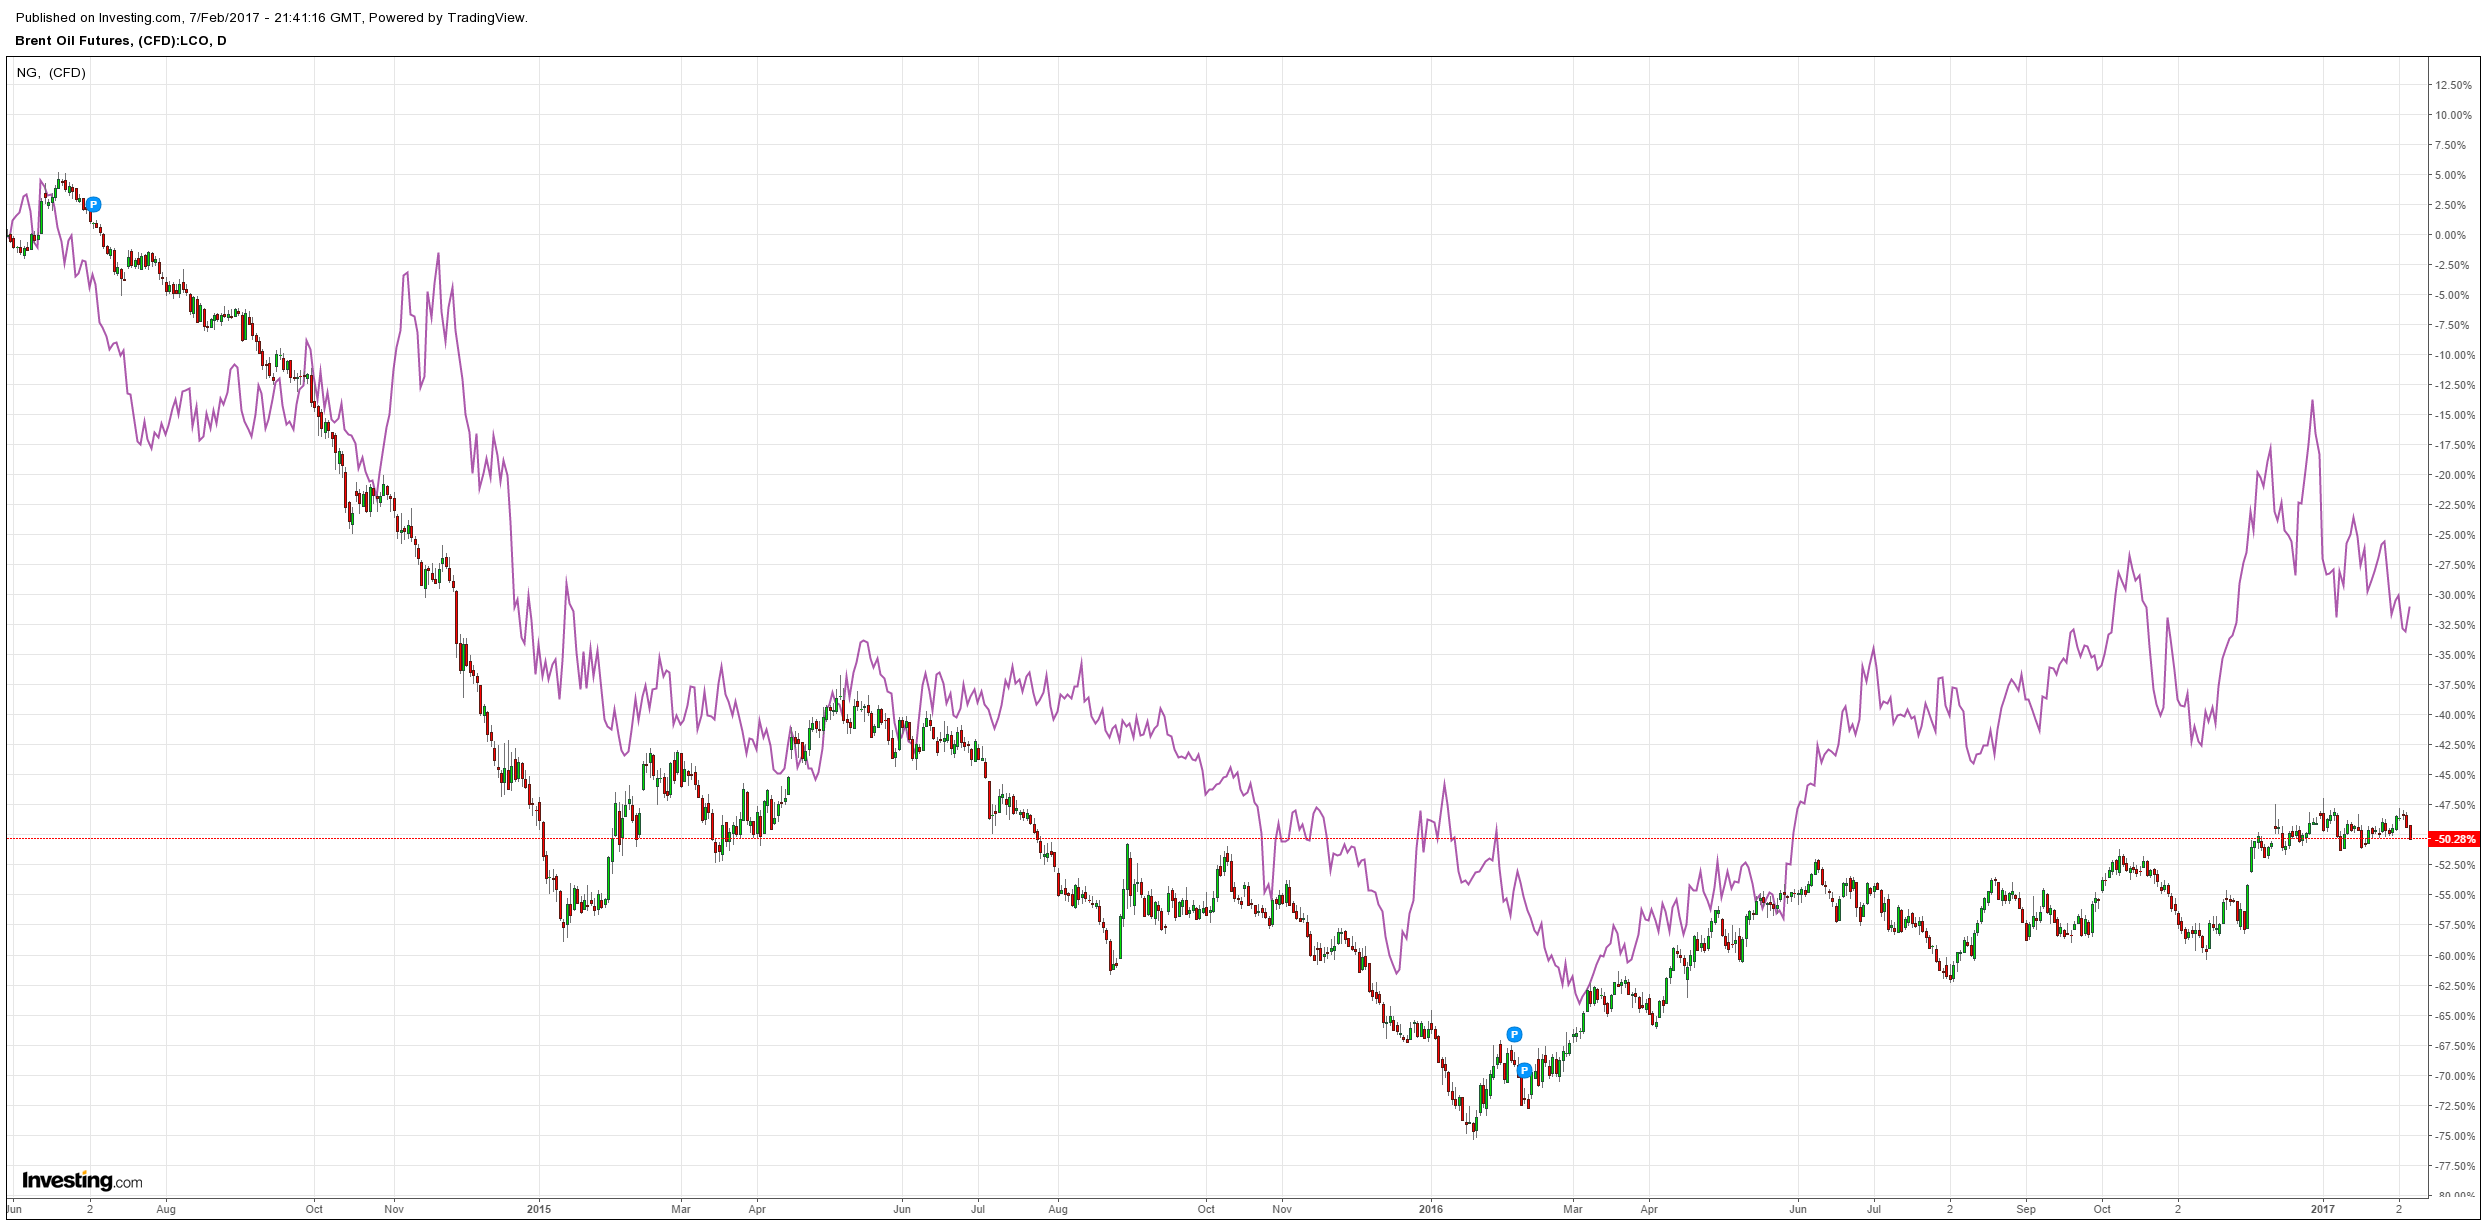
Brent sagged:
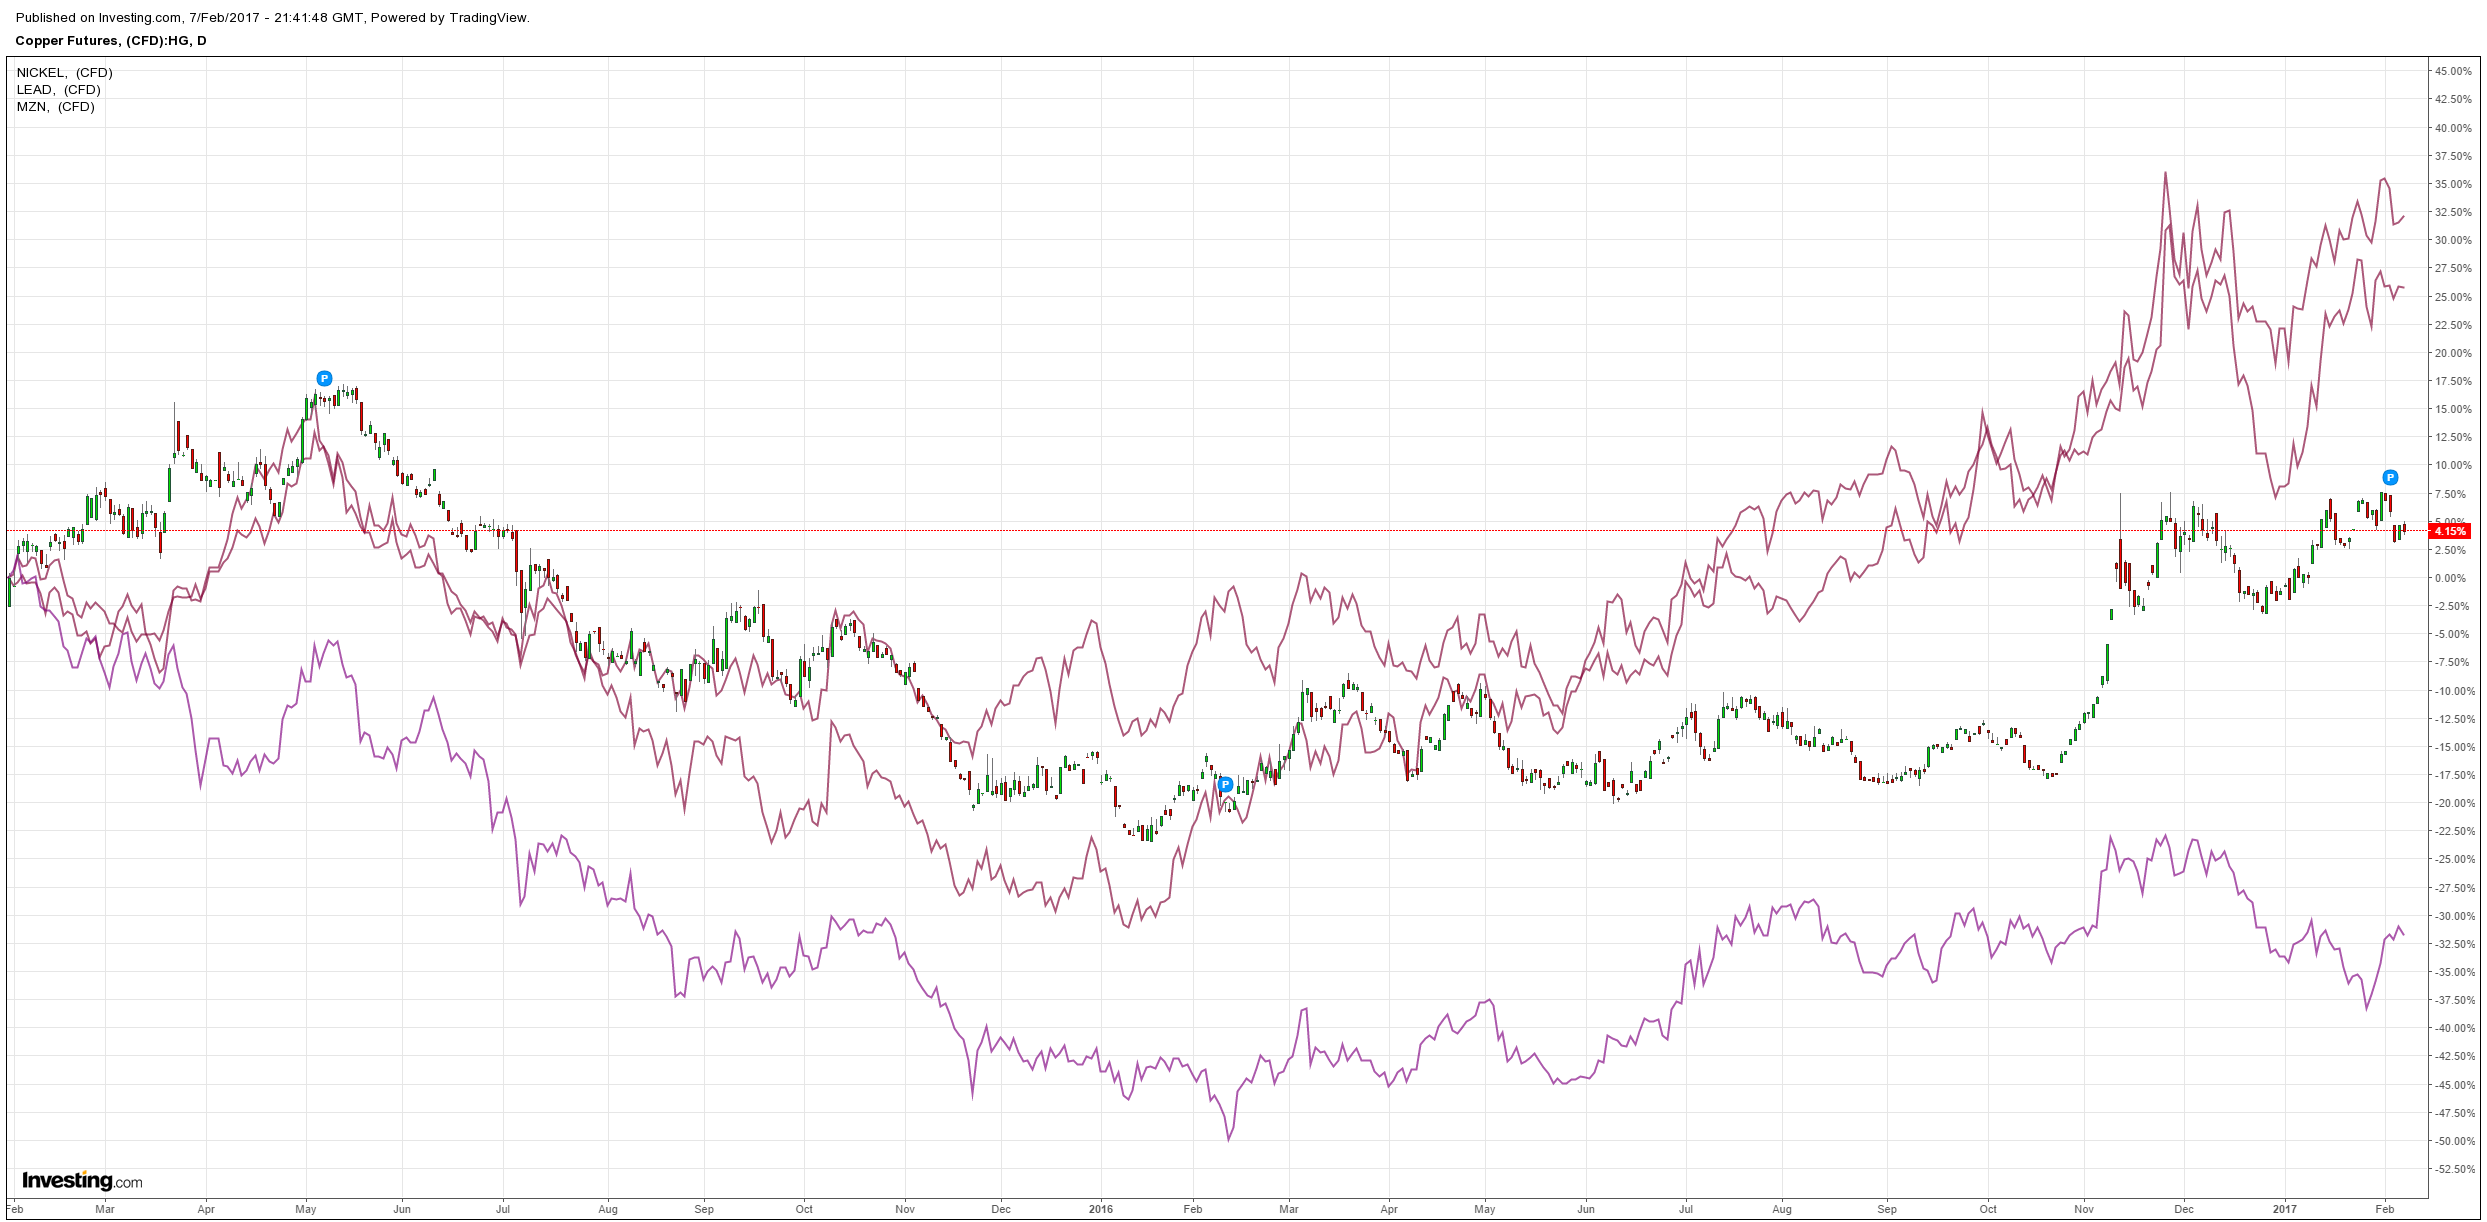
Base metals held up:
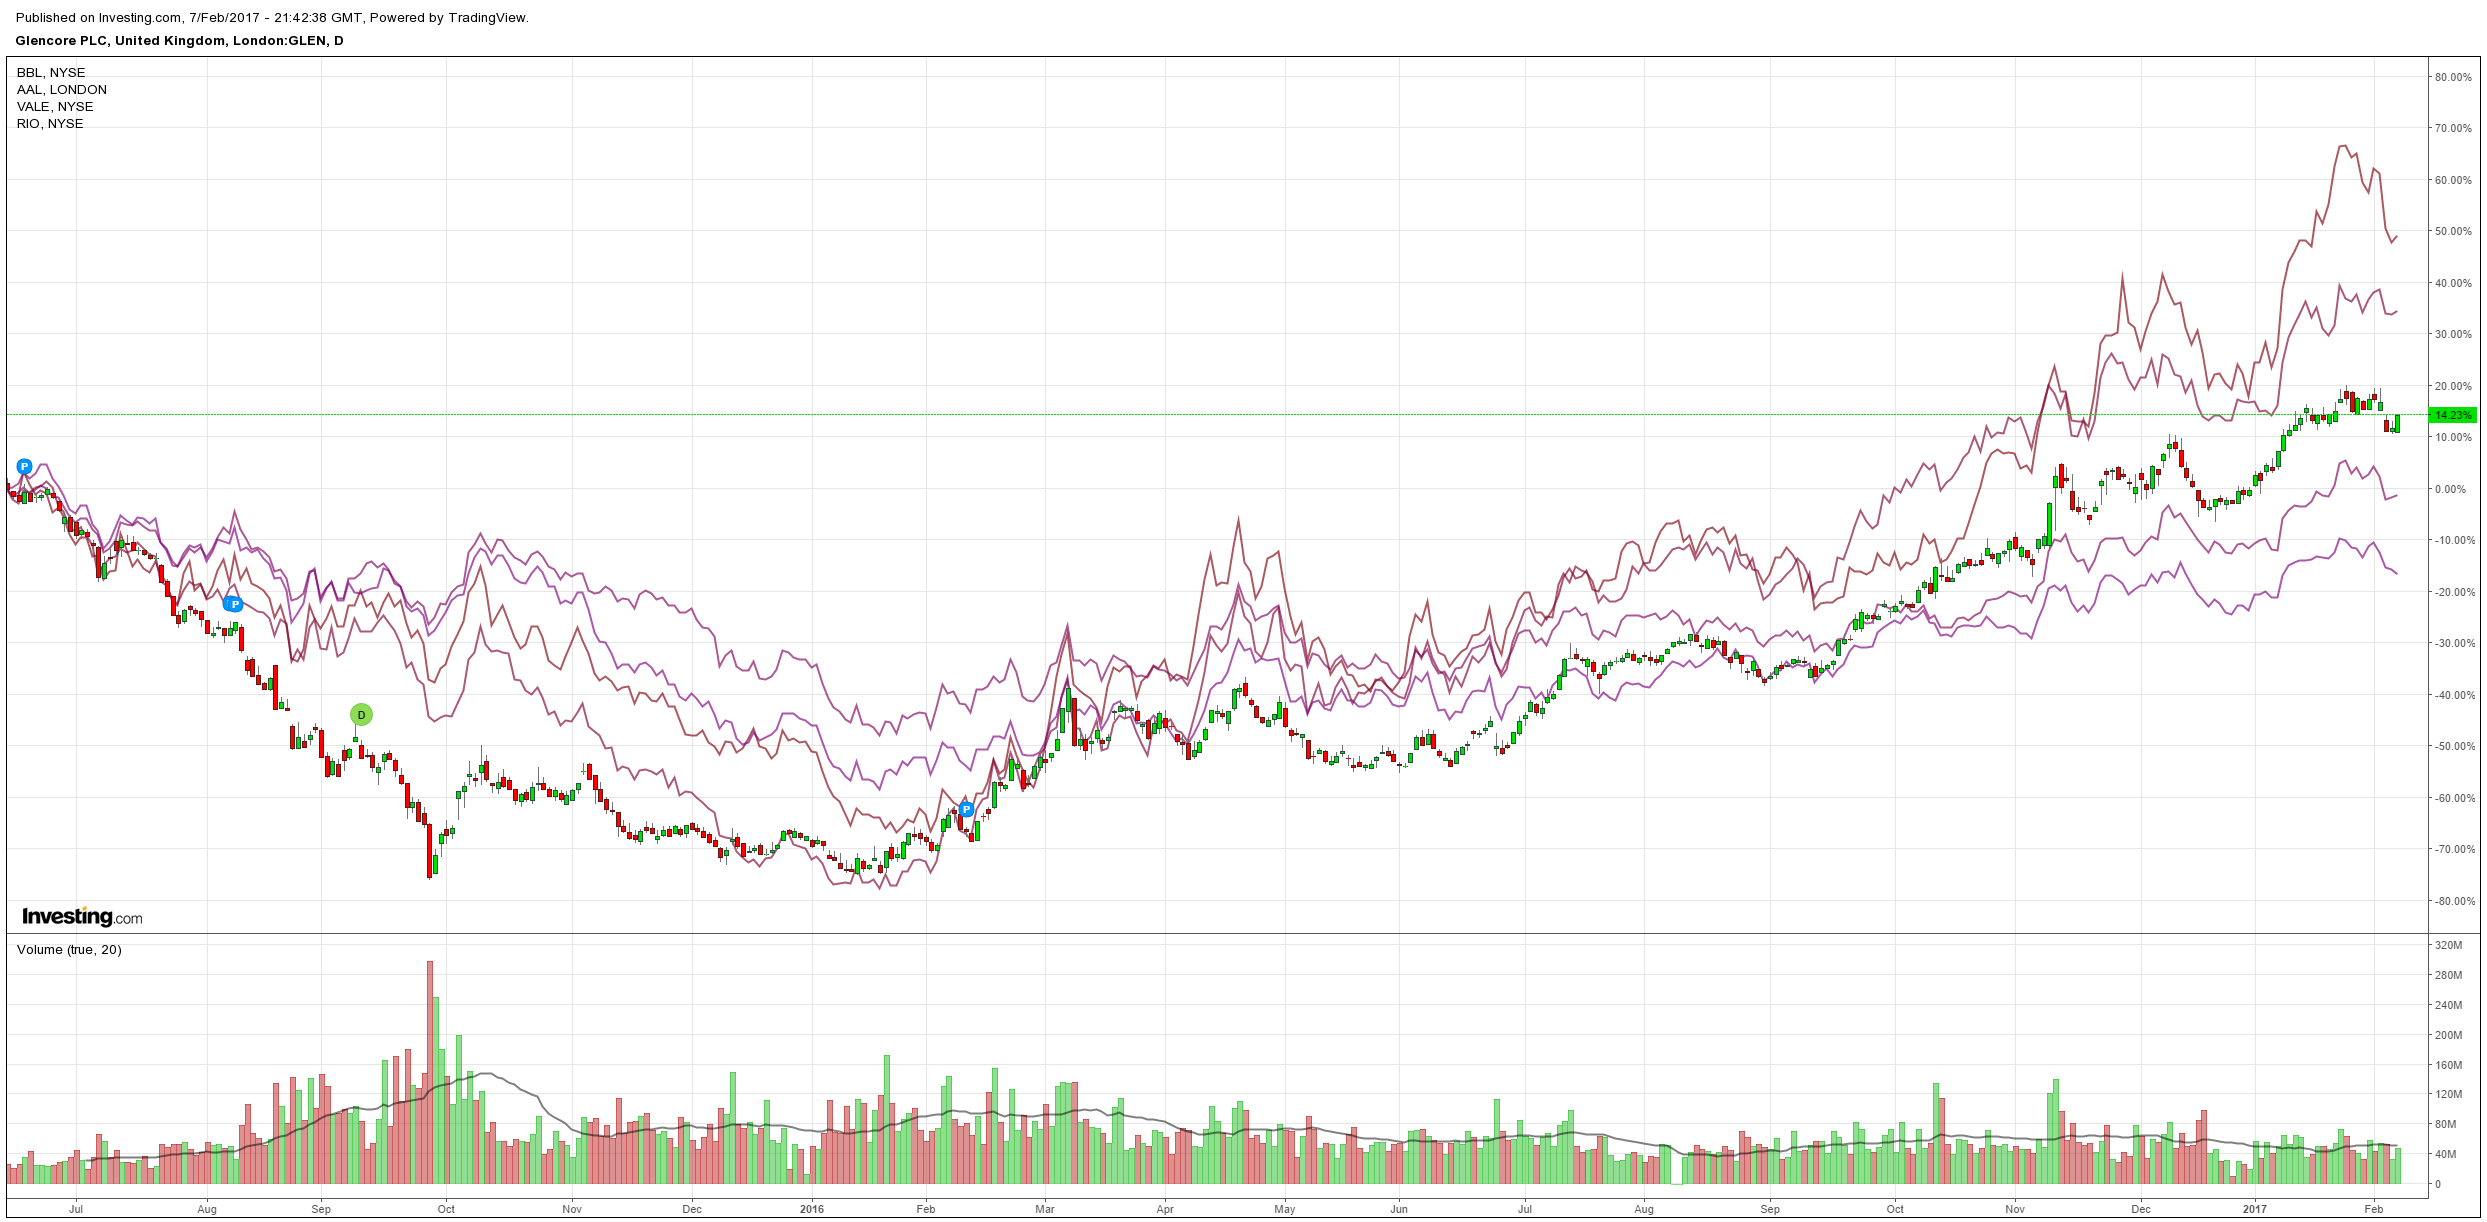
Big miners rebounded:
Advertisement
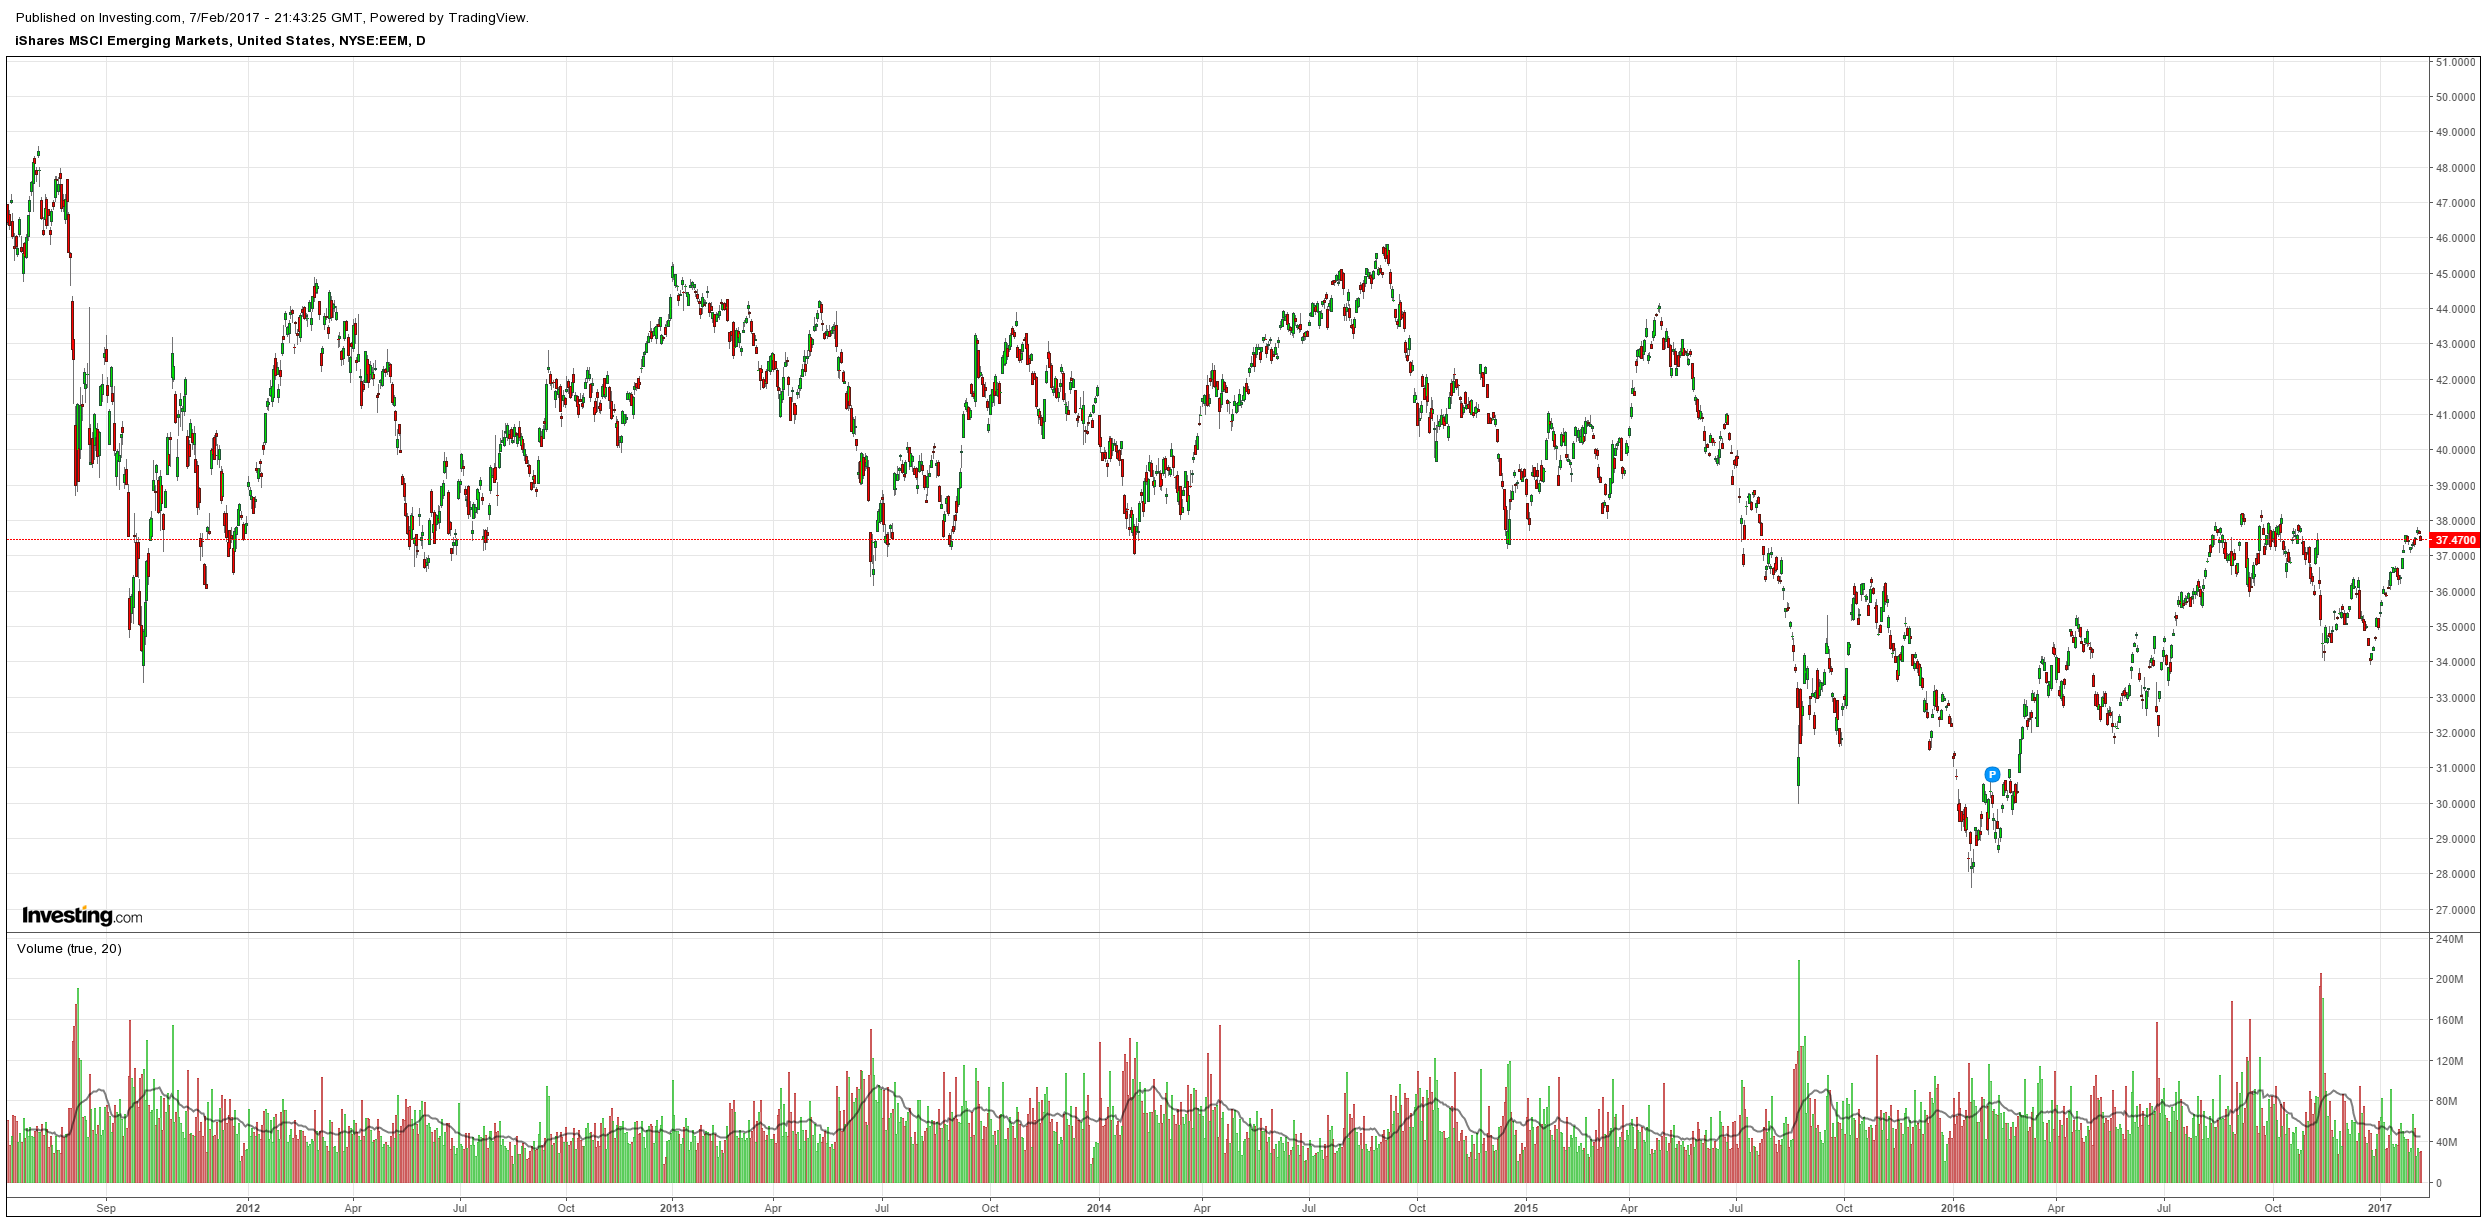
EM stocks were hit:
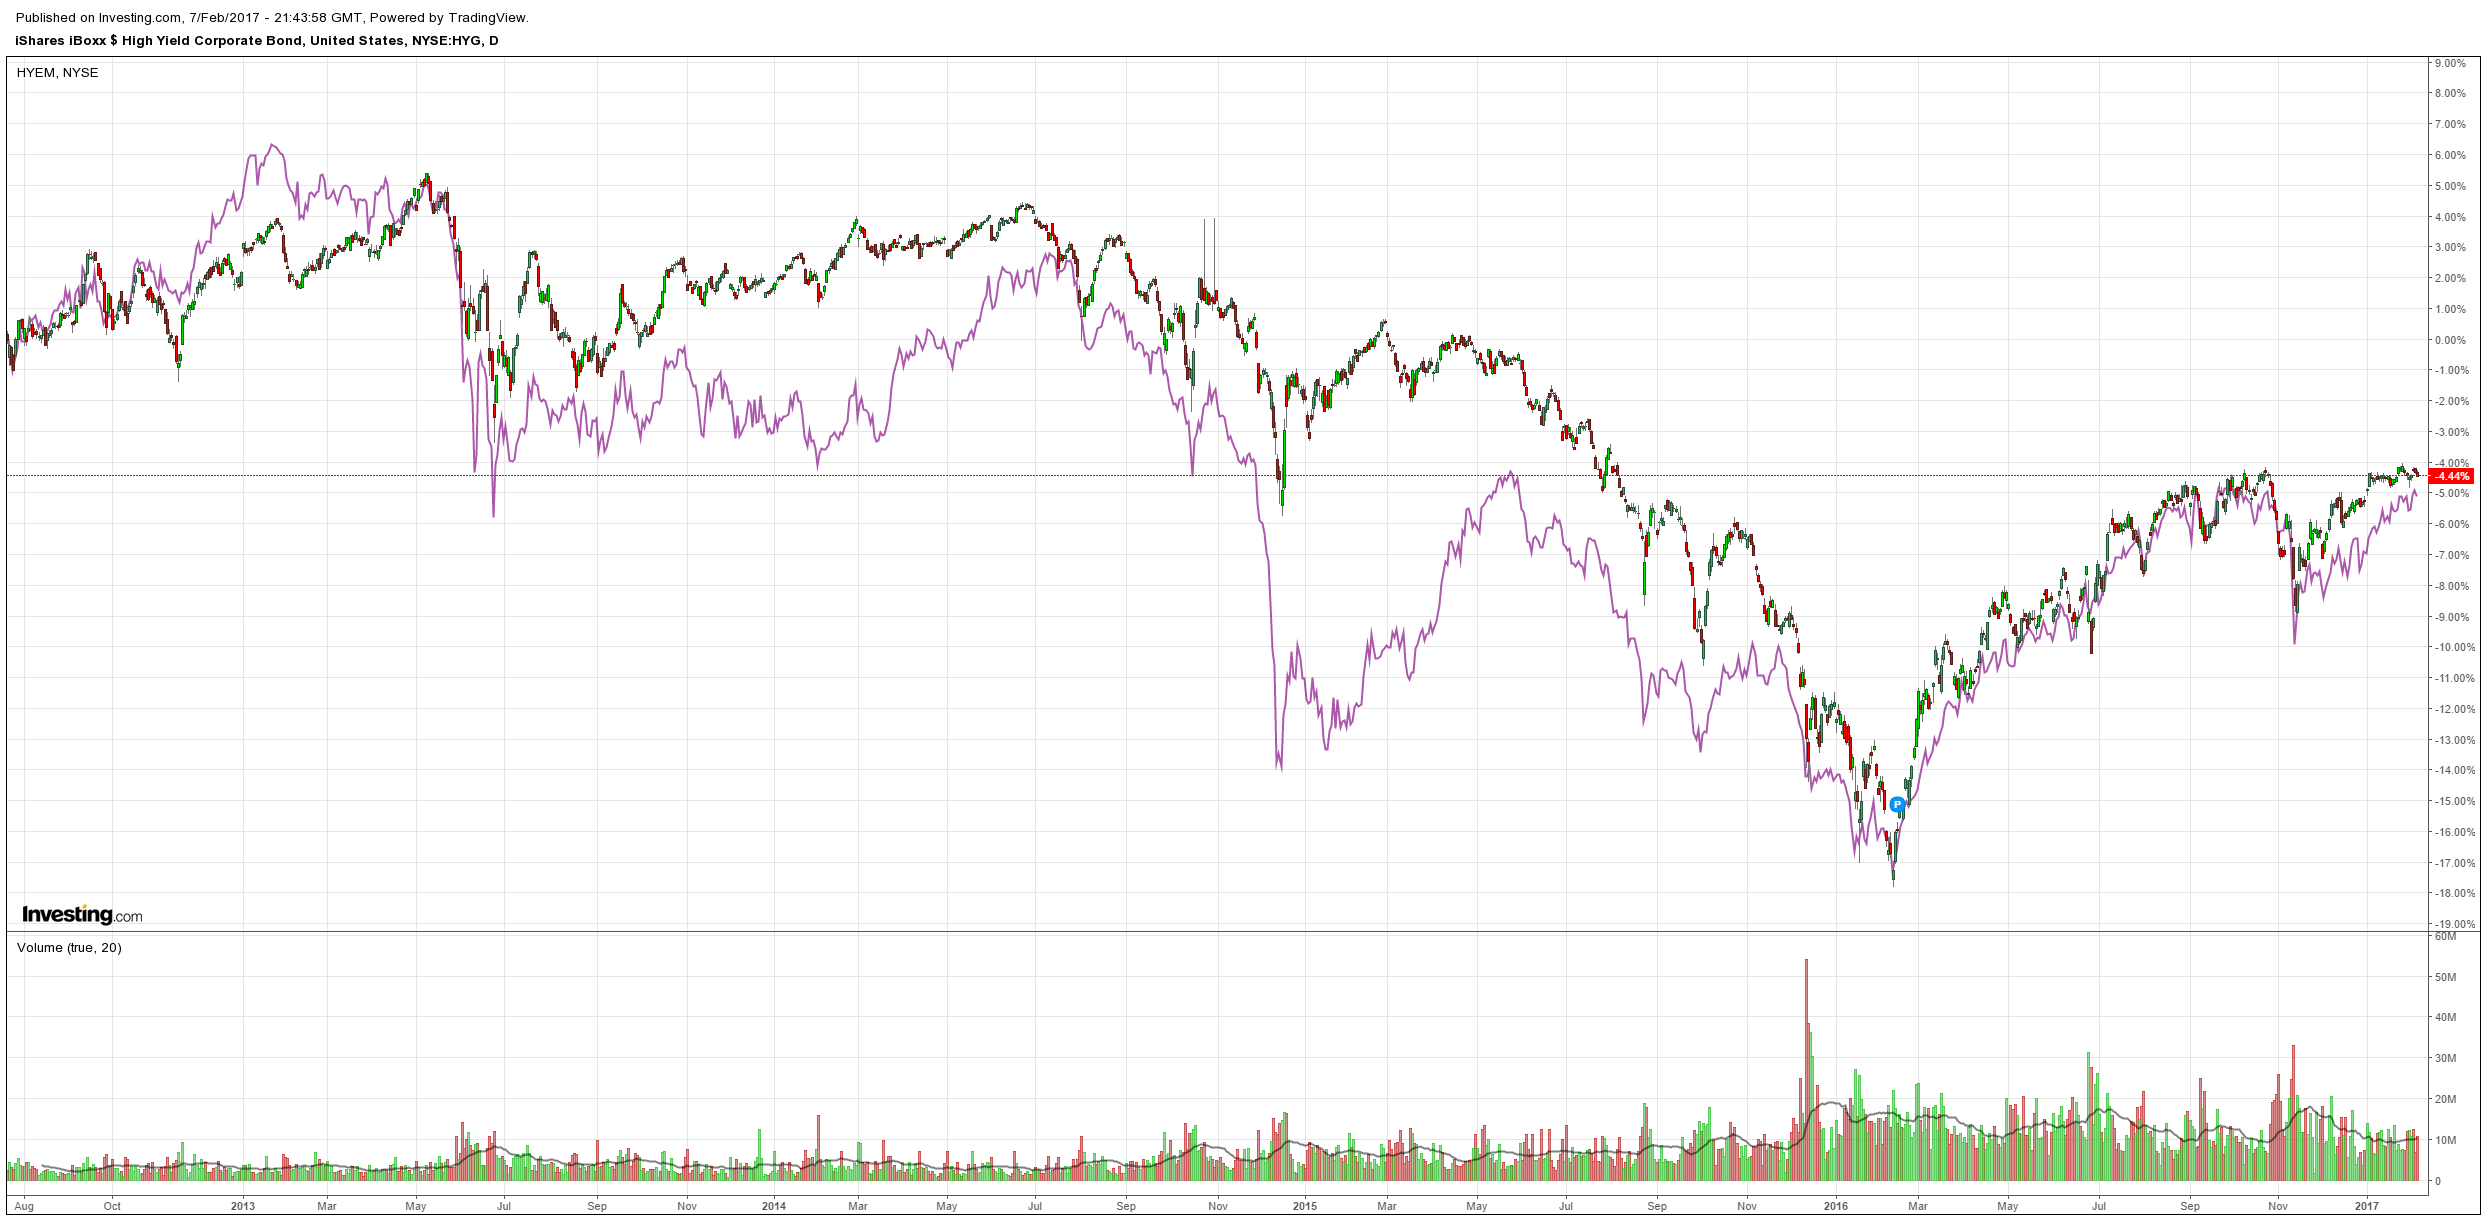
High yield too:
European spreads crashed back to earth:
Advertisement
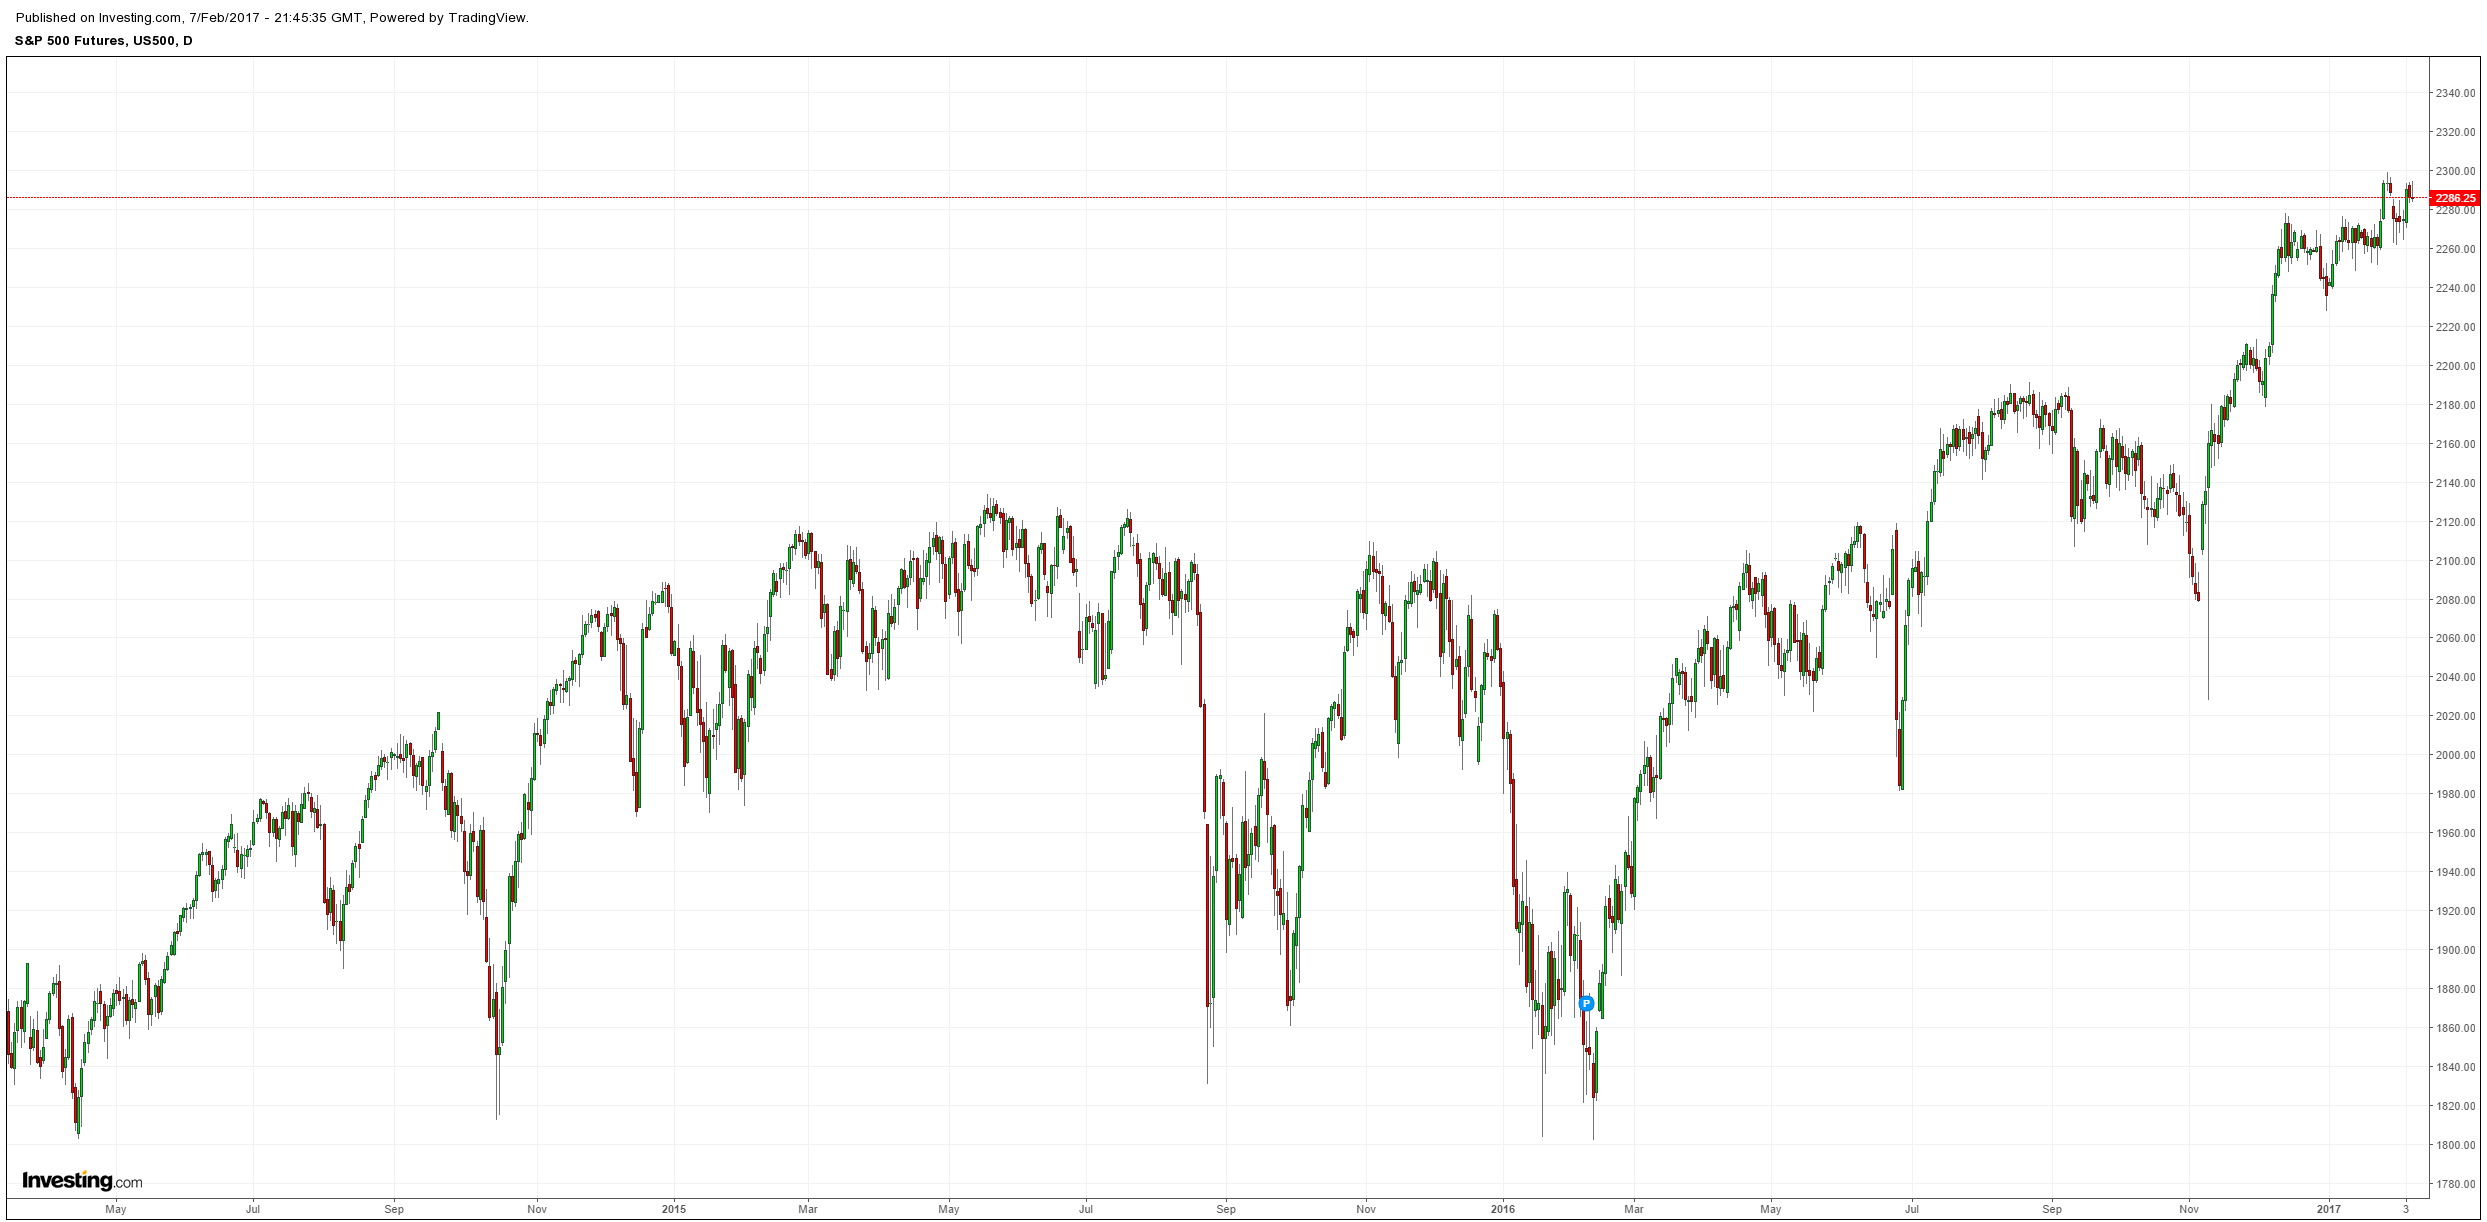
And stocks were roughly stable:
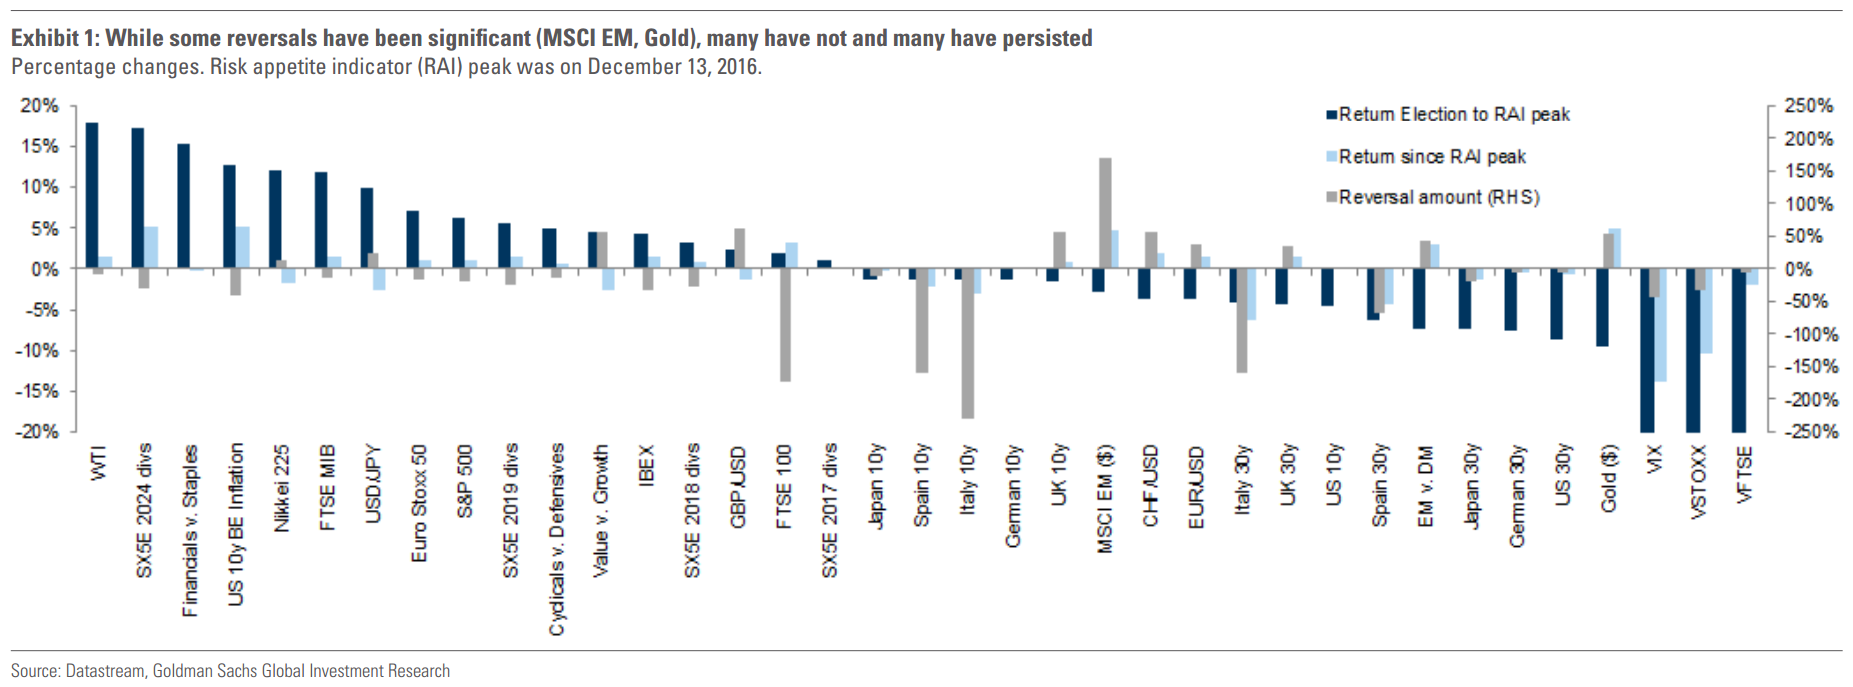
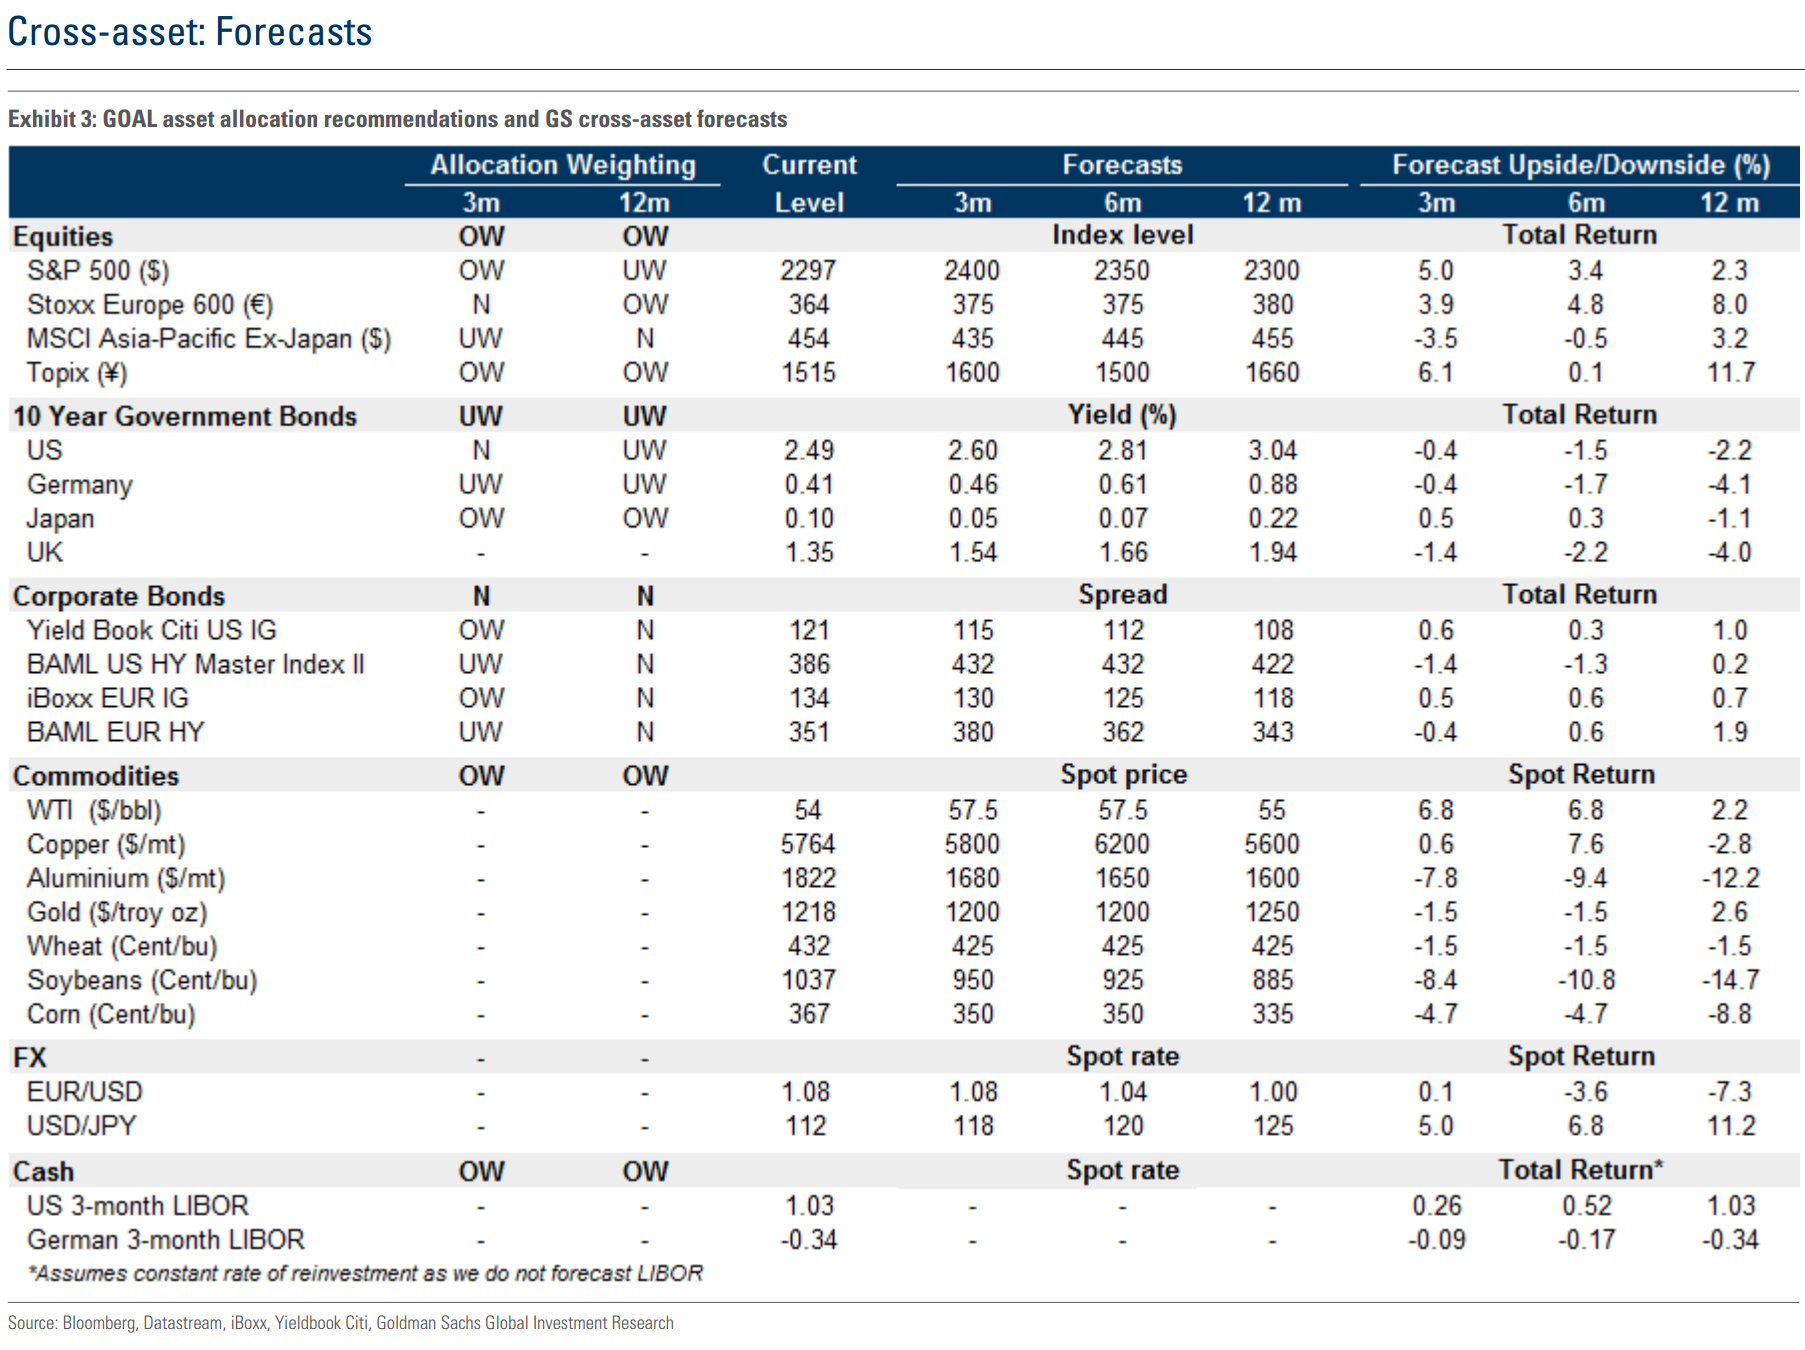
Revenge of the Trump trades then. Where now? From Goldman:
The election of Donald Trump as US President in November 2016, initially were associated with a number of so-called ‘Trump trades’ doing well. For example, short EM, long USD, short duration, long inflation, long financials v. staples, long value v. growth and long cyclicals v. defensives all did will immediately following the election. This was associated with one of the highest levels of risk appetite since 1990 being reached in mid-December, as measured by our GS risk appetite indicator. However, in recent weeks some of these trades have reversed, raising the question of “where to from here?” by some investors we have spoken to. Below we analyse potential answers to this question and document cross-asset performance since the election of President Trump until the peak of risk appetite in mid-December, and performance since then.
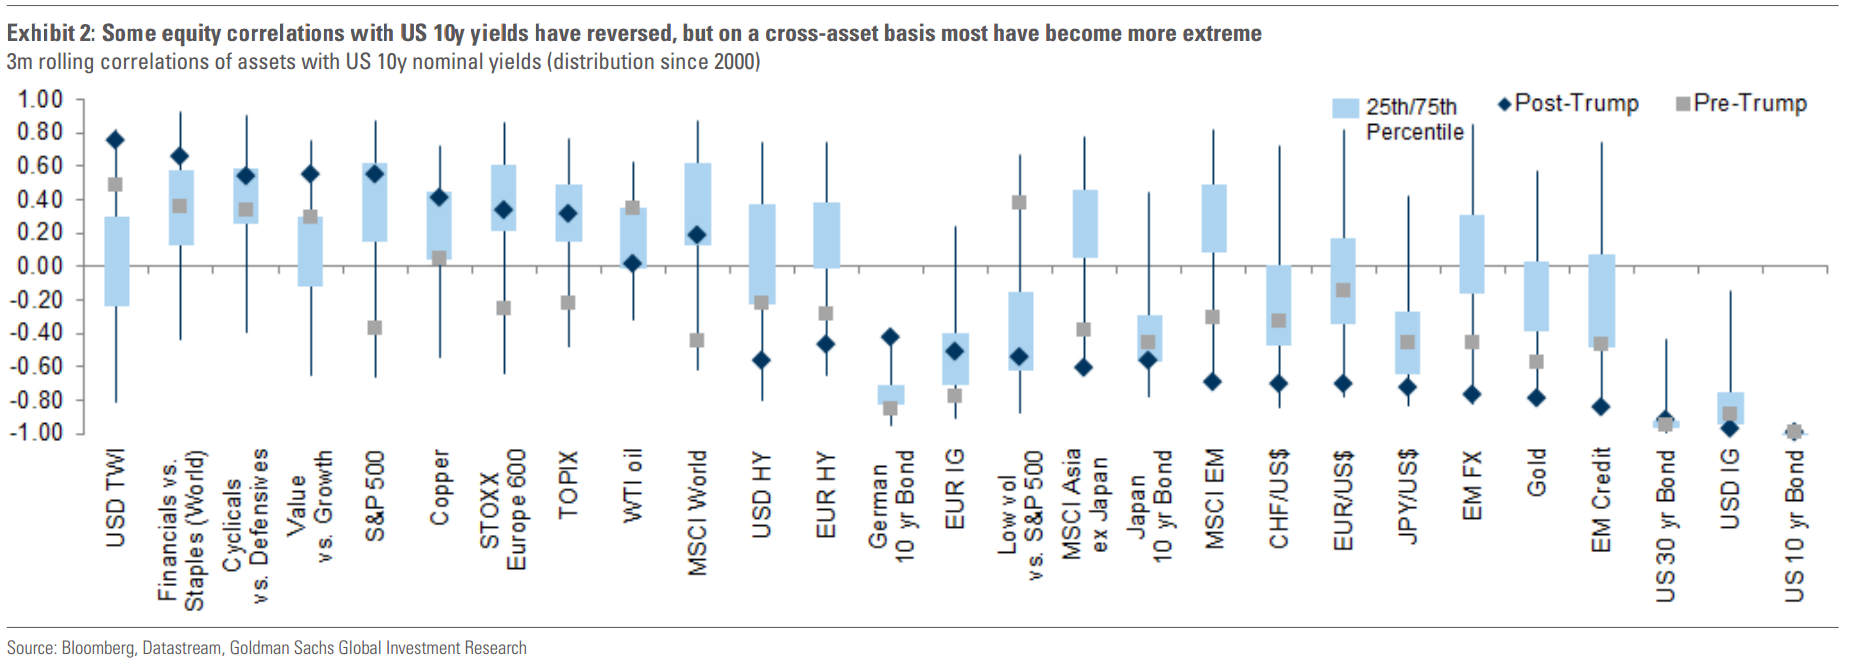
Exhibit 1 plots cross-asset performance before and after the peak in risk appetite, and also plots how much reversal in the initial post-US election performance there has been since the risk appetite peak. Few trades have actually “reversed” performance in a meaningful way, with some standouts being EM, value v. growth and gold. MSCI EM has, for example, reversed more than 150% of its initial post-US election sell-off and is near its high of last year, while gold and value v. growth (based on MSCI World) have retraced just over 50% of their performance. A number of assets have actually continued their initial post-election trends (i.e. have had negative reversal amounts). The most dramatic of these have been European periphery debt, the FTSE 100 and US breakeven inflation continued their initial post-election trends (i.e. have had negative reversal amounts). The most dramatic of these have been European periphery debt, the FTSE 100 and US breakeven inflation. Exhibit 2 plots how correlations with yields have shifted from before the election to after. While some have shifted as we have written before, that most of the correlations in Exhibit 2 have become more extreme – but not changed sign – indicates that most of the relationships since the election were in place before as well. This fits with our narrative that a number of the ‘Trump trade’ performance trends were also already in place prior to the election. Since summer 2016, cyclicals were outperforming defensives, inflation was rising, and bonds were starting to sell off, for example. However, the election result caused a bump to the level of the trend.
Exhibit 2 plots how correlations with yields have shifted from before the election to after. While some have shifted as we have written before (for example, see GOAL Kickstart: Correlation normalisation?, January 30, 2017), that most of the correlations in Exhibit 2 have become more extreme – but not changed sign – indicates that most of the relationships since the election were in place before as well. This fits with our narrative that a number of the ‘Trump trade’ performance trends were also already in place prior to the election. Since summer 2016, cyclicals were outperforming defensives, inflation was rising, and bonds were starting to sell off, for example. However, the election result caused a bump to the level of the trend.
From here we expect many of those same trends to slowly continue. Our rates strategists recently reiterated our view of further upside to Euro area and US inflation. Alongside this, we continue to have a cyclical tilt in our global equity portfolio sectoral preferences (e.g. we are OW financials and UW staples across regions) and have reiterated our Overweight equity, Underweight bonds view In addition, we are Overweight Europe and Japan equity over 12m, who should be beneficiaries of higher inflation. We also forecast USD strength to resume.
Advertisement
Yep, though the inflation pulse is temporary as oil and wider commodities lose traction and Europe, sheesh, is not for the buying!
David Llewellyn-Smith is Chief Strategist at the MB Fund and MB Super. David is the founding publisher and editor of MacroBusiness and was the founding publisher and global economy editor of The Diplomat, the Asia Pacific’s leading geo-politics and economics portal.
He is also a former gold trader and economic commentator at The Sydney Morning Herald, The Age, the ABC and Business Spectator. He is the co-author of The Great Crash of 2008 with Ross Garnaut and was the editor of the second Garnaut Climate Change Review.