
Yesterday, Residex amended its property price index results for the December quarter to include median values, thus providing an opportune time to yet again compare how each of the major data providers are tracking each other across the major markets.
The below charts plot nominal annual house price growth, with:
- ABS current to September 2016;
- APM (Domain) current to December 2016;
- Residex current to December 2016; and
- CoreLogic current to December 2016.
First is the state-of-play at the national capital city level:
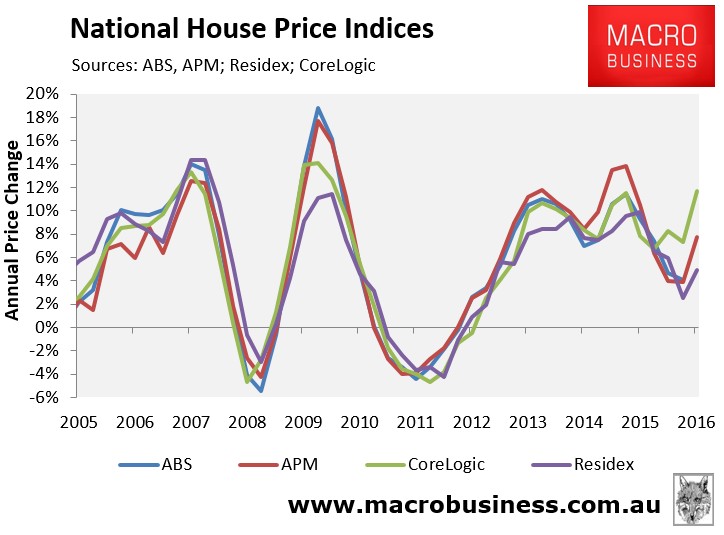
As you can see, CoreLogic reported strong 11.7% annual price growth, versus APM’s 7.7%, Residex’s 4.9%, and the ABS’ 4.1%.
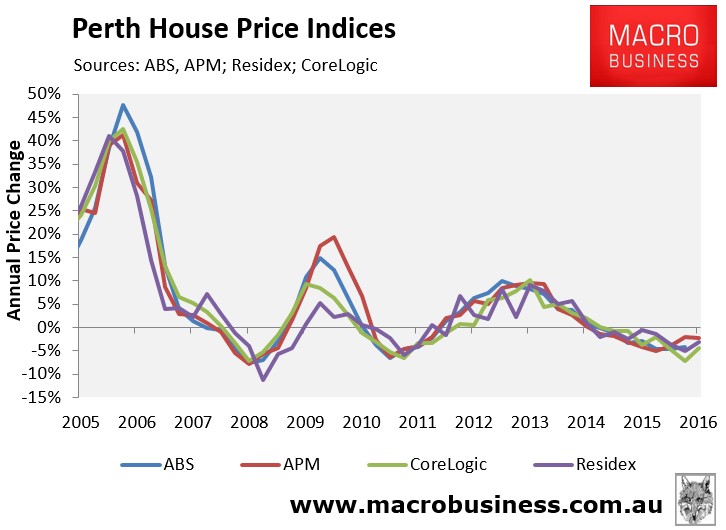
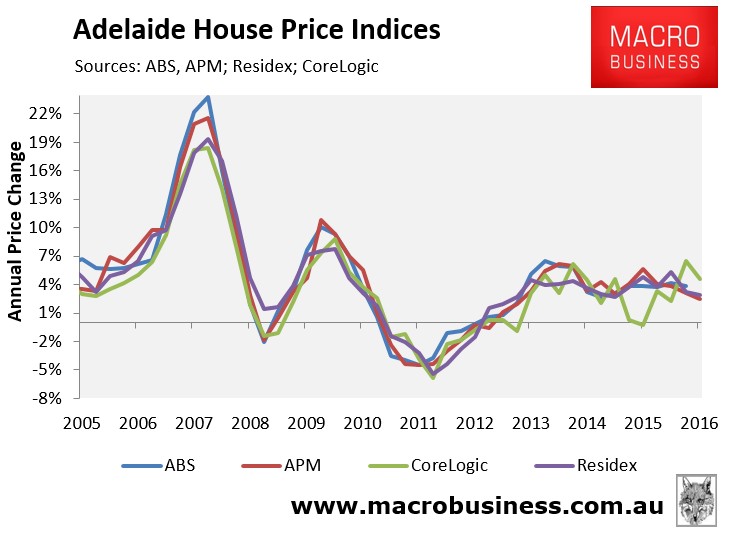
The next charts plot annual house price growth across the major capitals:
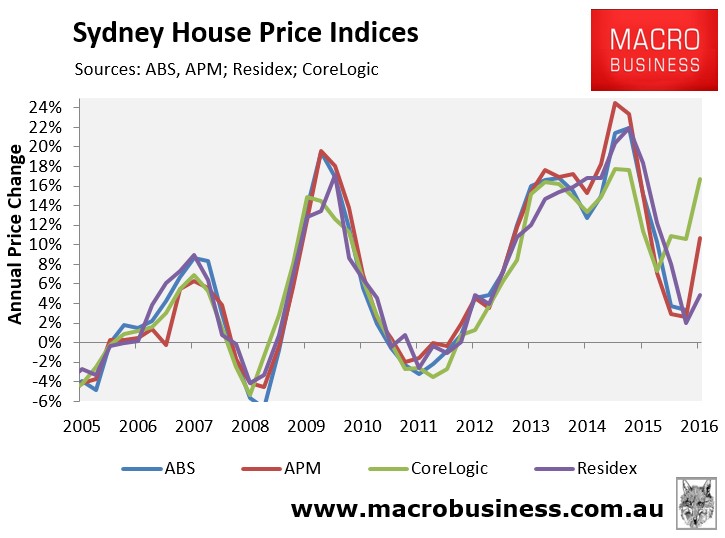
As you can see, Sydney is the main driver of the divergence between CoreLogic and the other house price indices. CoreLogic has Sydney house prices growing at 16.7% annually, versus APM’s 10.7%, Residex’s 4.9%, and the ABS’ 3.3%.
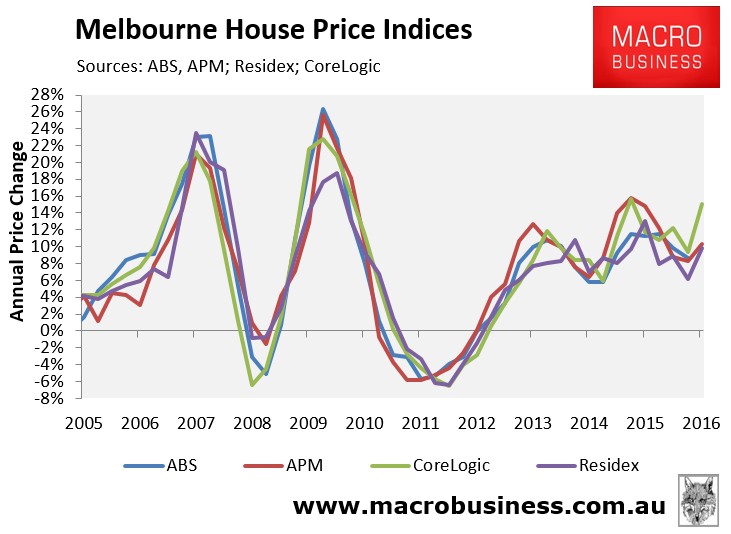
Melbourne has contributed to a lesser extent, with CoreLogic reporting 15.0% growth versus APM’s 10.3%, Residex’s 9.8%, and the ABS’ 8.6%.
The main possible explanation for the divergence between the indices is that they measure house prices differently, as well as timing.
In a nutshell, both the ABS and APM (Domain) use variants of the stratified median price method, which controls for changes in the composition of properties sold by separating the total sample of properties into a number of geographical sub-samples, and then into different strata based on the long-term average price level of properties in those regions.
CoreLogic uses a hedonic methodology, which measures price changes for both detached houses and units on a like-for-like basis according to their key attributes, such as location, land size, number of bedrooms and bathrooms, and so on.
Finally, Residex primarily uses a repeat sales methodology, similar to the Case-Shiller Index in the United States, which calculates price changes based upon repeat sales of the same homes. In order to minimise the price-distorting effects that renovations and new home sales have on prices, Residex also employs a combination of the hedonic technology and stratified median index technologies used by the other providers.
Another contributing factor may be that CoreLogic changed its methodology in April 2016, which raised question marks over its accuracy (see here).
Previously I speculated that CoreLogic had probably overstated Sydney’s price growth, whereas the other indexes had probably understated it. And now that APM (Domain) has caught up somewhat in the December quarter, with Residex following behind, my intuition was probably correct, with the ABS likely to follow suit when its December results are published.
Nevertheless, we would still like to see CoreLogic backwardly adjust its the daily index to its inception (in March 2011) using the new methodology, so that we can get a more accurate depiction of the strength of the market, especially in Sydney.
unconventionaleconomist@hotmail.com
