Happy new year to everyone. It’s great to be back after a one-month sabbatical.
Given that I have been away so long and have missed the latest round of data releases, I thought it timely to recap the main statistical releases that have been released since the new year. These are broken-down below by topic.
Housing market:
The 2016 calendar year ended with the release of the RBA’s private sector credit data for the month of November, which registered a dampening of housing credit growth.
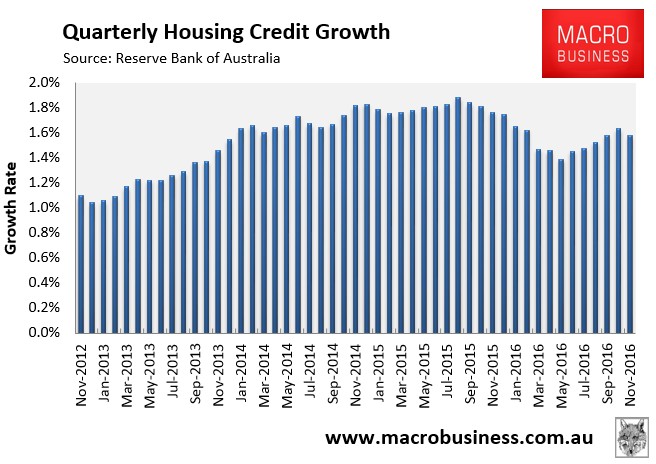
Quarterly housing credit growth slid back to 1.58% and broke a 5-month uninterrupted rise:
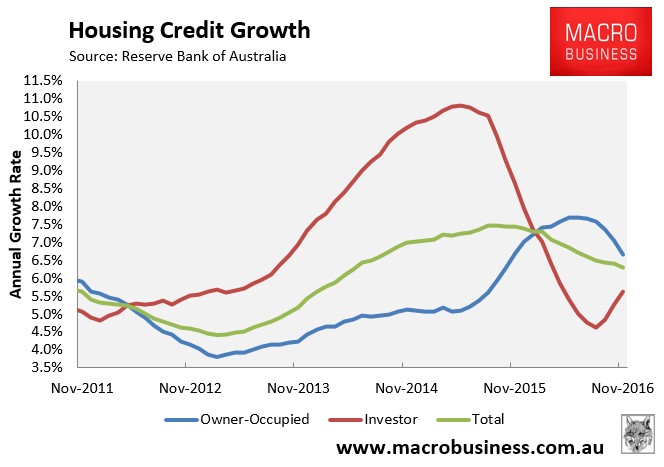
Annual housing credit growth also continued to weaken, falling to 6.29%, albeit with a continued rotation from owner-occupiers (6.66%) to investors (5.63%):
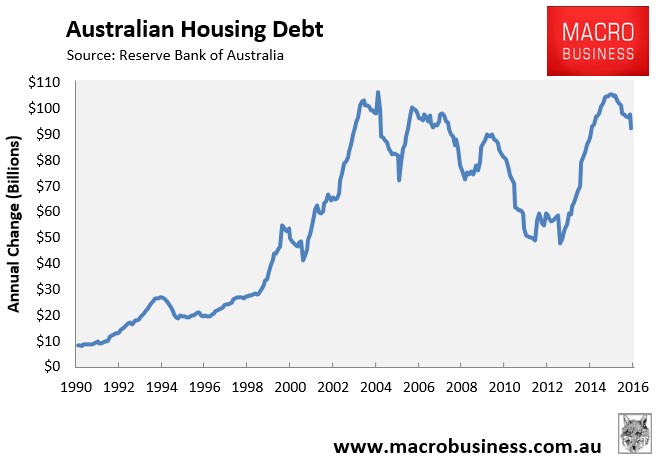
The annual dollar growth in housing credit also continued to weaken, down 13% in the year to November:
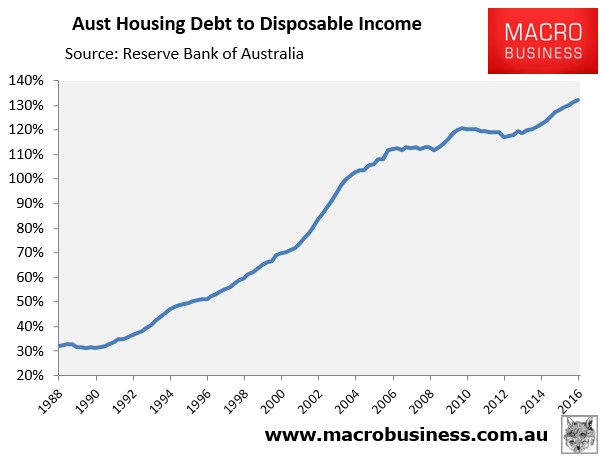
The RBA also released its household finance ratios for the September quarter, which registered further increases in debt ratios to new record heights, with the ratio of housing debt-to-disposable income rising to 132.2%:
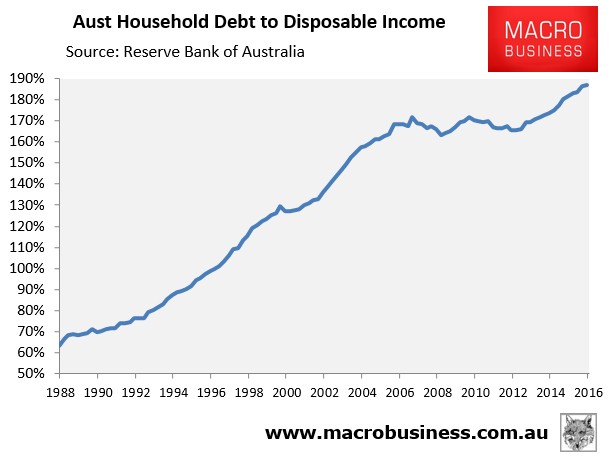
The ratio of total household debt-to-disposable income also rose to a record high 186.9%:
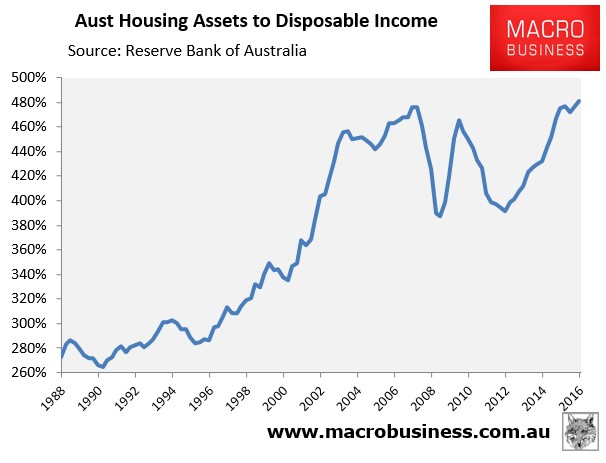
Meanwhile, the total value of housing assets to disposable income reached an all-time high 481.1% of annual household disposable income:
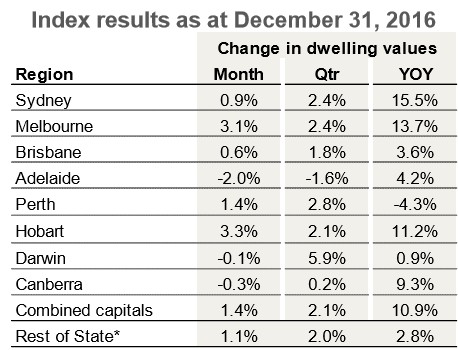
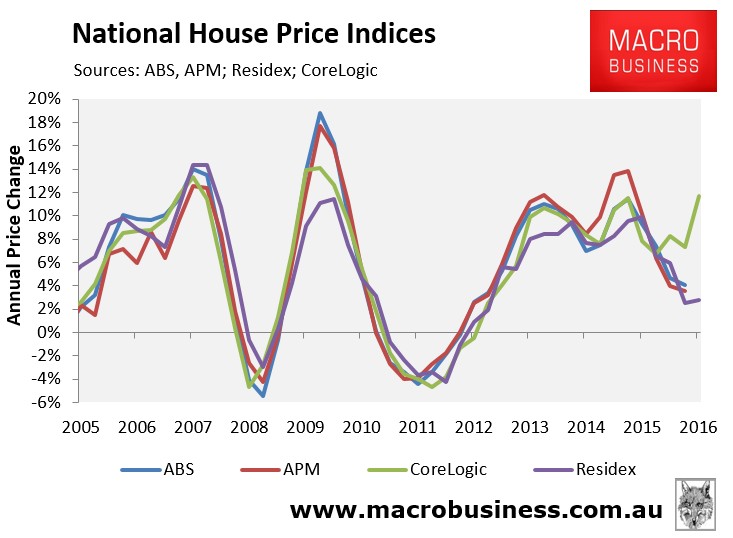
At the beginning of January, CoreLogic released its dwelling value results for the 2016 calendar year, which recorded strong 10.9% annual growth at the combined capital city level, driven almost entirely by Sydney (15.5%) and Melbourne (13.7%):
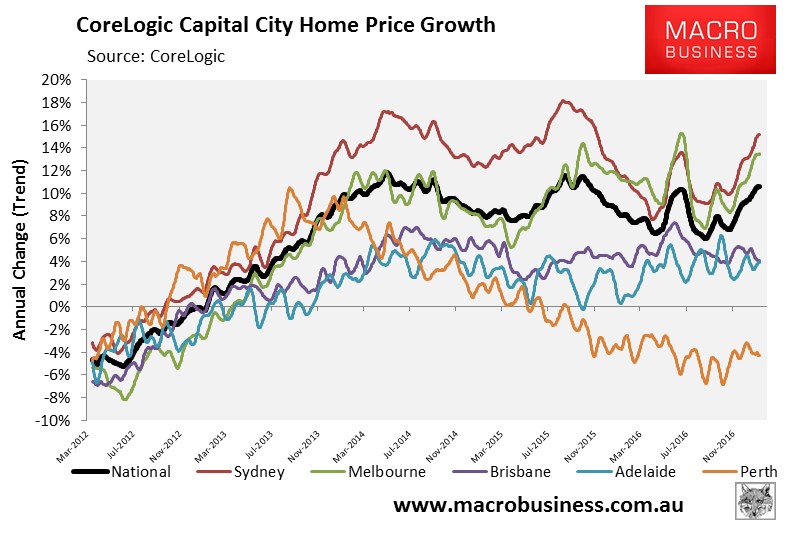
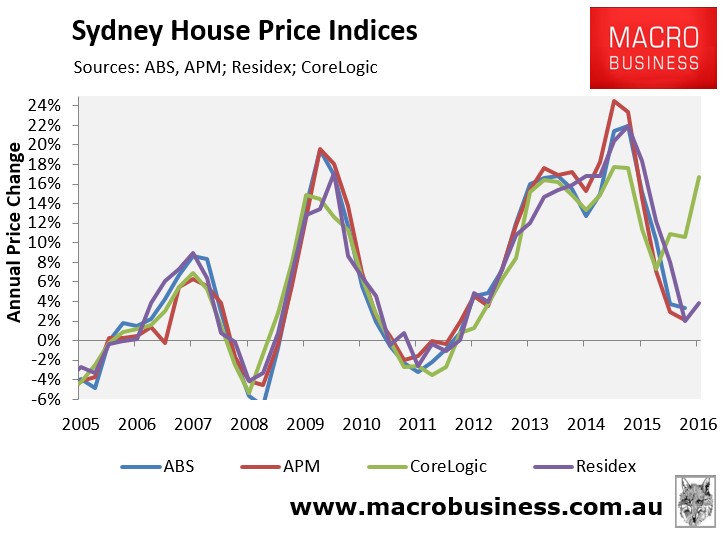
CoreLogic’s results continue to differ considerably from the other major indices:
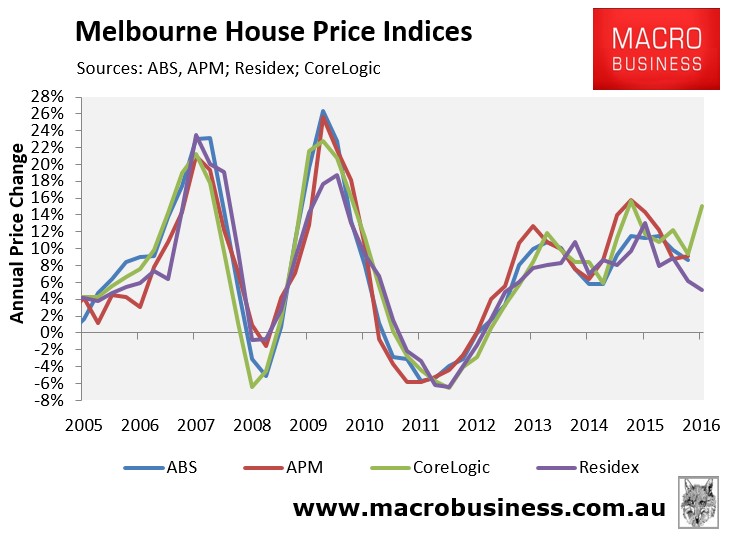
With Sydney most out-of-whack, followed by Melbourne:
The main possible explanation for the divergence between the indices is that they measure house prices differently.
In a nutshell, both the ABS and APM (Domain) use variants of the stratified median price method, which controls for changes in the composition of properties sold by separating the total sample of properties into a number of geographical sub-samples, and then into different strata based on the long-term average price level of properties in those regions.
CoreLogic uses a hedonic methodology, which measures price changes for both detached houses and units on a like-for-like basis according to their key attributes, such as location, land size, number of bedrooms and bathrooms, and so on.
Finally, Residex uses a repeat sales methodology, similar to the Case-Shiller Index in the United States, which calculates price changes based upon repeat sales of the same homes. In order to minimise the price-distorting effects that renovations have on home prices, Residex also employs a combination of the hedonic technology and stratified median index technologies used by the other providers.
Another possible explanation is that CoreLogic changed its methodology in April 2016, which has raised question marks over its accuracy (see here).
My gut feel is that CoreLogic has probably overstated Sydney and maybe Melbourne’s price growth, whereas the other indexes have probably understated it. I say this only because auction clearance rates in Sydney and Melbourne have run strong (albeit on lowish volumes), which usually corresponds with solid growth. On the other hand, housing finance growth has been weak, as has transaction volumes, which normally suggests lower price growth.
Ultimately, we won’t be able to gauge the full impact of CoreLogic’s methodological change, and the true state of the market, until CoreLogic backward adjusts the daily index to its inception (in March 2011) using the new methodology.
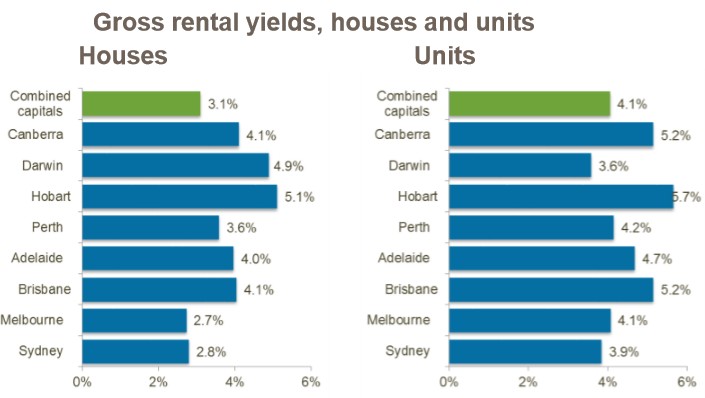
In any event, the continued appreciation of home values (particularly in Sydney and Melbourne) combined with ongoing sluggish rental growth, saw rental yields fall to new record lows in December:
Finally, the ABS released its dwelling approvals data for November 2016, which registered more weakness, with trend approvals nationally continuing to fall:
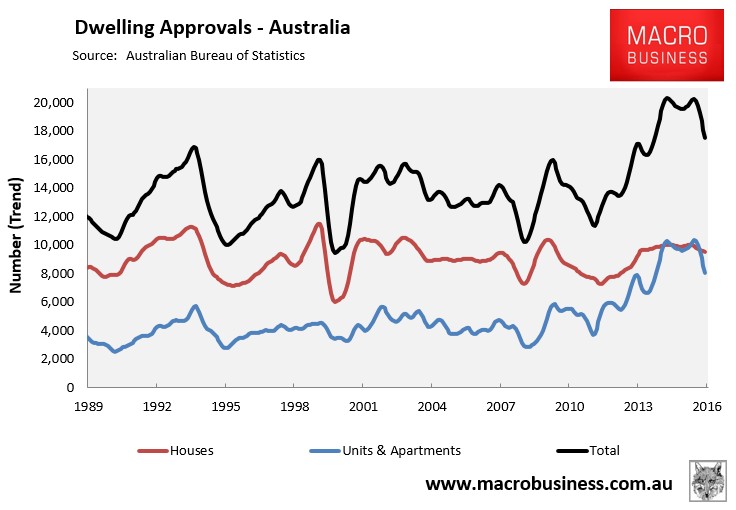
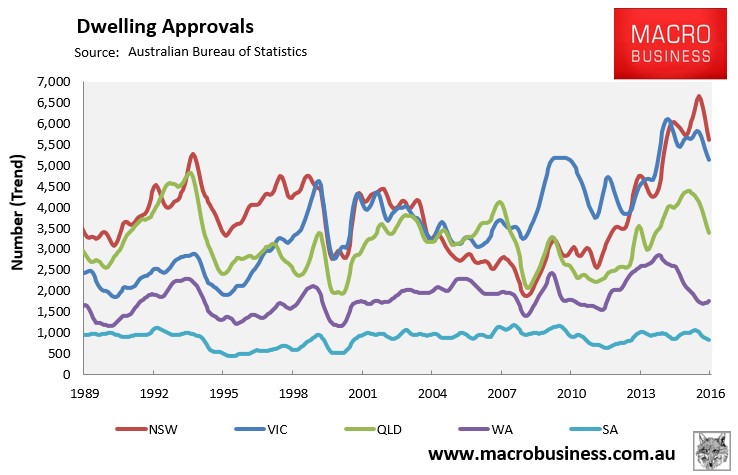
All major jurisdictions below prior peaks:
And the high-rise apartment boom nearing its peak everywhere except NSW:
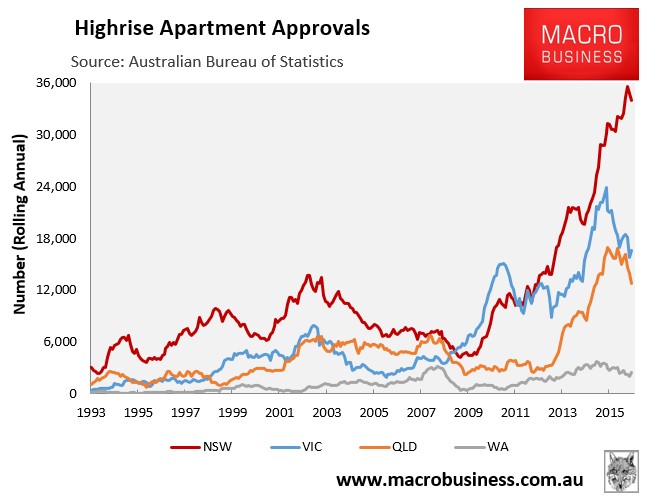
Note from the first chart above that apartment approvals first peaked in April 2015. Assuming a 2-2.5 year lag between approvals and completions, this suggests that the apartment construction boom should peak late this year, by which time it will stop adding to employment and growth (and may very well start detracting).
Commodities:
The news around commodities continued to improve.
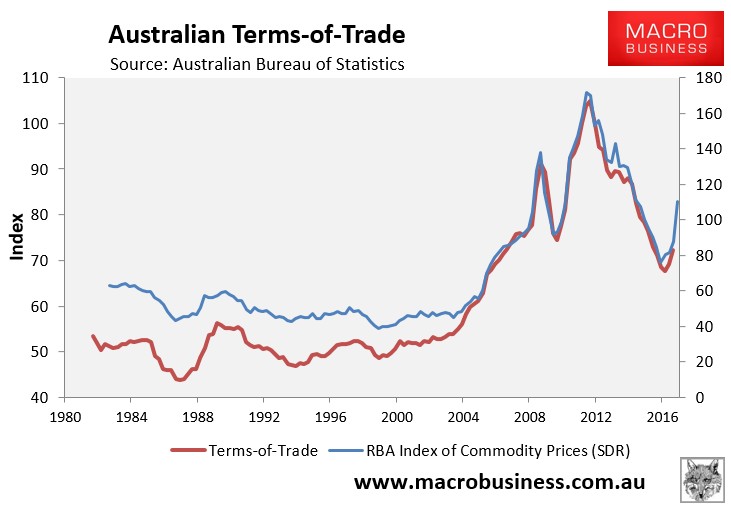
Early in the month, the RBA released its commodity price index for December, which registered a massive rise, with the index rocketing by 8.1% in December, by 26.0% over the December quarter, and by 45.5% over the year in SDR (currency weighted) terms:
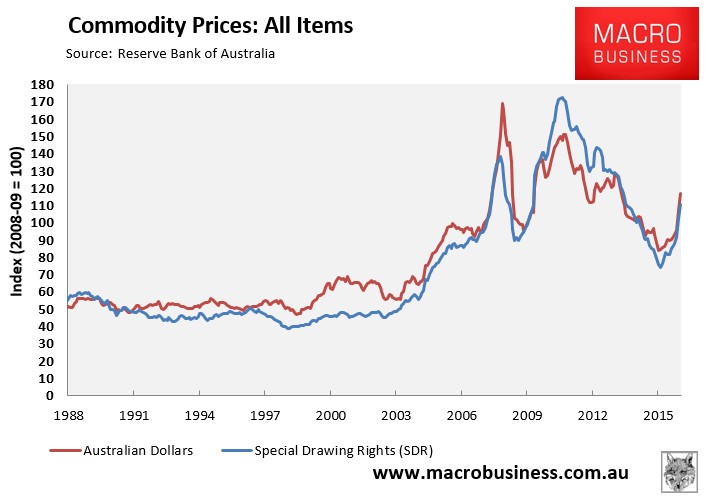
The commodity price index in SDR terms correlates well with the terms-of-trade (see next chart), suggesting that the national accounts for the December quarter, which are due for release in early March, will register a big rise in the terms-of-trade and national income:
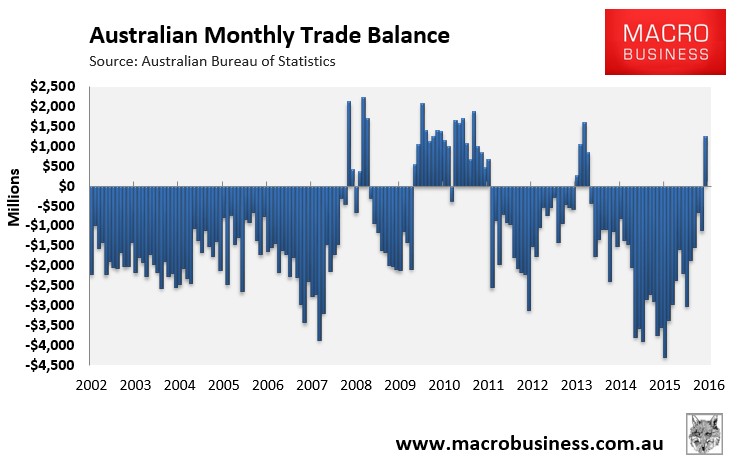
The trade data for November, released by the ABS, was also heavily supported by rising commodity prices, with the trade balance swinging strongly to a surplus of $1,243 million – the first monthly surplus recorded since March 2014:
The annual value of commodity exports is now rising once more, joining the steadily rising services exports:

Retail Sales:
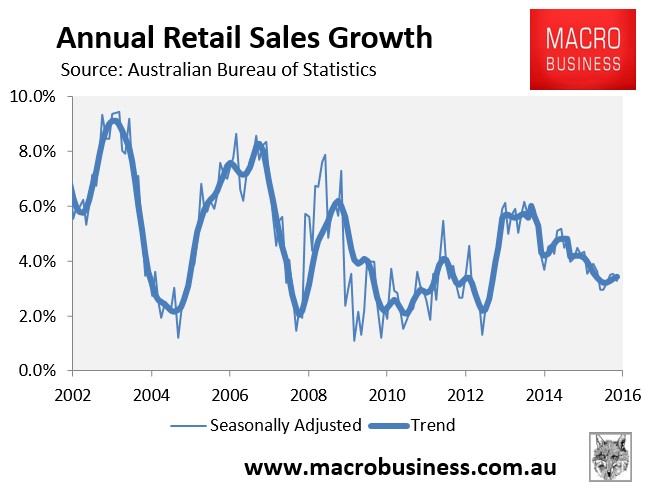
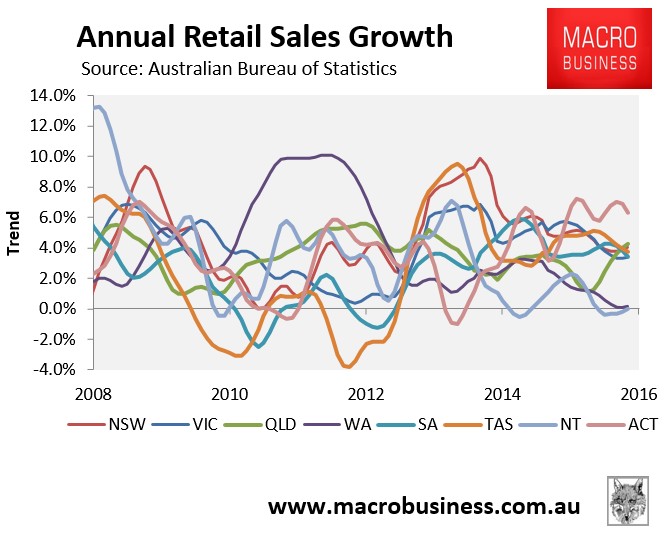
Retail sales growth remained soft in November, with annual growth clocking in at 3.3% (seasonally adjusted) and 3.4% (trend):
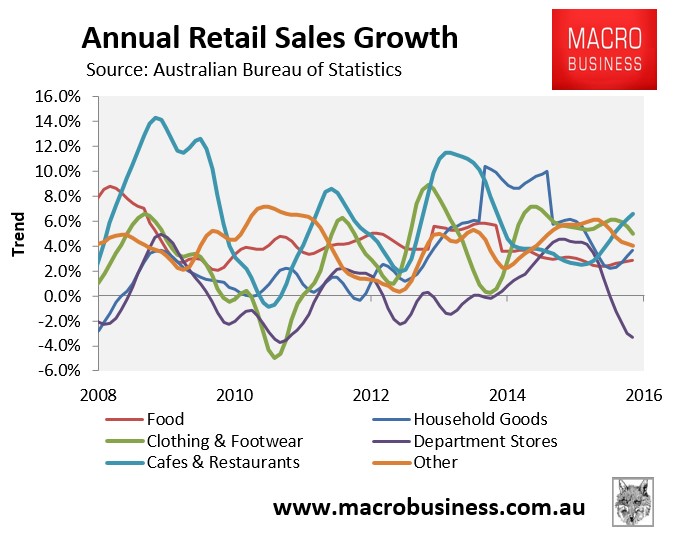
Looking across the segments, you can see that cafes & restaurants is leading the way, with department stores experiencing negative growth:
Outside the mining strongholds of WA and NT – who are in the gutter – retail sales growth is fairly uniform across the jurisdictions:
Labour Market:
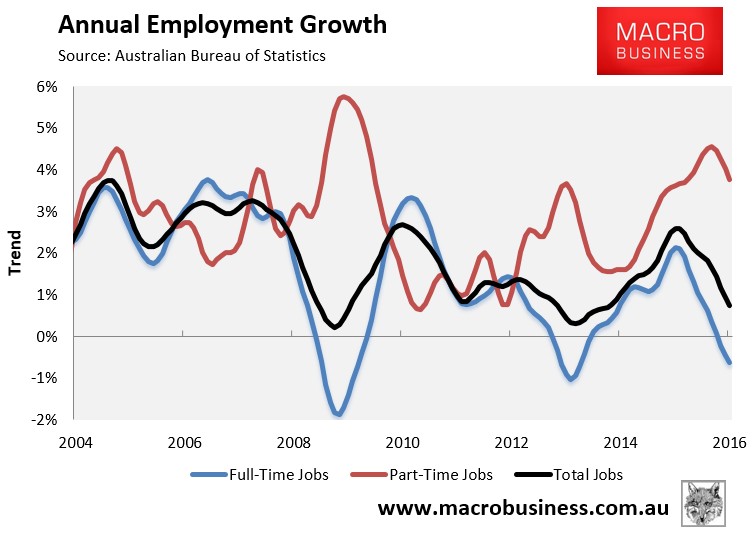
While November’s jobs growth figures cratered, with full-time jobs contracting:
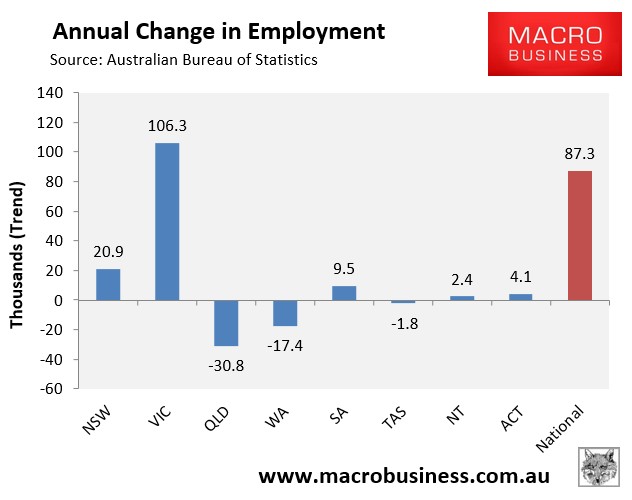
And all of this jobs growth coming from the two housing bubble markets of VIC (Melbourne) and NSW (Sydney):
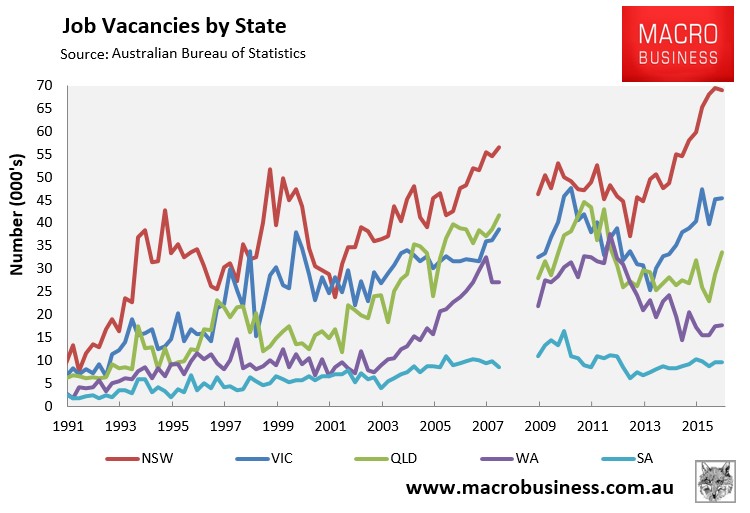
Jobs vacancies improved further, up by 2.3% in the November quarter and by 8.3% over the year:
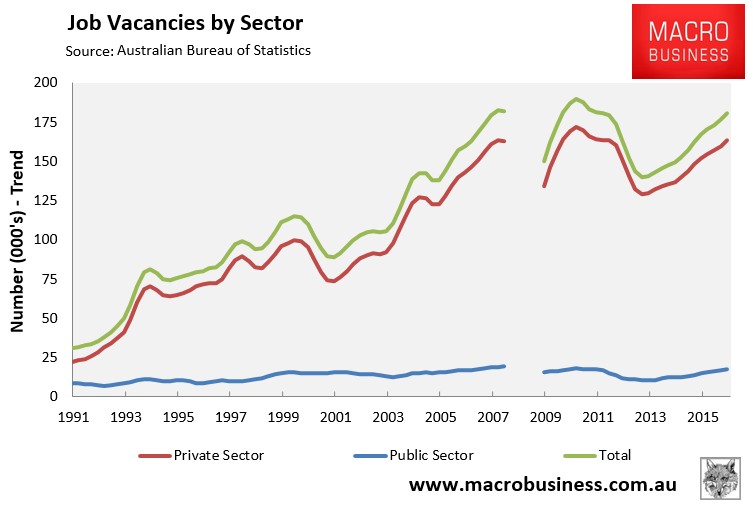
Again, with NSW and VIC driving this growth in job ads:
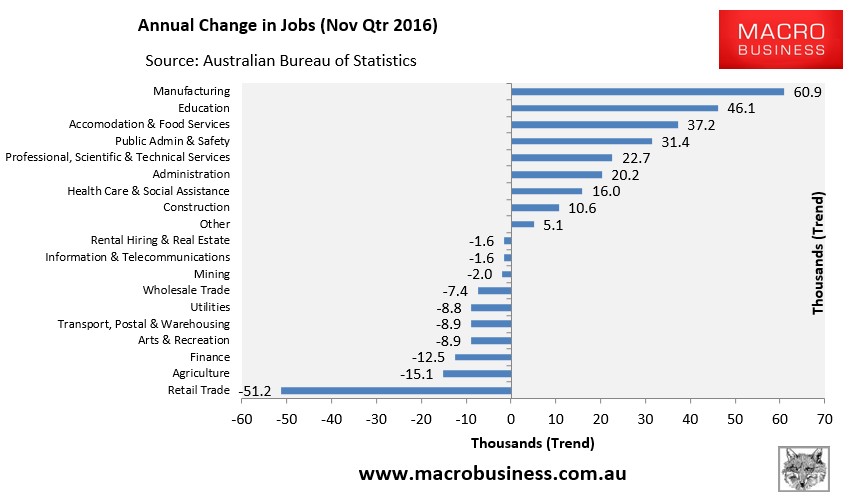
The ABS also released its quarterly employment data by industry, which perversely registered strong growth in manufacturing employment over the year:
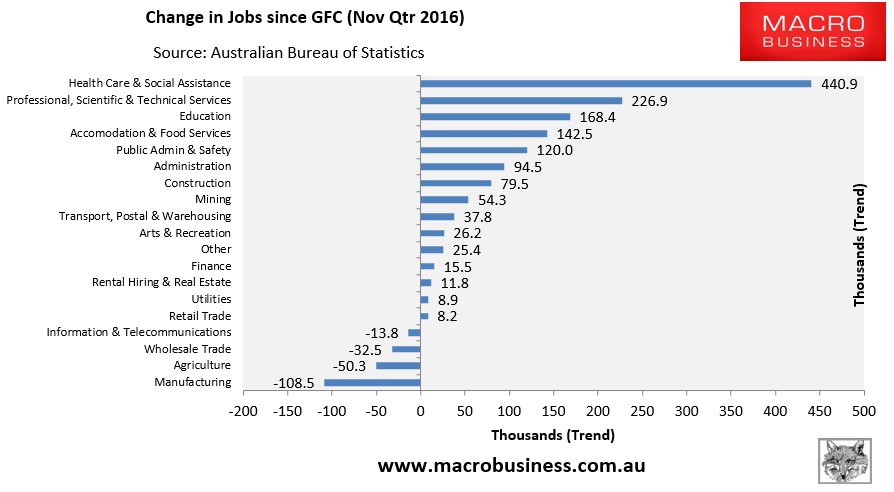
Helping to offset some of the heavy manufacturing job losses since the onset of the GFC:
Hopefully, you have found this update useful.
