
The 13th Annual Demographia International Housing Affordability Survey, released on Monday, garnered its fair share of attention for highlighting the woeful state of housing affordability in Australia, especially in the big cities of Sydney and Melbourne.
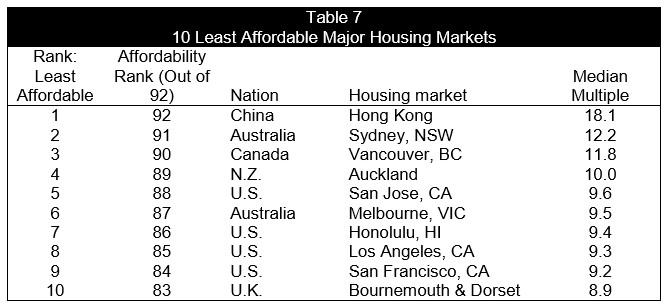
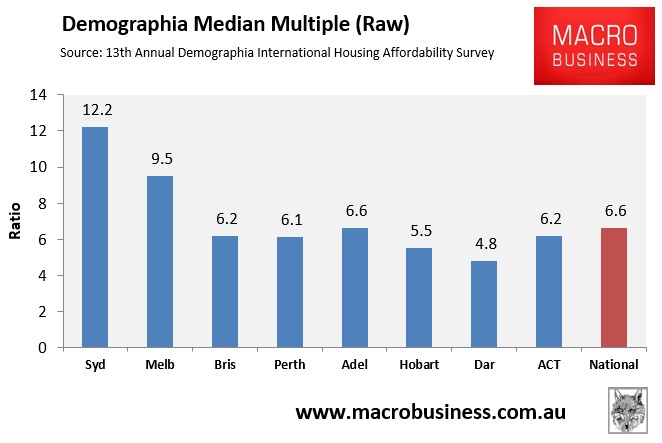
According to Demographia, the “Median Multiple” (median house price divided by gross annual median household income) in major Australian markets was 6.6, which placed Australia’s housing market as the third most expensive out of the 406 urban markets in nine countries surveyed, with Sydney and Melbourne ranked the second and sixth most expensive housing markets respectively:
As always, the Demographia survey has garnered a knocker or two, with the long-time defender of Australia’s expensive housing, Stephen Koukoulas (aka “the Kouk”), penning the following on Wednesday afternoon, via The Guardian:
Unfortunately, the Demographia report doesn’t disclose the specific sources for key data and instead relies on vague and untestable assumptions for the numbers that form the basis of their calculations.
Those reporting its findings have universally failed question the numbers underpinning the findings.
I can only speak of the Australian data, but the methodology and data used for calculating affordability in our cities and towns appears to be at best a very rough estimate.
Demographia calculates affordability by dividing the median house price by median household income to get what it calls a “median multiple”.
This is the first shortcoming – there is no mention of interest rates in the calculation…The next, more important, concern is the Demographia estimate for “median household income”…
The next issue is source of the house price data. It is not clear the source of this information but it is certainly NOT from the Australian Bureau of Statistics. The median house price in Sydney in the September quarter 2016 is $882,000 according to the ABS. It is $1,077,000 according to Demographia, which does not disclose the specific source…
Housing affordability will no doubt be a dominant issue in Australia for some time. It is unhelpful when a factually ambiguous report is used by many to analyse the issue when there has been excellent fact based work on the topic from credible sources.
First, page 69 of the Demographia report lists a bunch of sources used to calculate the “Median Multiple”, so I am not sure what the Kouk is complaining about.
Second, the complaint about not including interest rates in the Median Multiple calculation hardly diminishes the Demographia report. Demographia did not invent the Median Multiple affordability indicator. It, and similar types of price-income indicators, have been used for years by international organisations for international comparisons, such as the OECD, the IMF, and the Harvard Joint Centre for Housing. It seems that only some in Australia find this a problem, which may not be that surprising since Australia has one of the biggest problems.
Moreover, mortgage rates have fallen just as far, if not further, in the other nations surveyed by Demographia. Hence, comparing Median Multiples across nations provides a reasonable estimate of affordability for international comparison purposes.
Common housing affordability measures incorporating mortgage rates also tend to be bunk, for reasons explained here and here.
Third, why on earth would Demographia use the ABS’ unstratified median house price figures? These have not been adjusted for compositional change, hence they are the least accurate measure to use for house prices.
To illustrate, the ABS’ September property price report lists Sydney’s unstratified median price at $882,000 and claims that it fell by 2.1% over the September quarter and by 2.5% over the year. Now compare this to the ABS’ stratified median house price index, which is adjusted for compositional change and is the measure both reported on the ABS website, used by analysts, and quoted in the media. It showed Sydney’s median house price rising by 2.9% over the quarter and by 3.3% over the year.
In any event, I have decided to test the Demographia survey against my own calculations of Australia’s Median Multiples.
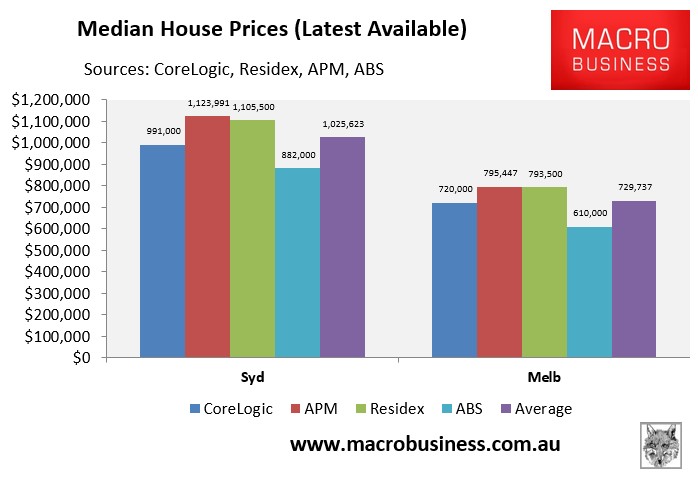
For median house price data, I have averaged-out the latest figures from Australia’s four main data providers, namely CoreLogic, APM (Domain), Residex, and the ABS. Each data provider uses different methodologies – CoreLogic (hedonic), APM (stratified median), Residex (repeat sales), and ABS (simple median) – hence giving slightly different results, as illustrated below:
For median income, I have used the ABS’ latest capital city gross median household disposable income data, which is available as at June 2014:
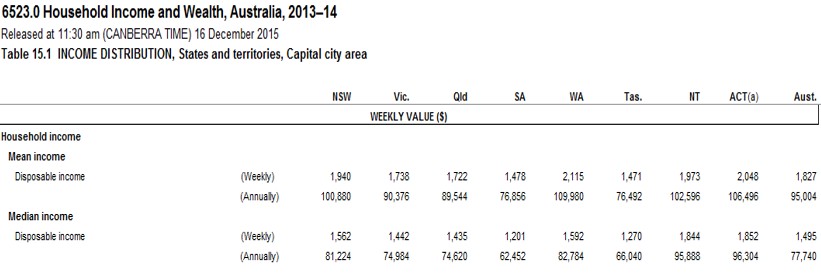
I have then adjusted these figures upwards by the ABS’ quarterly labour price index, to give the following:

It is worth noting that median household incomes are likely overstated in the above table, since actual average weekly earnings have grown more slowly than the labour price index, due to such things as the rotation into lower paying services jobs and the relative reduction in full-time employment.
Nevertheless, combining the above estimates of median house prices with median household incomes gives the following median multiples for Australia:
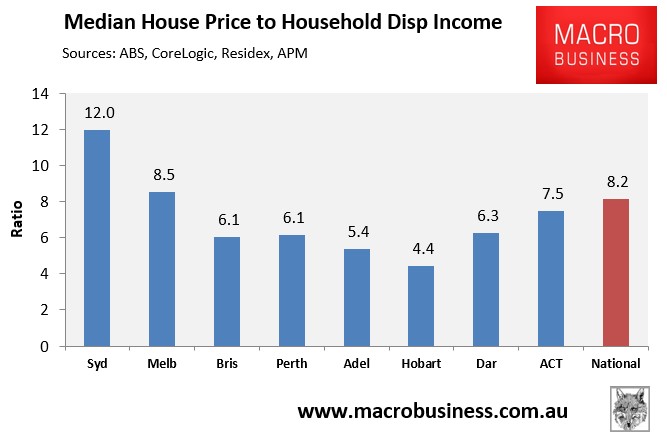
And these are similar to those calculated by Demographia, at least across the major capitals:
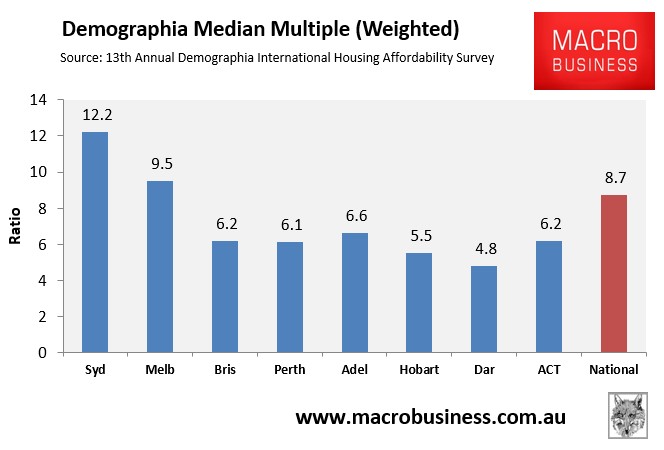
One clear shortfall of the Demographia survey is that it does not weight each city relative to the sample size. Thus, it ascribes the same weighting to Hobart as it does to Sydney and Melbourne, which obviously biases down the Median Multiple for Australia as a whole. This approach is likely taken for simplicity – applying weightings across 406 urban markets would be a nightmare!
Therefore, in the below chart I have applied weightings to Demographia’s Australian capital city Median Multiples, which gives a Median Multiple for Australia of 8.7:
Despite the Kouk’s pedantry, the Demographia survey appears to give a fair assessment of housing affordability for Australia. If anything, the survey’s main shortfall is that it understates Australia’s housing affordability problem.
unconventionaleconomist@hotmail.com
