Macquarie as usual is the sell side research leader:
Iron ore prices have remained disconnected to the fundamentals in our view since late October, ranging from $60-83/t despite clearly abundant supply of iron units (albeit shortages of some higher grade material, as we wrote previously). Iron ore prices now look set to average over $65/t in 4Q16, the highest quarterly average price since 4Q14. We have updated our demand numbers, reflecting the recent strength in Chinese demand and a stronger ex-China view. However, we still believe iron ore supply remains abundant with prices above $60/t, and with Chinese mine costs lower in US$ terms given recent RMB depreciation, we do not see a return of cost inflation in iron ore mining which justifies prices anywhere near current levels. We still expect to see a contraction in Chinese steel consumption from late 2017.
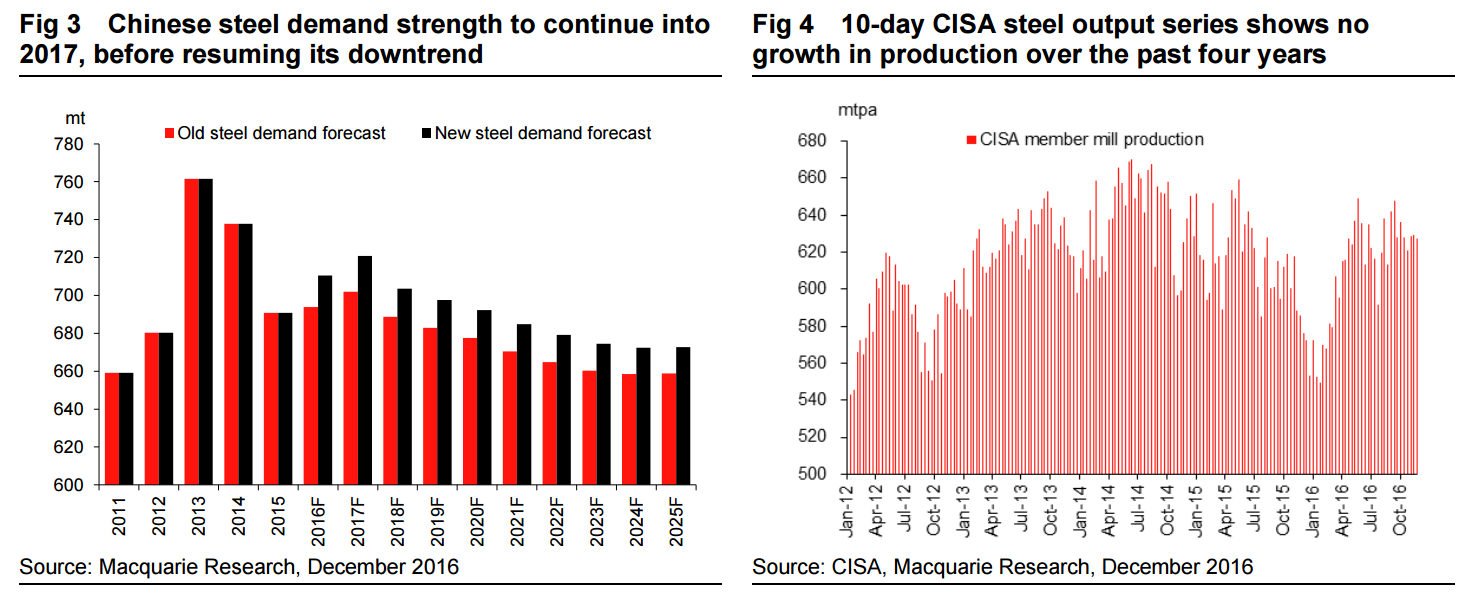
Clearly steel demand has performed better than we expected earlier this year, and we have updated our steel demand model with the latest macro data inputs as discussed here. This leads us to revise 2016 steel demand up to 2.9% YoY growth, or 710mt of domestic Chinese steel consumption. Compared to our prior forecast of 0.4% demand growth made in 2Q16, the upgrade in demand has largely been driven by residential property (-3% to +8%), but as the economic recovery has become broader-based, we have also lifted our consumption forecasts for other sectors, including machinery (0% to 2%), autos (6% to 7.2%) and appliances (1.3% to 2.7%).
While domestic steel consumption now looks like being 16mt higher than we previously expected, net exports look like being 5mt lower, as there has been a clear drop-off in Chinese steel exports in 2H16. This has been driven partially by stronger steel demand and prices in China, but we have long been writing that we believed ex-China developing markets had already been saturated by Chinese steel exports since last year, and hence we do not expect export volumes to recover going forward. For 2017 we expect Chinese steel exports to decline again, from 106mt to 99mt, but then we expect exports to stabilise around those levels from 2018 onwards.
For 2017 we forecast Chinese steel consumption to rise by 1.5%, despite the higher base in 2016. We continue to look for steel consumption in China to make a strong start to 2017 on follow through spending in infrastructure and property post Chinese New Year, and the ongoing demand strength in consumer-related sectors. The key risks to our forecasts would come from a more rapid slowdown in China’s property market (as we wrote about recently here), or an earlier tightening of macro policy on inflation concerns .
Beyond 1H17, we continue to expect Chinese steel consumption to resume the declining trend seen over 2014/15. We believe the current infrastructure boom has resulted in front-loading of the five-year plan and hence infrastructure steel consumption will decline from 2H17. In property we continue to worry that the slowing pace of urbanisation combined with the demographic profile does not support a structural recovery in housing construction, and we expect floorspace construction volumes to resume their 2014/15 downtrend from 2H17.
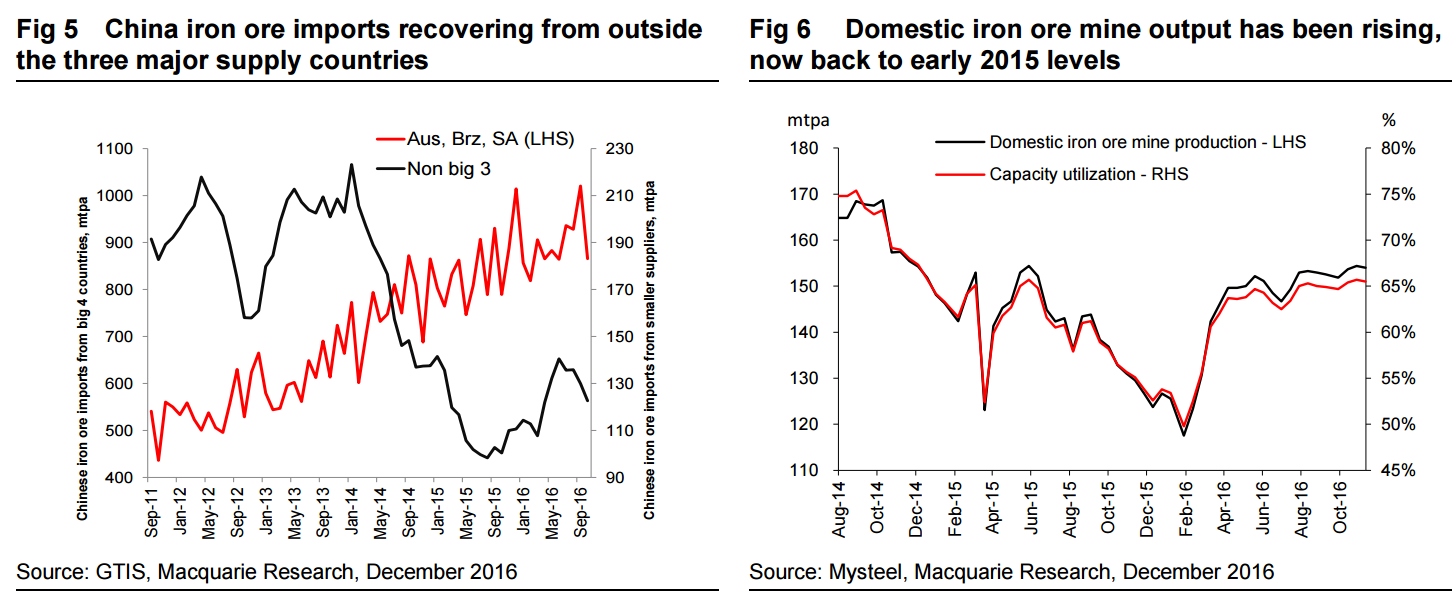
In terms of iron ore demand, our revision to 2016 steel consumption and exports means that our steel production forecast is only increased by 10mt, and we forecast iron ore consumption to rise by the same after allowing for a slight increase in domestic scrap generation. While iron ore consumption in China this year is only 10mt higher, iron ore imports look on course to rise by around 80mt.
In addition to a surge in iron ore imports, domestic Chinese iron ore mine output has also picked up in 2H16 in response to higher prices. According to latest Mysteel data, domestic private mines have been operating around a 65% capacity utilisation level since September, compared to 50- 54% run rates over most of 1Q16. This increase should imply around 35mt of additional supply on an annualised basis. YTD average domestic mine output according to Mysteel is only up around 2mt, however, as output was strong in 1H15 but fell sharply in 2H16.
Data from SMM meanwhile, which covers a wider sample of mines, shows total domestic mine capacity utilisation at 53.2% in November, of which SOE mines are running at 82.2%, both their highest readings since 1Q15. Heading into winter, however, SMM expect some mines to reduce or suspend output for a few weeks, but domestic iron ore mines are not under much apparent environmental pressures, and it is quite clear to us that their output is highly price-elastic, and hence another reason why we believe supply of iron ore is more than plentiful at current prices.
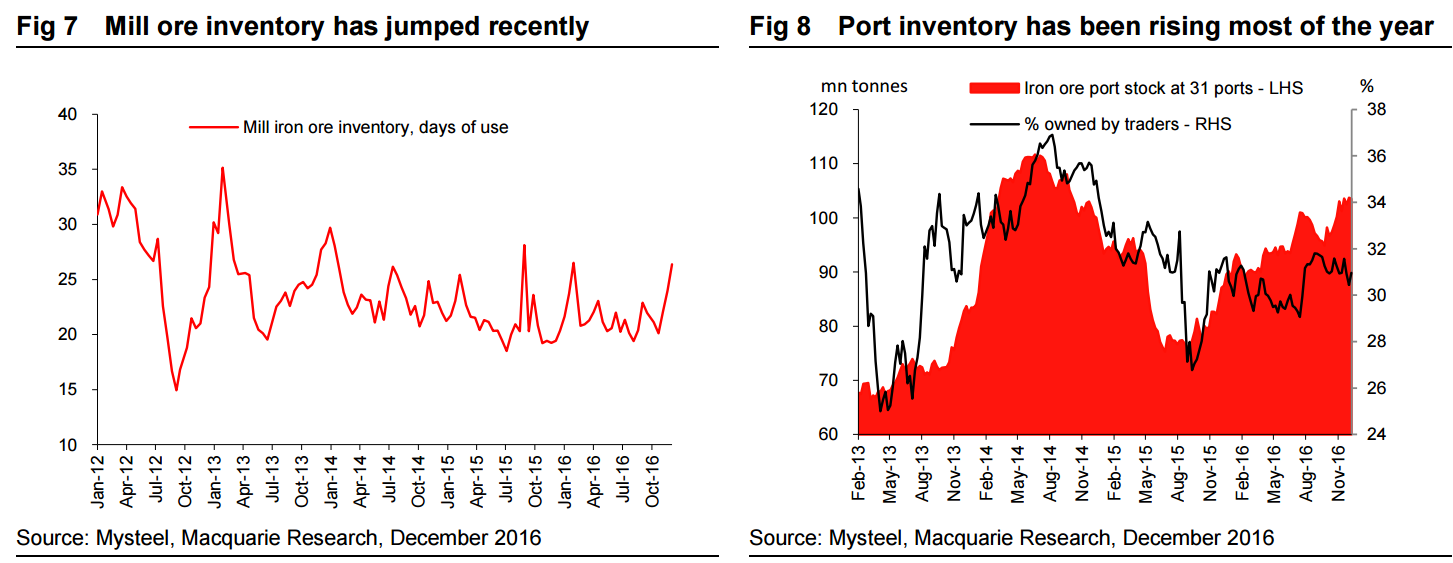
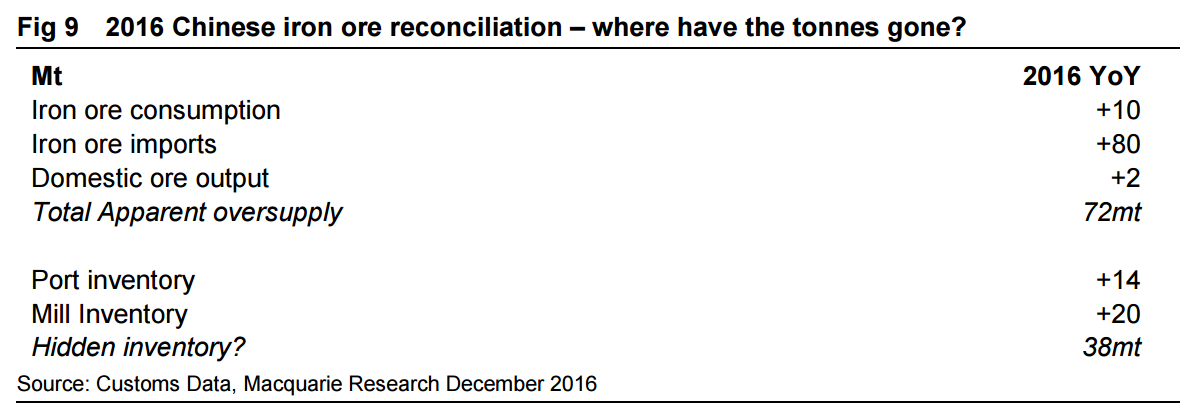
We still struggle to explain why iron ore prices have been holding at such elevated levels in recent weeks. With iron ore consumption up only 10mt this year, but imports up 80mt, and domestic iron ore clearly no lower than last year, the question is where has the excess iron ore gone? Visible port inventories according to Mysteel data are up 14mt YTD. Mill inventory data from Mysteel shows smaller mills days cover at 26 days in early December, compared to only 20 days at the end of last year. If we extrapolate the six days’ cover increase to Chinas total iron ore consumption of 1.23bn tonnes, this would imply mill inventory is up around 20mt for the year.
Pulling together all the numbers for 2016 implies that there should be around 38mt of excess iron ore supply within China this year outside of visible inventories. With the increase in domestic iron ore output over 2H16, no doubt domestic mine inventories have also risen, though we have no data to support this. However 38mt would imply around two months’ worth of total mine output this year, which seems unrealistic in our mind. Given the bulkiness of iron ore and the loss incurred in transportation, we do not imagine that there are any other trader inventories outside of port holdings which could explain the difference in supply and demand either. Hence the only remaining explanation in our view is that Chinese steel output is being underreported. The 38mt apparent excess supply would equate to just over 3% of China’s annual iron ore consumption, so the question is whether Chinese steel output is running 3% higher than we believe from the NBS data (we already use our own series on pig iron output based on Crude steel output, as we believe NBS pig iron data has been underreported for years for a variety of reasons).
Recent market speculation has centred on environmental closures of very small, scrap-fuelled induction furnaces. Estimates from Mysteel and CRU suggest that capacity of these furnaces, which are not included in NBS steel output data, may be as much as 120mt, but output last year was probably only around 60mt. So far, environmental-related closures of these furnaces have been focused in only a few cities, and probably amount to less than 10mt of lost output. Even if iron ore-based blast furnace steel production increased to offset lost output from these smaller induction furnaces, the increase should be captured in NBS steel output data and should be quite visible.
China’s iron ore imports this year look set to surpass 1.03bn tonnes, rising at least 80mt YoY. This jump comes despite the majors struggling to meet targets this year. We estimate export shipments from the four largest producers are up only 24mt in 2016. Outside of the big four producers, Roy Hill has accounted for the bulk of the increase in seaborne iron ore volumes this year, looking likely to ship near 26mt. Outside of these tonnes, we have seen an increase in seaborne iron ore shipments from higher cost producers responding to the higher prices.
Our supply/demand balance forecast is an iterative process, and we forecast the supply at a certain price level based on our estimate of costs and prices. Supply from the majors is pretty fixed, and the mid-tier also. But the supply from the smaller miners depends very much on the price. Given that we see iron ore supply currently as being more than plentiful to meet demand, we continue to expect prices to decline into a $50-60/t range next year. For 2017 we forecast a 19mt increase in supply from the big four producers, mainly coming from Vale’s new S11D project, and a further 21mt from the mid-tier producers, again mainly led by the continuing ramp-up in Roy Hill. With our Chinese steel demand forecast giving a 10mt increase in Chinese iron ore demand, and ex-China 7mt (up 2% YoY), we see a declining need for iron ore from the higher cost seaborne suppliers who have returned to the market in 2016, together with a decline in iron ore needed from domestic Chinese mines.
Based on pricing above $50/t for 2017, we expect India to see a slight increase in exports from 18mt in 2016 to 20mt in 2017, with upside risk to these volumes should the government cut the 30% export tax on high grade (62%Fe plus) exports in their 2017 budget. Outside of India, however, most other suppliers will see a slight decline in exports, with our forecast for Australian juniors exports dropping from 70mt in 2016 to 62mt in 2017 as a few mines deplete, while Iran did 15mt in 2016 but should fall to 13mt in 2017. If prices stayed at say $70/t, we believe this could incentivise at least a further 30mt from these smaller suppliers.
Pulling together our seaborne supply forecasts and Chinese demand forecasts, mean we see a need for domestic Chinese iron ore output of only 185mt in 2017, down from 220mt in 2016. As we have clearly seen in 2H16, domestic Chinese mine supply is highly price-elastic. Moreover, Chinese mine costs in US$ terms are down around 10% YoY given the recent depreciation in the RMB, and the resource tax cut seen since July 1st. Indeed, SMM estimates domestic mine costs in RMB terms in 3Q16 were between 6-10.5% lower versus a year earlier. According to SMM’s most recent domestic mine cost curve, they see 175mt of domestic iron ore output at $50/t, rising to 217mt at $55/t, and should the price be at $60/t through 2017 they forecast domestic mine supply would be 254mt.
In conclusion, we continue to struggle to see why iron ore prices should remain above $60/t for very long, given the clear elasticity in supply. While steel demand globally and within China has clearly outperformed versus our prior expectations, and the outlook into 1H17 at least remains solid, we believe there is no shortage of iron ore supply currently (outside of specific higher grade products). As coking coal prices continue to ease, the urge among steel mills to procure higher grade supply should lessen, and hence we’d expect price differentials to narrow, as well as headline 62%Fe grade iron ore prices to ease back below $60/t.
While the outlook for iron ore displacement leads us to look for more pain in FOB prices, CFR/ headline iron ore prices will be saved to some degree by higher oil prices. We thus do not expect iron ore prices to drop below $40/t CFR China even at the weakest point of the market in 2018, as our oil price expectation for 2018 is $68/barrel. That would compare to the sub $40/barrel average price seen in 4Q15 when iron ore prices bottomed at $37/t. On our rule of thumb that every $10/ barrel in oil prices moves the marginal iron ore cost curve by approximately $3/t ($2/t shipping cost from Brazil, $1/t mining cost), which means that our average $47/t price for iron ore in 2018 is essentially just as bad as the bottom pricing point reached in 4Q15 once adjusting for the oil differential.
More or less my view with the exception that my base case is Macquarie’s risk case, with Chinese property slowing in H1 2017, enough that destocking takes over the iron ore market and prices fall by mid-year to the $50 range.
From there I see it continuing to fall because I do not think oil will get that high and supply just keeps coming for iron ore anyway so to shakeout higher cost material we’ll need to revisit the thirties again, perhaps by late next year during seasonal weakness.
Further out, my view is very similar to Macquarie though I still see Chinese steel output at 600mt eventually hence iron ore in the $20s before we are done.
David Llewellyn-Smith is Chief Strategist at the MB Fund and MB Super. David is the founding publisher and editor of MacroBusiness and was the founding publisher and global economy editor of The Diplomat, the Asia Pacific's leading geo-politics and economics portal.
He is also a former gold trader and economic commentator at The Sydney Morning Herald, The Age, the ABC and Business Spectator. He is the co-author of The Great Crash of 2008 with Ross Garnaut and was the editor of the second Garnaut Climate Change Review.