The national fiscal outlook has deteriorated since the Commonwealth, state and territory governments[1] delivered their 2015–16 mid-year fiscal updates.
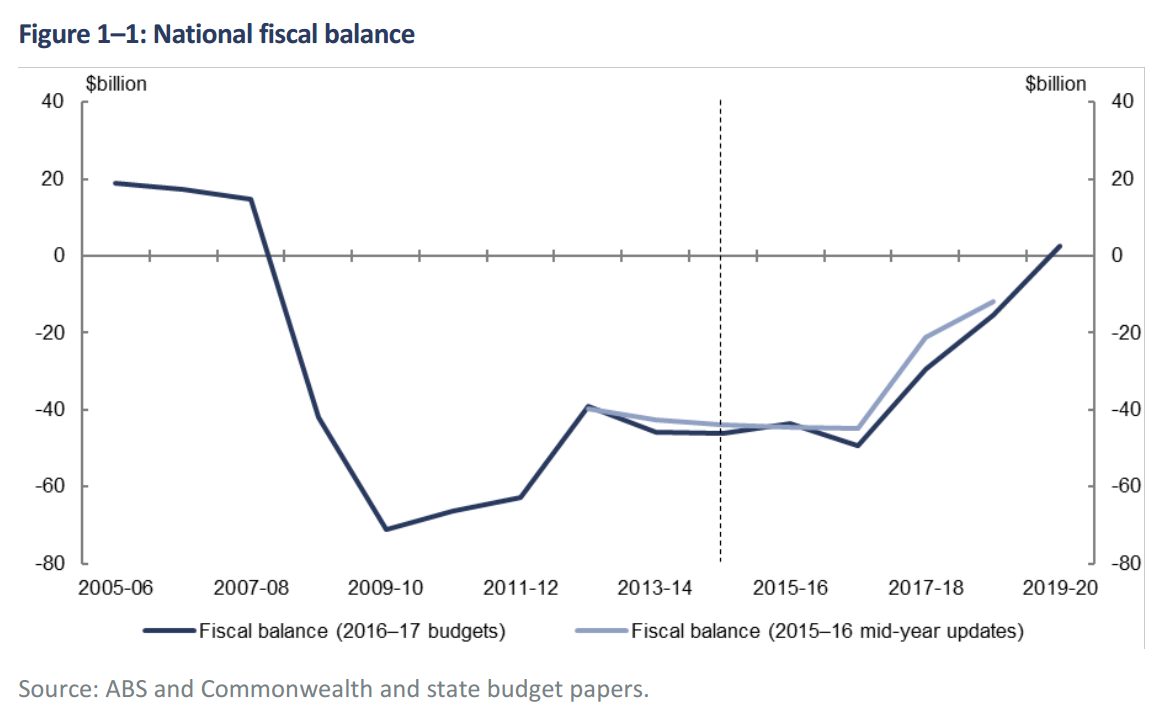
According to Commonwealth and state government 2016–17 budgets the projected national fiscal deficit from 2015–16 to 2018–19 has deteriorated by $14.9 billion (from a total of $122.3 billion at the time of the mid-year updates to $137.1 billion) (Figure 1–1).
State and territory governments are hereafter referred to as ‘states’. State figures in this chapter also include local government. Figures in this chapter have been adjusted for transfers between levels of government.
The deterioration in the projected fiscal outlook from 2015–16 to 2018–19 is due to a downward revision in projected revenue of $18.1 billion along with an upward revision in net capital investment of $2.8 billion, partially offset by a downward revision in expenses of $6.0 billion.
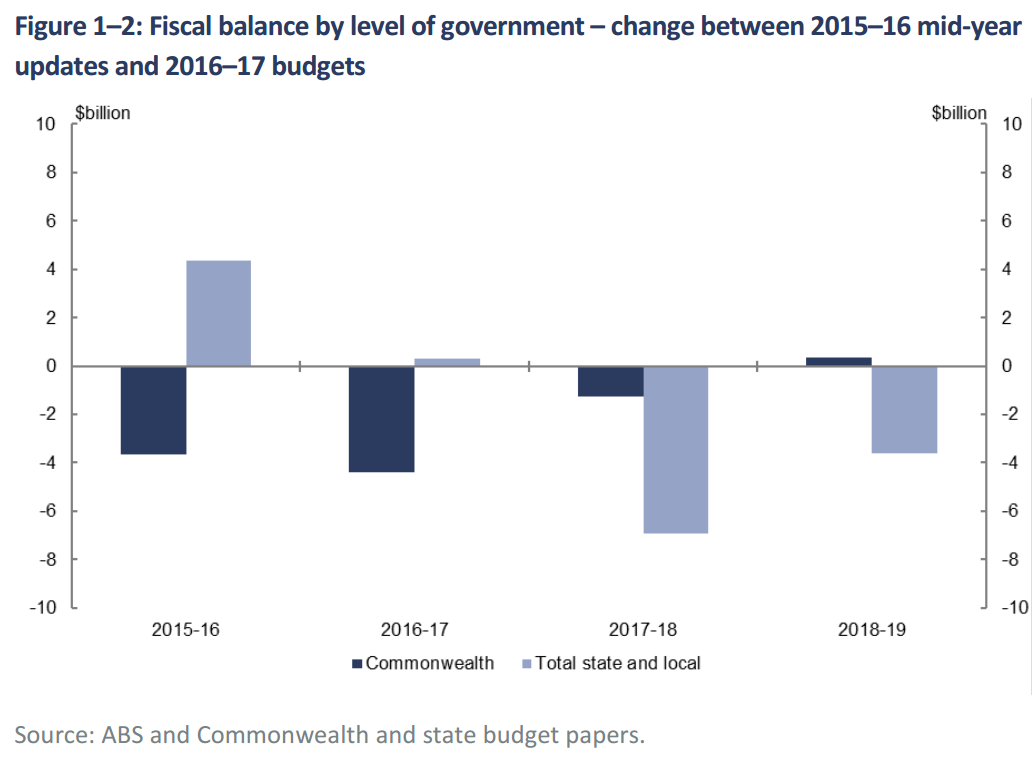
Approximately 60 per cent of the deterioration in the national fiscal balance is due to a downward revision of $8.9 billion in the projected fiscal balance of the Commonwealth (Figure 1–2). This reflects a downward revision in projected Commonwealth revenue of $16.7 billion, partially offset by downward revisions in projected expenses and net capital investment of $4.5 billion and $3.2 billion respectively.
The remaining deterioration in the national fiscal balance reflects an upward revision in projected state net capital investment of $6.0 billion and a downward revision in projected state revenue of $1.4 billion, partially offset by a downward revision in projected state expenses of $1.4 billion.
According to Commonwealth and state government 2016–17 budgets the national fiscal balance is projected to return to surplus by 2019–20, driven by the states returning to surplus in aggregate in that year.
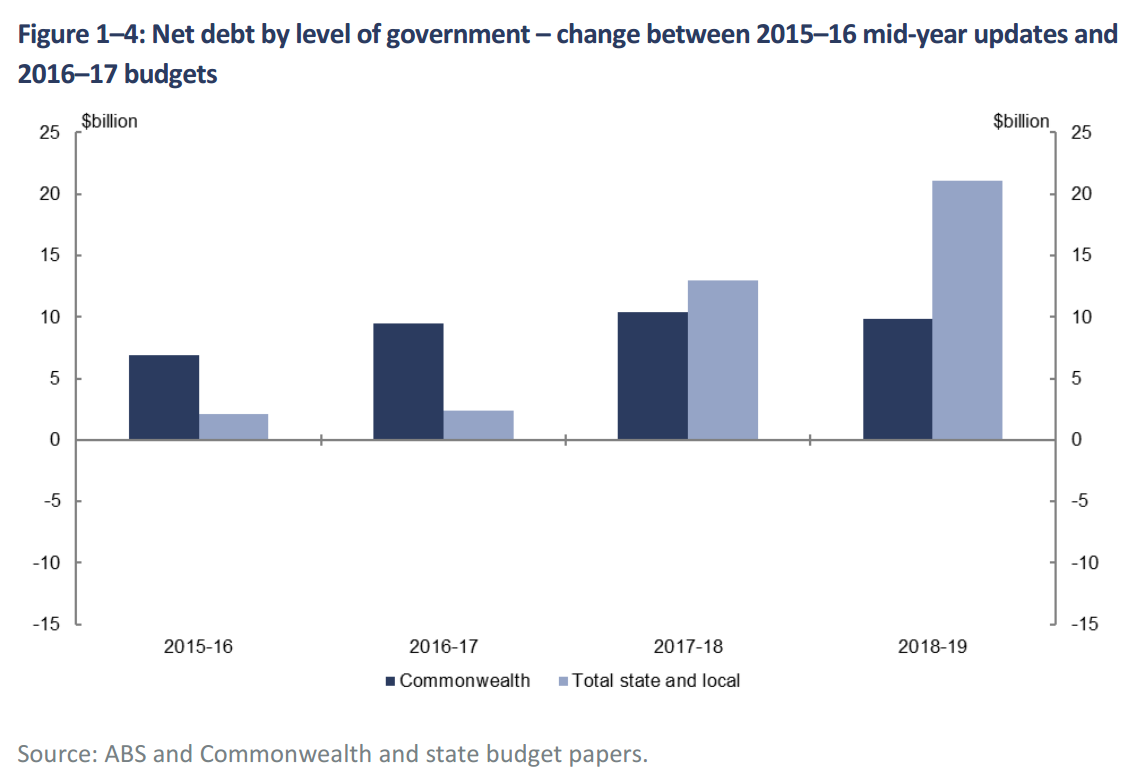
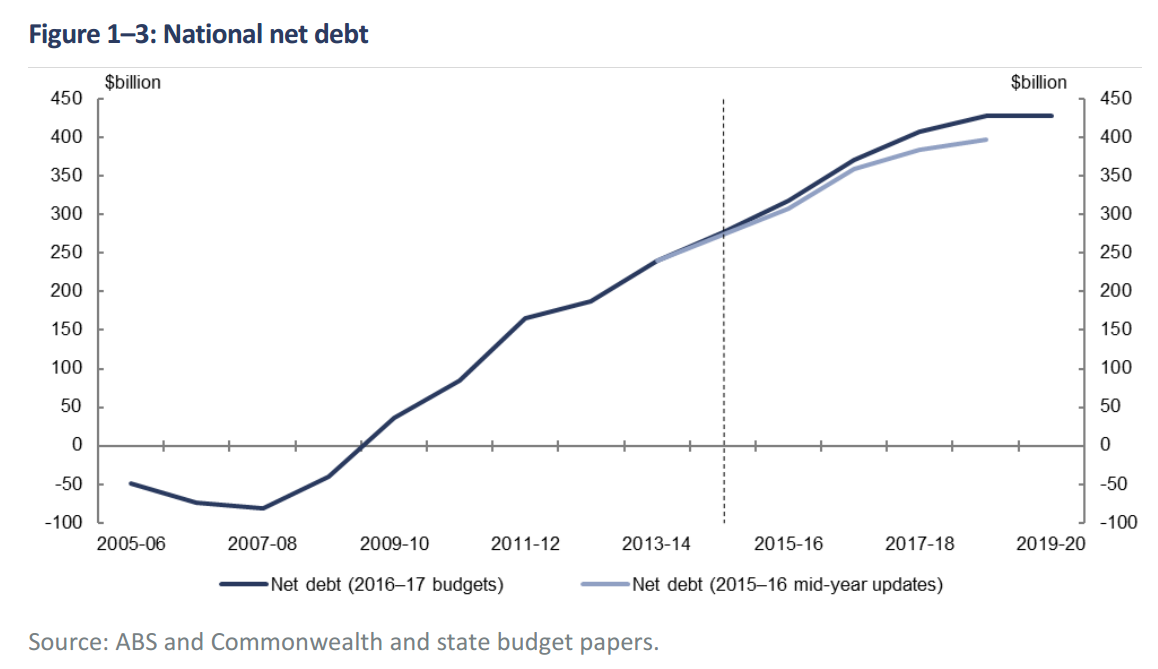
National net debt is now projected to rise to $428.5 billion (22.6 per cent of GDP) in 2018–19 compared with $397.6 billion (20.8 per cent of GDP) at the time the 2015–16 mid-year updates were delivered (Figure 1–3). National net debt is projected to plateau in 2019–20 at $428.7 billion.
The upward revision to national net debt in 2018–19 is due to the cumulative impact of higher projected Commonwealth and state fiscal deficits over the period (Figure 1–4).
We’ll see some short term Federal relief on the bulk boomlet but that’s going to be offset by the states stamp duty crash that the PBO is yet to price.
On current policy settings, that net debt number is not going to stop rising at all. We are fiscally stimulating our arses off and we are still losing.
These are the measures that the ratings agencies use to determine the sovereign rating. It is, in a word, toast.
David Llewellyn-Smith is Chief Strategist at the MB Fund and MB Super. David is the founding publisher and editor of MacroBusiness and was the founding publisher and global economy editor of The Diplomat, the Asia Pacific’s leading geo-politics and economics portal.
He is also a former gold trader and economic commentator at The Sydney Morning Herald, The Age, the ABC and Business Spectator. He is the co-author of The Great Crash of 2008 with Ross Garnaut and was the editor of the second Garnaut Climate Change Review.