
With the release of the ABS’ housing finance data for September, it is an opportune time to once again plot house prices against total finance commitments (excluding refinancings) as measured by both the ABS and CoreLogic.
Note: the ABS’ house price index is current to June, whereas CoreLogic’s is current to October.
First, below is the national picture as measured by the ABS, which shows finance approvals typically leading price growth:
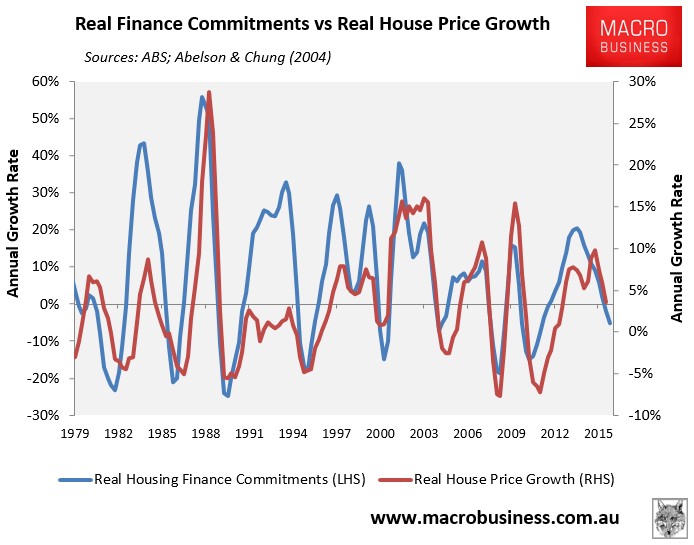
As shown above, the ABS house price series seemed to break away from finance commitments between December 2014 and September 2015, but have since fallen back into line. The latest housing finance data also suggests further weakening when September’s results are released next month.
Next is the national picture as measured by CoreLogic:
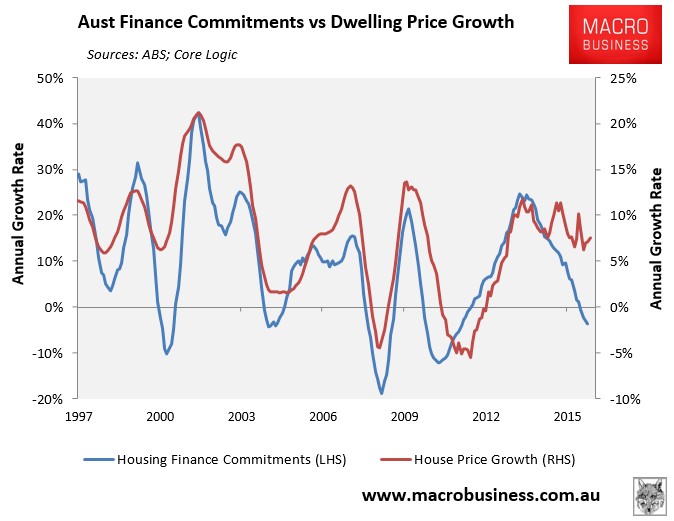
Over the past year or so, dwelling prices have held firm despite a sharp fall in the value of housing finance commitments.
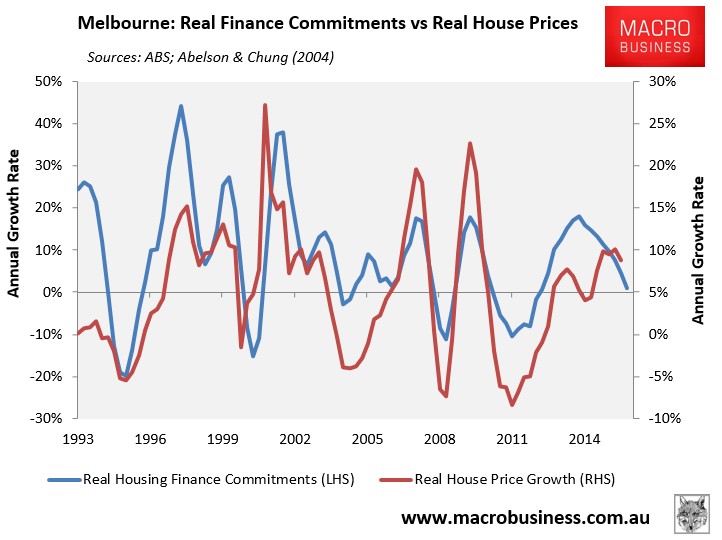
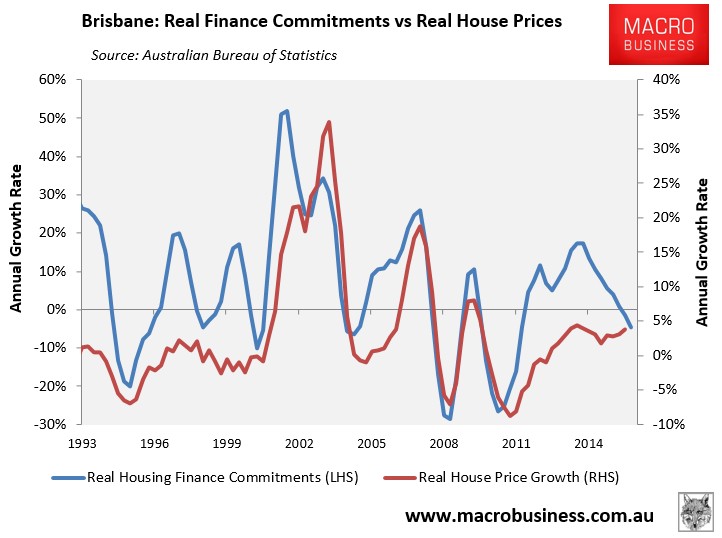
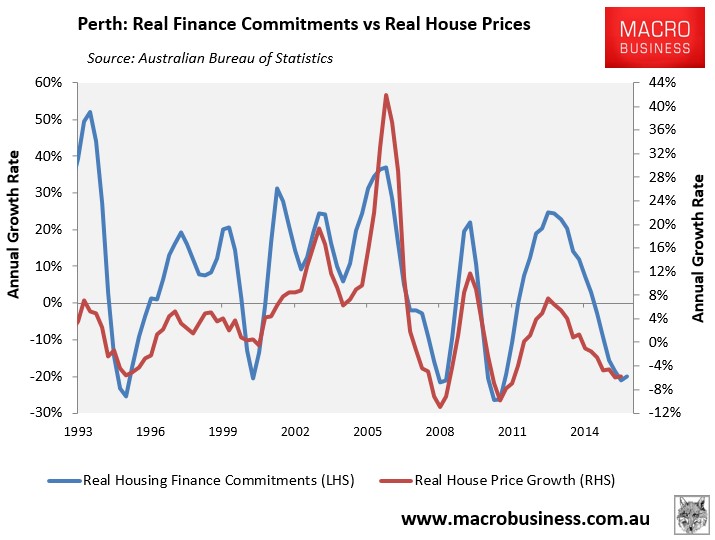
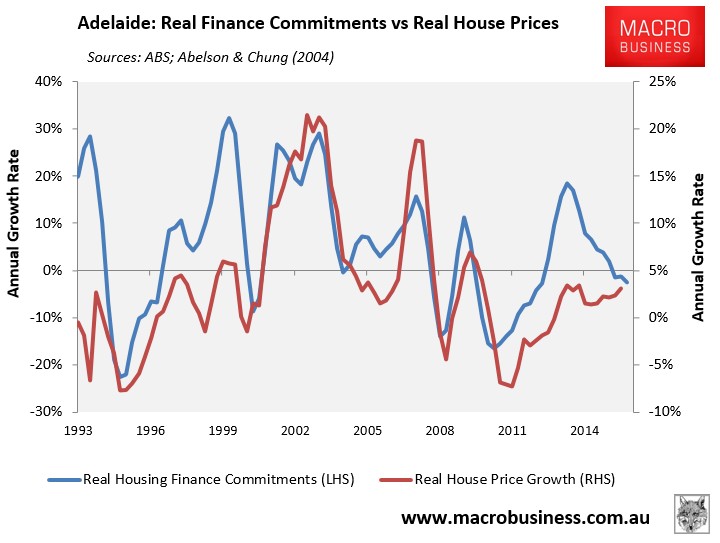
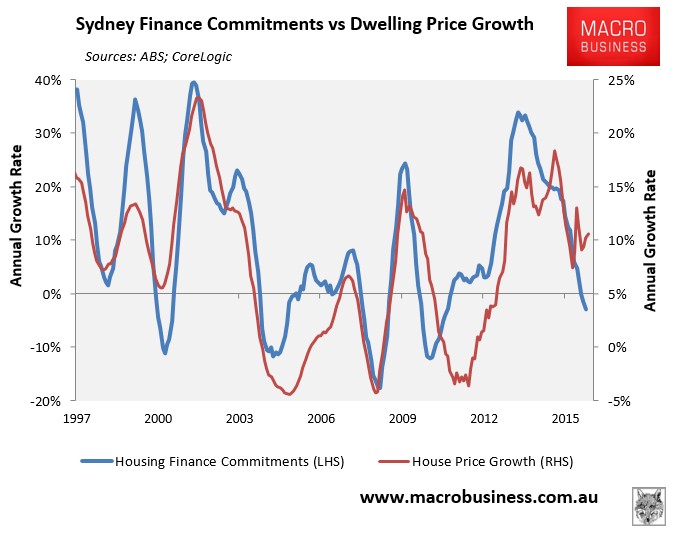
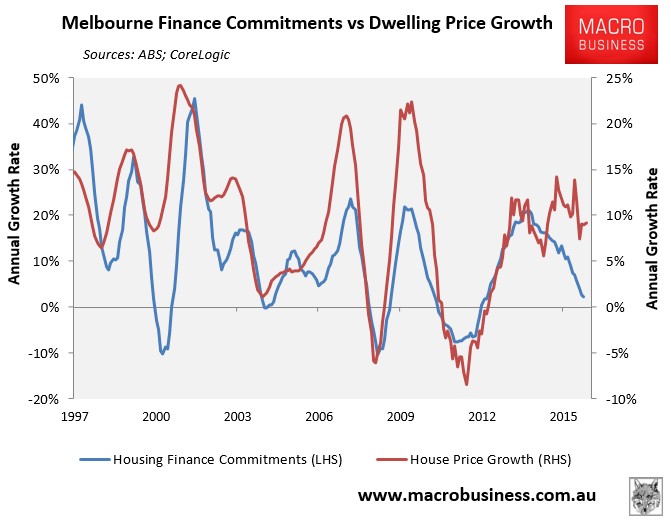
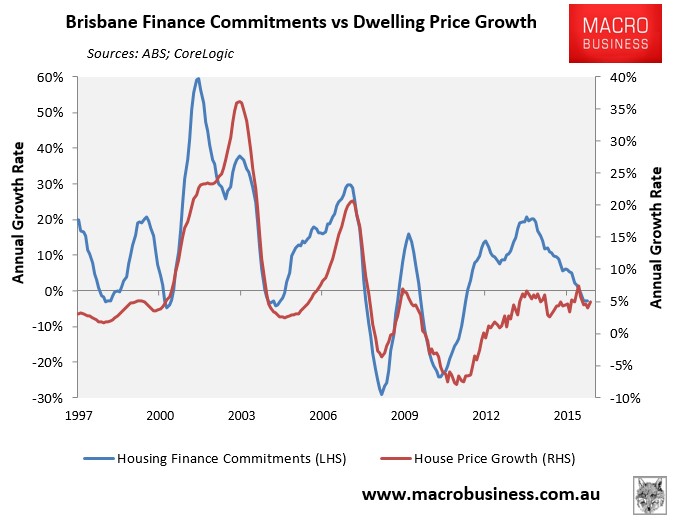
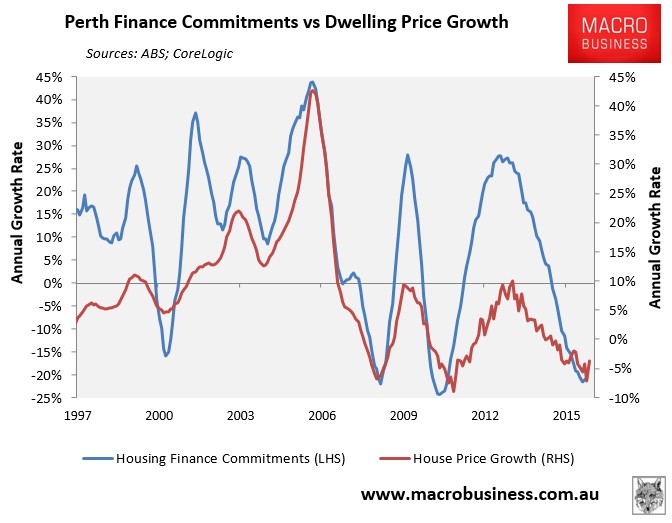
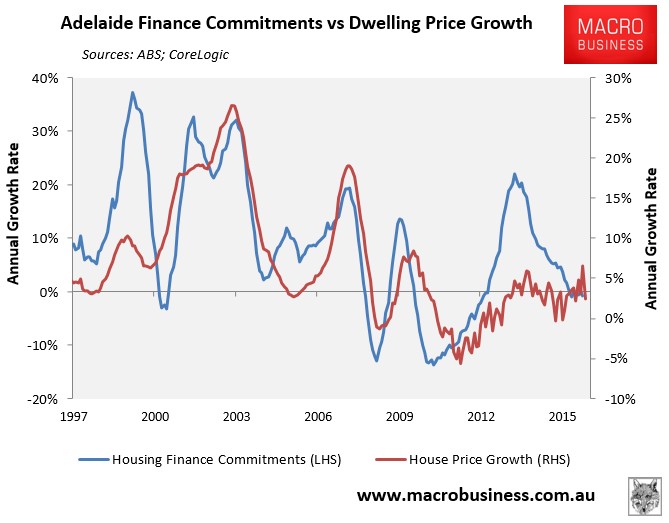
The below charts measure the relationship between housing finance and the ABS house price index across the five major capitals. Again, there has historically been a strong correlation between finance commitments and dwelling price growth; albeit with different lead/lag times:
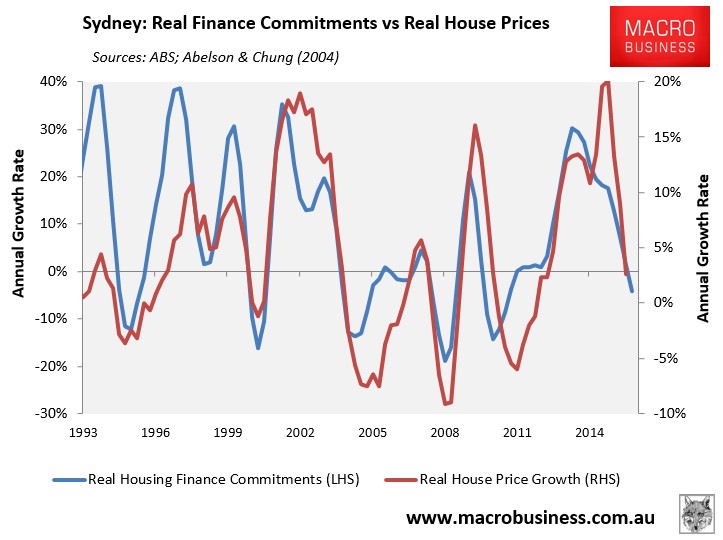
Note from the above that after diverging wildly from finance, Sydney’s house price growth has fallen back into line.
Melbourne’s prices, by contrast, appear to still be levitating, as do Brisbane’s and Adelaide’s. Whereas Perth’s prices have fallen in line with finance commitments.
Next are charts tracking housing finance across the major capitals against CoreLogic’s dwelling price indices:
Prices have ‘bucked-the-trend’ since the start of the year across each major market except Perth, levitating despite the weakening housing finance commitments.
This may be partly explained by CoreLogic’s changes to its methodology in April, which has raised question marks over the efficacy of the index (see here).
It could also be because transaction volumes may have fallen even more sharply than the value of finance commitments (i.e. fewer loans chasing even fewer properties) – see The great housing ‘shrinkflation’.
Finally, there is the potential for cash buyers, such as buyers from overseas, whom are not captured in the housing finance statistics.
Whatever the case, it remains a difficult market to read with various indicators giving conflicting signals about the strength of the market.
unconventionaleconomist@hotmail.com
