The Weekend Australian newspaper ran two big articles attempting to analyse the causes of Australia’s housing affordability woes, which mostly missed the mark.
First off the bat is The Australian’s Editorial, which made the following spurious arguments:
It’s true that big city house prices have outpaced average earnings but previous generations of first home buyers also found it hard to get into the market. Demographer Bernard Salt niggled the smashed avocado millennials to make a point: their parents and grandparents forwent consumption in order to accumulate a deposit. Nor did those more frugal folk expect their first property to be in the city’s dress circle. Many Australians bought on the city fringe, only later trading their way to the modest middle-ring.
…house prices tend to be higher in large cities compared with small population centres.
Not only has Australia always been a highly urbanised country, it has become more so. The share of the population living in the six capital cities rose from 59.2 per cent in 1961 to 64.4 per cent in 2015, with an additional 3.8 per cent in old industrial centres close to Sydney and Melbourne. Another 3.9 per cent live on the Gold Coast and Sunshine Coast…
The housing prices-to-income ratio has been rising since 1990, with some fluctuations. Where once the ratio was 2.5 — house prices were 2½ times annual average household disposable income — it is now between 4.5 and 5.5 in the capital cities.
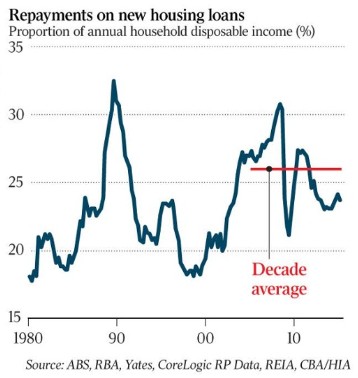
But house prices are not the only determinant of affordability — the repayments on housing loans also determine the ability of potential purchasers to afford homes. On this measure, housing is now more affordable than it was six years ago. The historically low cash rates are the primary determinant of this outcome.
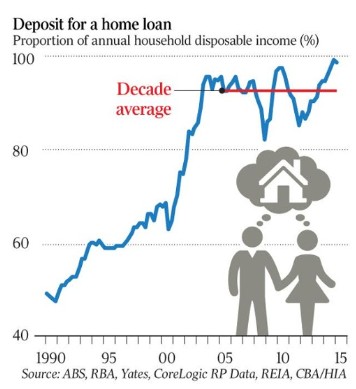
The real dilemma for aspiring homeowners is the challenge of accumulating a sufficient deposit to get into the market in the first place…
First, this whole notion that the baby boomers “forwent consumption in order to accumulate a deposit”, whereas today’s buyers are spendthrifts, has already been debunked.
Advertisement
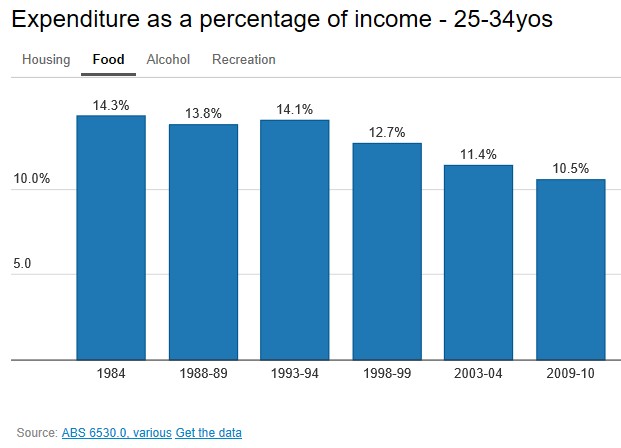
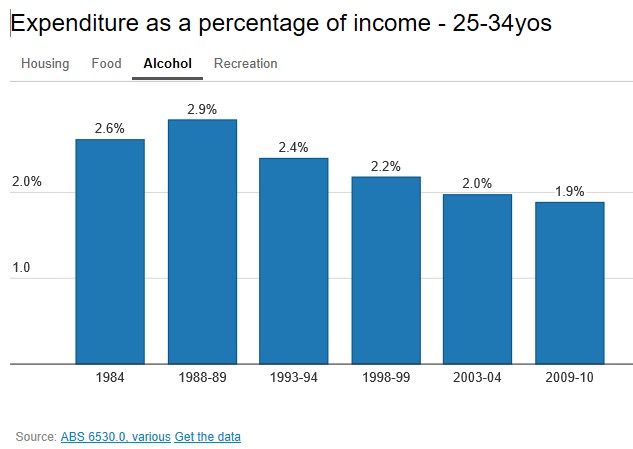
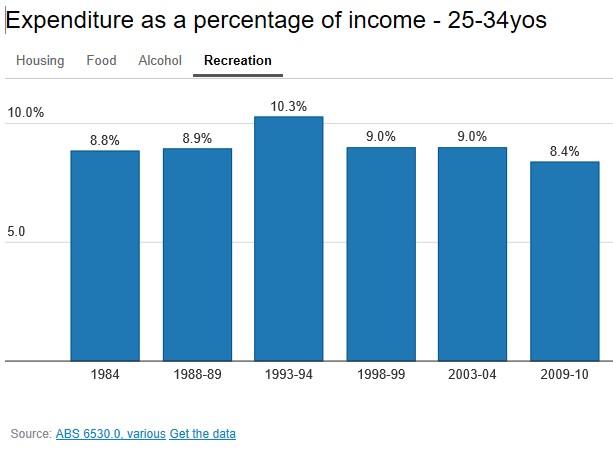
The ABS publishes survey data on household expenditure and its shows clearly that in 2010, 25-34 year olds spent less on food, alcohol, and recreation (let alone tobacco) than they did in 1984:
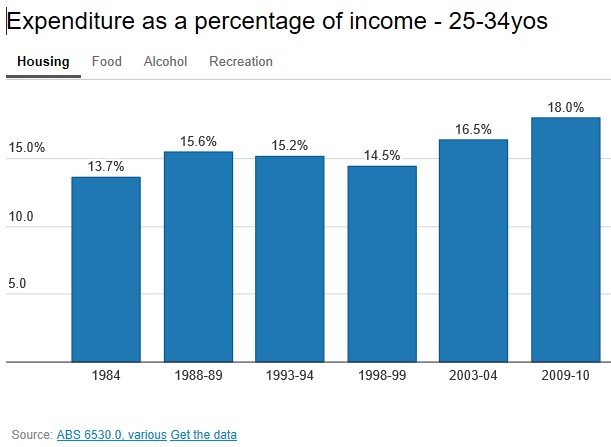
By contrast, they spent way more on housing than their baby boomer counterparts:
Advertisement
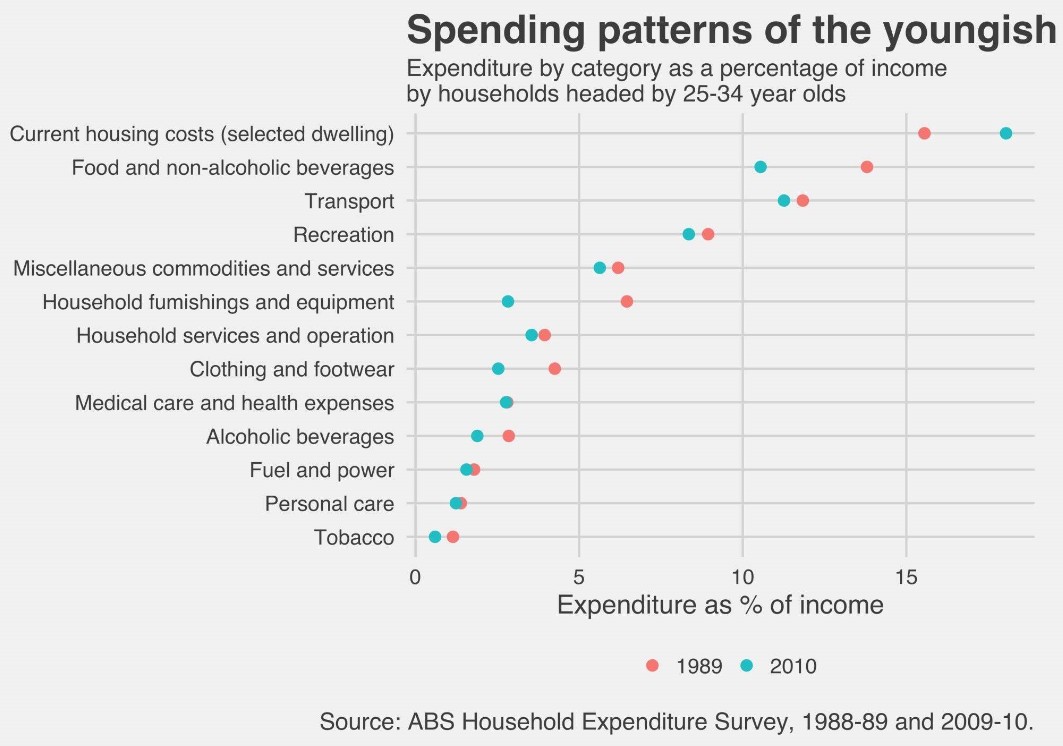
The below chart, which compares expenditure patterns back to 1989 highlights these trends more clearly and also shows that this claim is false:
Advertisement
Second, the notion that today’s young buyers cannot afford to buy because they “expect their first property to be in the city’s dress circle” and are not prepared to purchase cheap houses on the fringe, as well as the claim that housing is expensive because we live in big cities, is also easily debunked.
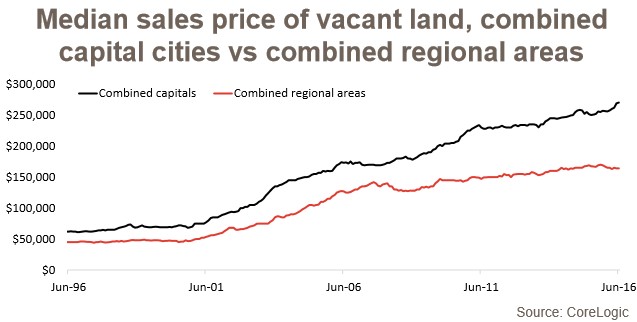
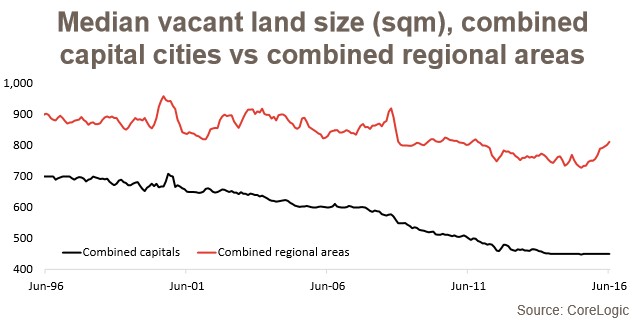
The sad truth is that house prices on the fringe of Australia’s cities have also become incredibly expensive due to the escalation of lot values (despite shrinking in size).
According to CoreLogic, the median price of a fringe housing lot across Australia’s capitals has increased from around $60,000 in 1996 to $270,000 currently:
Advertisement
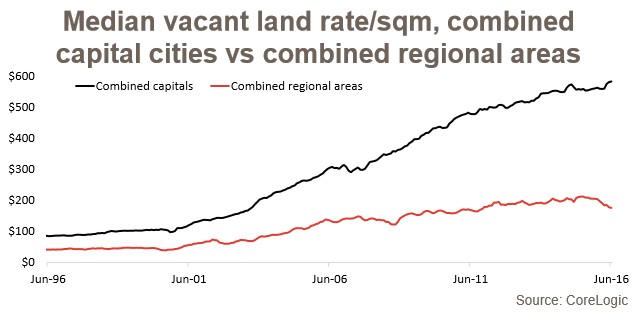
Whereas, the price per square metre of lots has experienced a more than five-fold increase over the past 20 years:
Advertisement
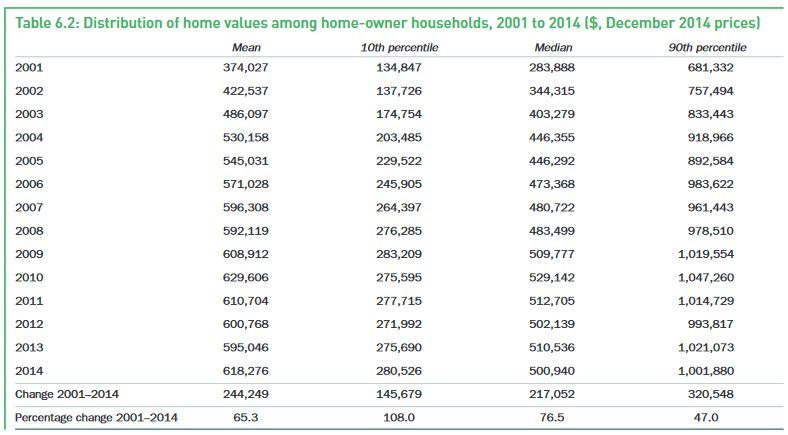
The latest HILDA survey, released in July, also revealed that entry level homes – i.e. those priced at the 10th percentile and more likely to be purchased by first time buyers – skyrocketed in value between 2001 and 2014, rising by 108% over that period, compared to 47% growth for 90th percentile properties at the top end of the market:
Advertisement
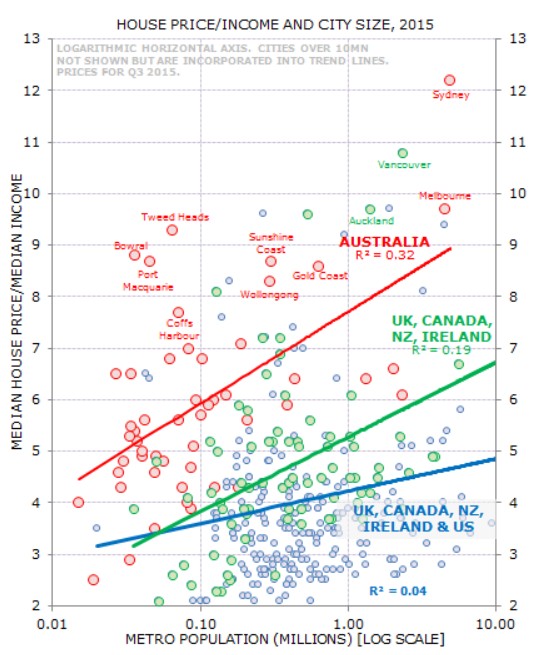
Finally, the below chart, which comes from Gerard Minack, shows median house price/median income ratios for Anglo cities:
As you can see, housing in Australia is also incredibly expensive outside the major capitals. In fact, there are no cities with less than 100,000 people where house prices are over 7 times income – aside from Australian cities.
Advertisement
The bottom line is that young people are not shut out because of their extravagant spending or tastes, but because Australian housing is systemically expensive.
Judith Sloan’s claim that “housing is now more affordable than it was six years ago” and that the “historically low cash rates are the primary determinant of this outcome”, along with the chart showing repayments at “affordable” levels, was debunked in detail last week (post now unlocked).
The inherent problem with these types of affordability measures is that they only gauge initial housing payments on new mortgages at the particular moment in time, and not repayments over the full 25 to 30 year loan term.
Advertisement
To highlight why this is nonsensical, consider the below extreme stylised example.
Scenario A (very low price, very high inflation, extreme mortgage rate):
Buyer has an annual income of $100,000.
They buy a house valued at $300,000, (assume no deposit).
The mortgage rate is 17%, which remains the same throughout the 25 year loan-term.
Inflation is very high and wages grow at 7% annually (i.e. 10% real mortgage rate).
Advertisement
Scenario B (high price, very low inflation, very low mortgage rate):
Has an annual income of $100,000.
They buy a house valued at $700,000 (assume no deposit).
The mortgage rate is 3.5%, which remains the same throughout the 25 year loan-term.
Inflation is low and wages grow at 2% annually (i.e. 1.5% real mortgage rate).
In case you haven’t noticed, Scenario A is a proxy for the late-1980s home buyer, whereas Scenario B is a proxy for today’s home buyer.
Advertisement
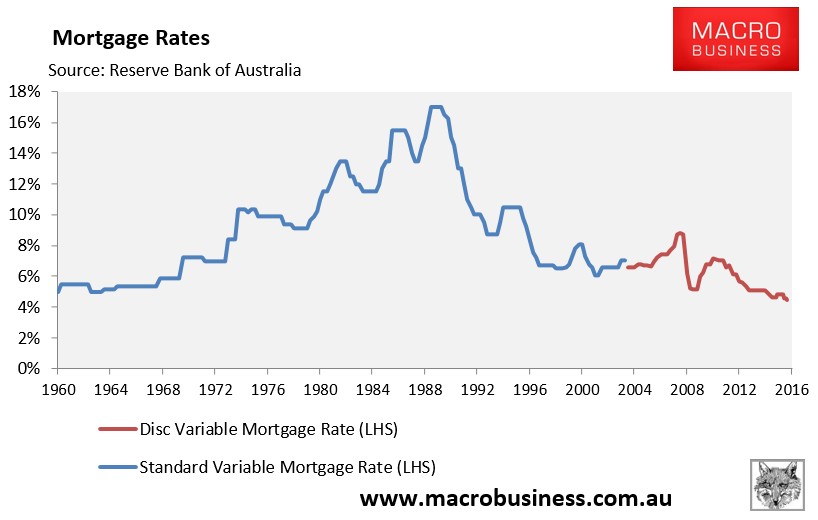
It should be noted at the outset that while mortgage rates briefly hit 17% in 1989-90, they did not stay there for long. They have also never been as low as the 3.5% assumed above (see next chart).
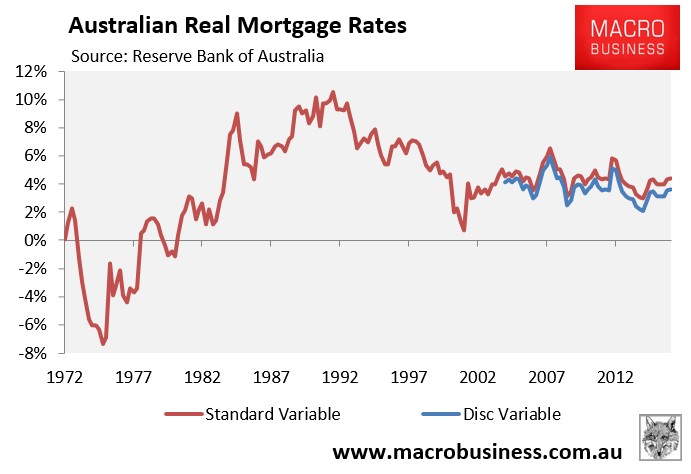
Similarly, real mortgage rates were only 10% briefly throughout the late-1980s and early 1990s (see next chart).
Advertisement
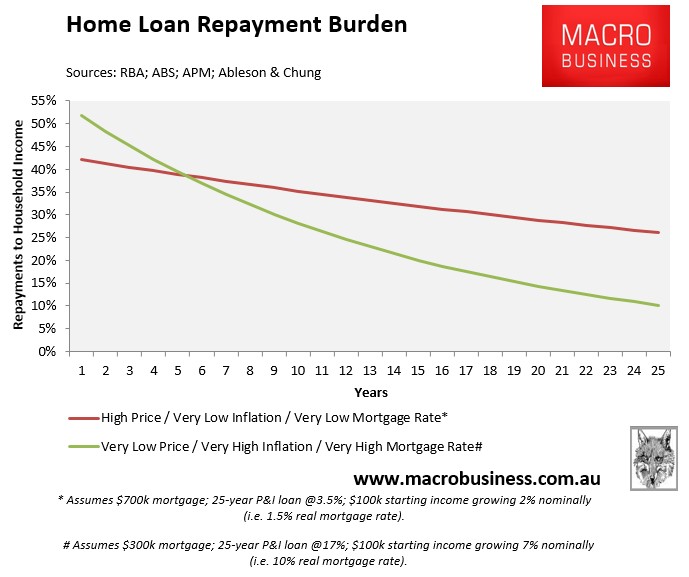
Nevertheless, even in the extreme example above, the buyer in Scenario A only pays more in mortgage repayments for the first six years (see next chart).
Advertisement
Thanks to the wonders of high nominal inflation and wages growth (and even in the face of a 10% real mortgage rate), Buyer A’s mortgage debt is inflated away quickly such that their mortgage repayments are:
28% of income after 10 years;
20% of income after 15 years;
14% of income after 20 years; and
10% of income in the final year.
Buyer B is not nearly as lucky, since their repayment burden remains high in the face of low inflation and wages growth, even though they face a ridiculously low real mortgage rate of just 1.5%. Buyer B’s mortgage repayments are:
Advertisement
35% of income after 10 years;
32% of income after 15 years;
29% of income after 20 years; and
26% of income in the final year.
Therefore, low inflation and low nominal wages growth – as exists currently – means that a huge mortgage taken-out today will remain a big mortgage for decades to come.
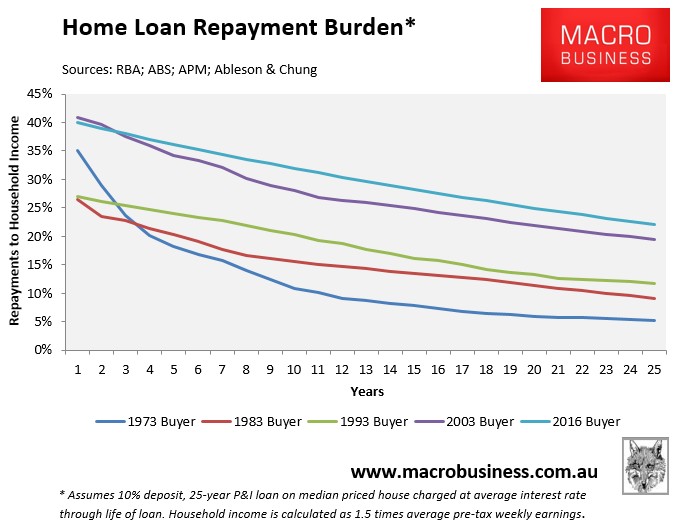
Coincidentally, today’s home buyer also faces the worst mortgage repayment burden in recorded history (again, see last week’s post for specifics):
Advertisement
To Judith Sloan’s credit, she did at least highlight the lunacy of Australia’s high immigration program, which is making housing more expensive for young home buyers:
The one thing that the commonwealth could consider is a reduction in the permanent immigration intake, which is set each year and is currently 190,000. If we look at the contribution net immigration is making to population growth, we see it has been contributing at least as much as natural increase. There is a strong case for reducing the annual permanent immigrant intake to around 100,000.
Even with the most flexible housing market in the world, it is simply not possible to accommodate the recent flow of new immigrants without pushing up house prices. And note also the lags in the construction of the required associated infrastructure — transport, roads, schools, hospitals and the like.
Advertisement
But overall, The Australian, like so many others, failed to diagnose the housing affordability issue properly.
Leith van Onselen is Chief Economist at the MB Fund and MB Super. He is also a co-founder of MacroBusiness.
Leith has previously worked at the Australian Treasury, Victorian Treasury and Goldman Sachs.