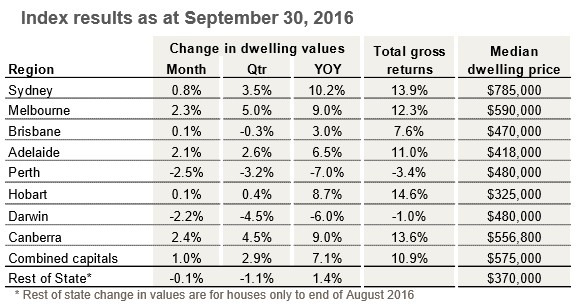
Following on from Friday’s post on CoreLogic’s daily dwelling values index results for September, CoreLogic has released its full results, which also cover the smaller capitals and regional areas (see next table).
As shown above, the smaller capitals and the regions had a mixed month in September, with Canberra (+2.4%) and Hobart (+0.1%) recording value rises, but Darwin (-2.2%) and Rest of State (-0.1%) recording falls.
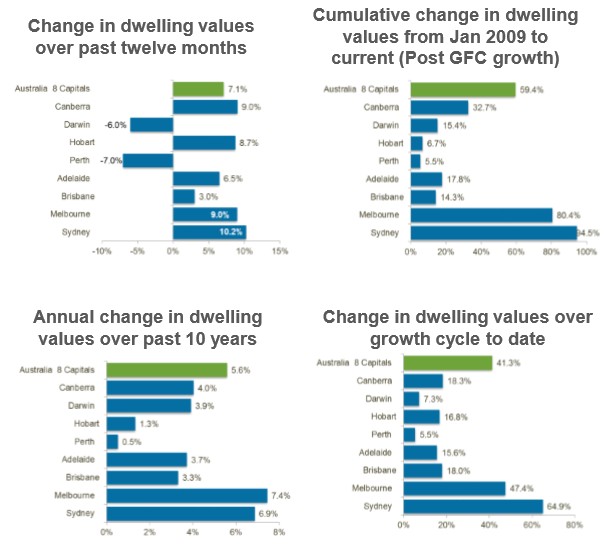
Below are the key charts summarising the situation across the markets, with Sydney and Melbourne dominating:
Advertisement
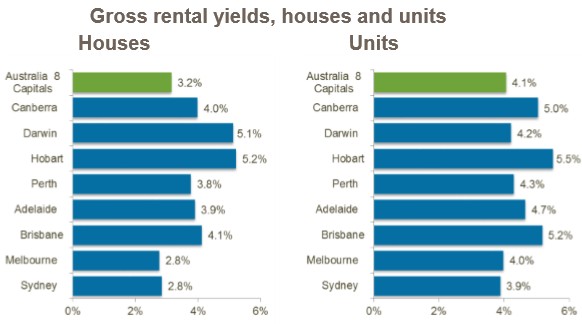
The combination of falling rents and strong capital appreciation continues to compress rental yields, which have held firm at record low levels:
Advertisement
According to Tim Lawless:
“While we’ve seen values remain relatively strong, in contrast, rental yields have been in the doldrums due to the fact that residential property values are rising at a faster rate than weekly rents. The average gross rental yield across the combined capital city dwelling market has held firm at 3.3% over the month, which is at an historic low,” he said.
By a large margin, the lowest yields are now in Sydney and Melbourne where value growth has been the most extreme and caused yields to compress. The typical gross yield on a Sydney and Melbourne house is now 2.8%, while the gross yield profile for a Sydney unit is the lowest of any capital city, averaging 3.9%.
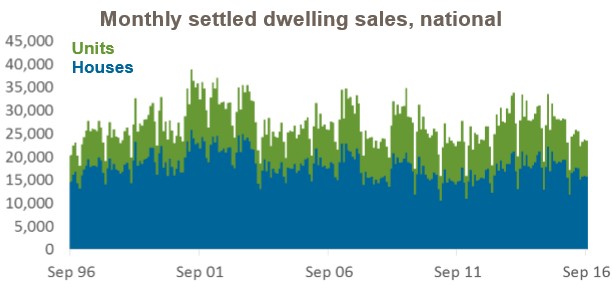
Meanwhile, transaction volumes continue to weaken:
CoreLogic estimates show settled transaction numbers have levelled over the most recent three months, however, at just under 110,000 settled transactions, sale numbers are down 5.3% compared with the June quarter and are 15.0% lower than the September quarter last year.
Mr Lawless said, “At face value, the lower transaction numbers suggest a slowdown in housing demand, however the reasons for fewer dwelling sales are likely to differ from region-to-region.”
In markets such as Sydney and Melbourne where dwelling values are still showing strong growth despite lower volumes, lower transaction numbers are partially due to low advertised stock levels. There are fewer than 20,000 dwellings currently being advertised for sale across Sydney, which is less than half the number of homes that were listed for sale five years ago. Mr Lawless said, “Reduced stock levels create urgency in the market, adding to the upwards pressure on dwelling values.”
“Conversely, in markets like Perth and Darwin, where dwelling values have been falling consistently, the slowdown in transaction numbers is related to demand, which is evidenced by the higher number of homes available for sale, as well as the sharp slowdown in migration rates. With advertised stock levels close to record highs in Perth and Darwin, buyers now have a lot more choice when selecting a property and can negotiate hard on price,” he said.
Perth and Darwin have consistently been recording the highest vendor discounting rates at just over 8% on average, as well as the longest average selling time at 75 and 84 days on average.
As the spring selling season progresses, CoreLogic is now seeing a rise in newly advertised listing numbers, however, there are fewer newly advertised properties entering the market compared with a year ago across the combined capital cities. Mr Lawless said, “The weaker new listing trend is mostly attributable to the Sydney market, where newly advertised listings are 18% lower than the same time last year.”
“Interestingly, real estate agent activity across CoreLogic platforms, as measured by the CoreLogic listings index, has been tracking higher than a year ago, despite the lower amount of fresh stock being added to the market. Increased levels of agent activity translating into fewer new listings indicates a heighted level of competition amongst real estate agents for listings. Sellers may also be nervous about selling in a strong market, especially with the consequential challenges of buying well in that same market.”
According to Mr Lawless another factor affecting transaction counts is the level of undercounting due to the record-high number of off-the-plan sales yet to reach settlement. As off-the-plan units move through their settlement phase, transaction numbers will revise higher. Recent data from the NSW Office of State Revenue showed that off-the-plan dwelling sales comprised a record high 17.3% of all residential stamp duty transactions across the state in August 2016.
Leith van Onselen is Chief Economist at the MB Fund and MB Super. He is also a co-founder of MacroBusiness.
Leith has previously worked at the Australian Treasury, Victorian Treasury and Goldman Sachs.