“Notwithstanding the recent spike in metallurgical coal prices, most would agree that the heady years of widespread price gains and investment surges are behind us, and we have returned to circumstances more closely resembling the long-run experience of mining in Australia,” he said.
This was backed by Mike Henry, BHP Billiton’s president of operations for iron ore and coal in Australia. “Not a chance,” he told The Australian Financial Review when asked if the price increase was sustainable.
Mr Henry said when prices fell in recent years, suppliers in Australia, the United States and elsewhere cut pack production. The return of high prices meant “supply comes back into the market” and prices would fall.
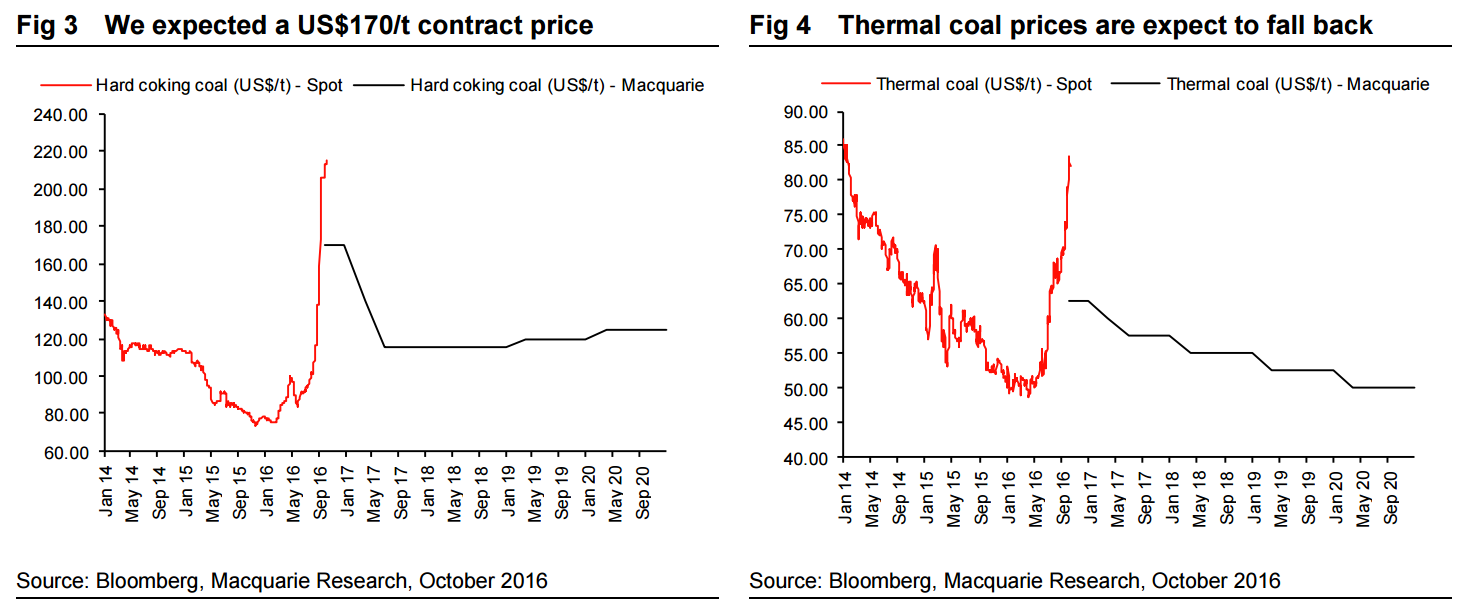
Macquarie thinks both thermal and coking coal will retrace:
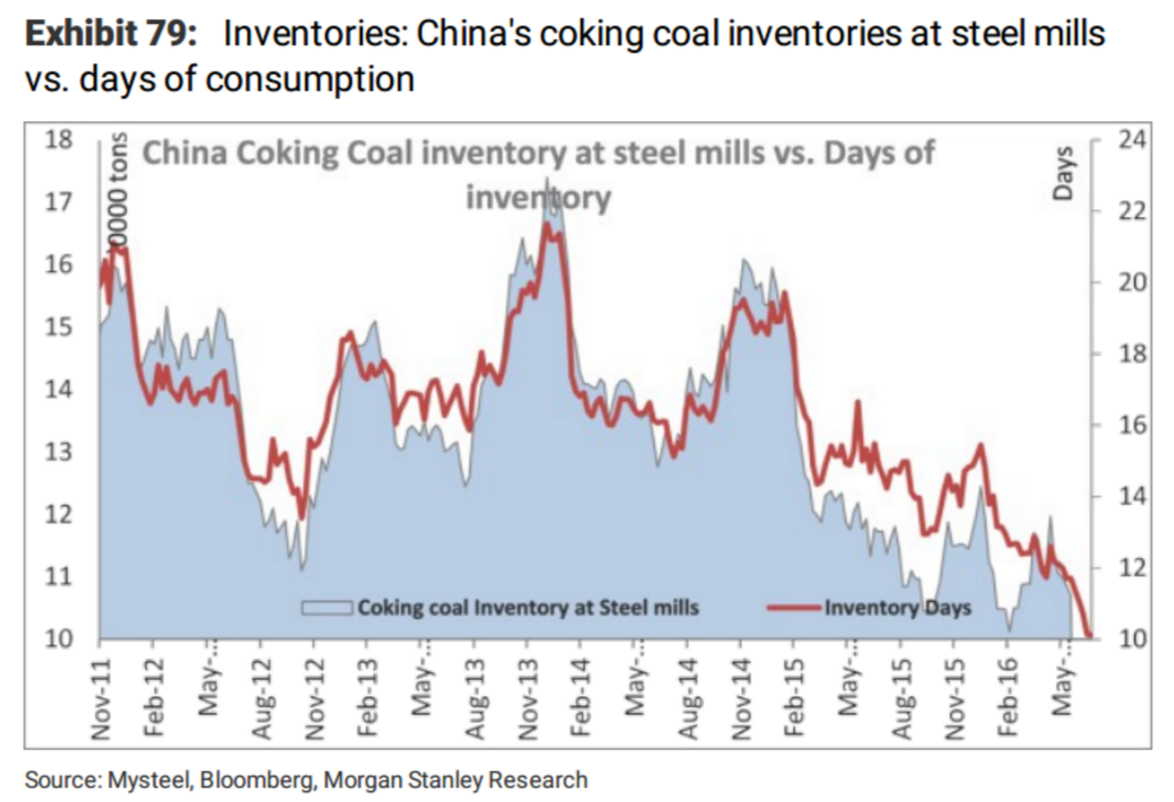
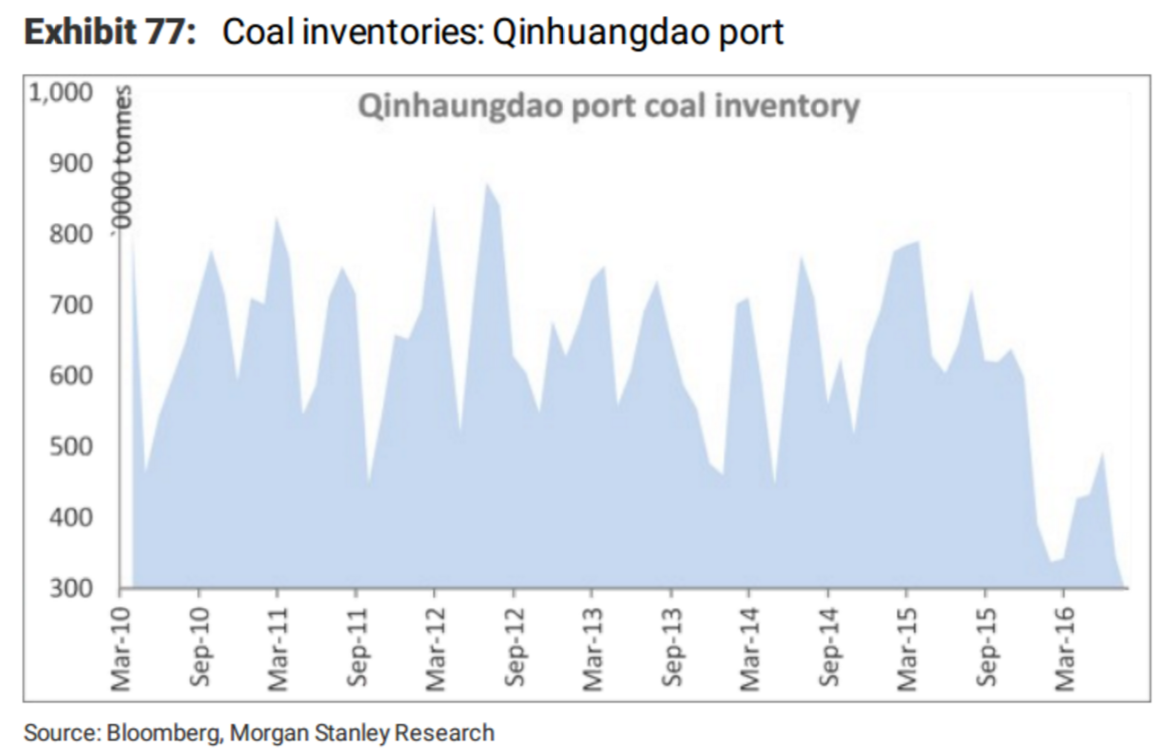
So do I. The key to the rallies short term is the Chinese policy to restrict output which took out nearly 300mt of demand but has already been partially reversed. Second, Chinese inventories had fallen to historic lows, from Morgan Stanley:
Advertisement
The current price spike is a restocking pulse and when it passes so will the big price rises. I expect thermal coal to peak in Q4 and coking in Q1 (though possibly earlier).
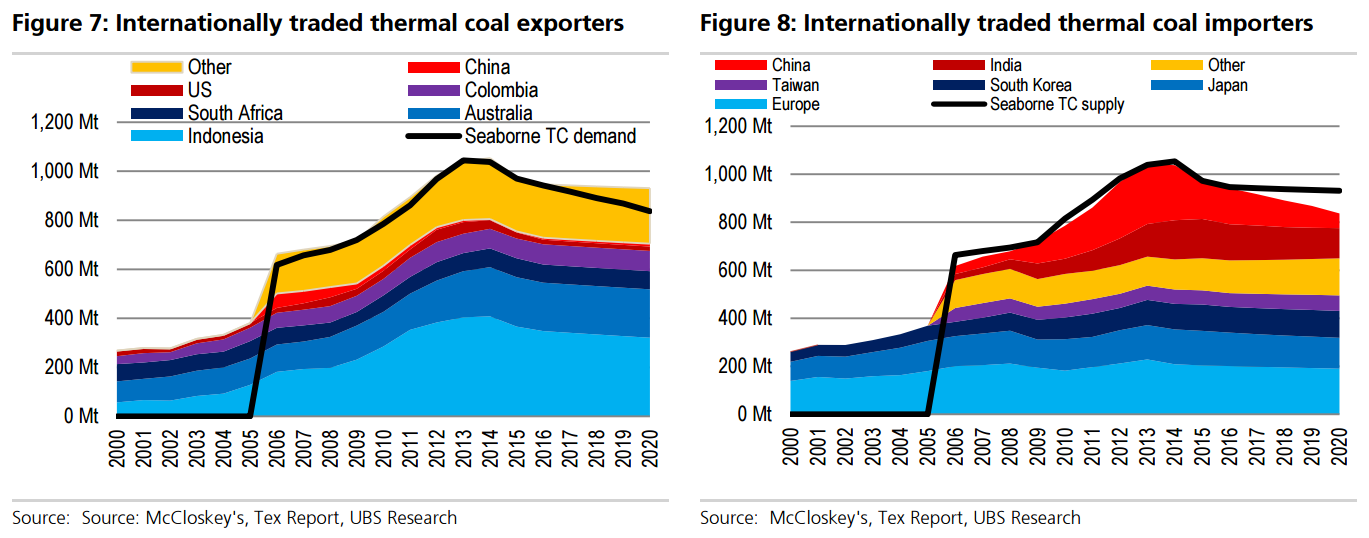
Beyond the immediate panic to replenish supplies neither coal has a great outlook. Thermal is in structural decline along with carbon-intensive power, from UBS:
Advertisement
Asia is the largest market for seaborne thermal coal demand, comprising 74% in 2015. The growth in demand from China and India are the main catalysts in increasing demand from this region in the last decade.
Within Asia, India, at ~160Mt or 23% of total Asian consumption in 2015, is the largest consumer of seaborne thermal coal followed by China (20%), Japan (20%) and South Korea (15%). However, earlier this year China announced plans to eliminate ~500Mt of annual output over the next 3-5 years as part of a shift towards clean, renewable energy sources. Additionally, China’s power demand growth has slowed in recent years, from annualised growth typically 10%-15% on average, towards low single digit growth. Consequently, we believe seaborne thermal coal demand in China will decline at a CAGR of -3.5% over 2015-2020. Global demand peaked in 2014 at ~1,000Mt but has been steadily decreasing. We expect this to continue, reaching ~800Mt in 2020.
And supply is also excessive:
Indonesia supplied almost 38% of total seaborne thermal coal in 2015 at 366Mt, the world’s largest supplier of international traded thermal coal. They are followed by Australia (21%), Russia (14%) and Colombia and South Africa (8%). We can see in Figure 7 there is a significant increase in supply from Indonesia and Australia from 2005-2015e.
The coal sector has had overcapacity for a long time, but is undersupplied in the short term. The Chinese government reduced the operating days for Chinese coal companies to 276 days from the previous 330 days in Apr-16, implying a 16.3% decline. The 276-day production rule is aimed at the thermal coal sector, which is integrated into multiple industries. The government recently relaxed the 276-day rule several times, targeting a short term increase in output of ~1mt/d, or ~365mtpa on an annualised basis, to alleviate short run coal shortages ahead of peak power and heating demand in China’s winter. Coal demand in China YTD has declined by less than 5%, but production has declined 10%. Supply demand dynamics remain favourable to support prices for now.
…Seaborne thermal coal trade has been falling since 2014, led by China’s retreat and India’s push to replace imports with domestic coal. More recently, a better Chinese import to domestic price arbitrage, better power demand, and supply cuts have seen China’s imports lift. The key determinants as to how and when the government will relax the 276 day policy is around 1) outright thermal coal shortages, and 2) the ongoing financial viability of most of China’s huge coal mining sector. Within China, power demand is also expected to grow less than GDP and coal demand is expected to grow less than power demand to 2020. We expect margin pressure (and supply cuts) will be needed from next year as the market heads into structural surpluses thanks to weaker Chinese power and coal demand.
For coking coal the outlook is better given its geographic concentration:
Advertisement
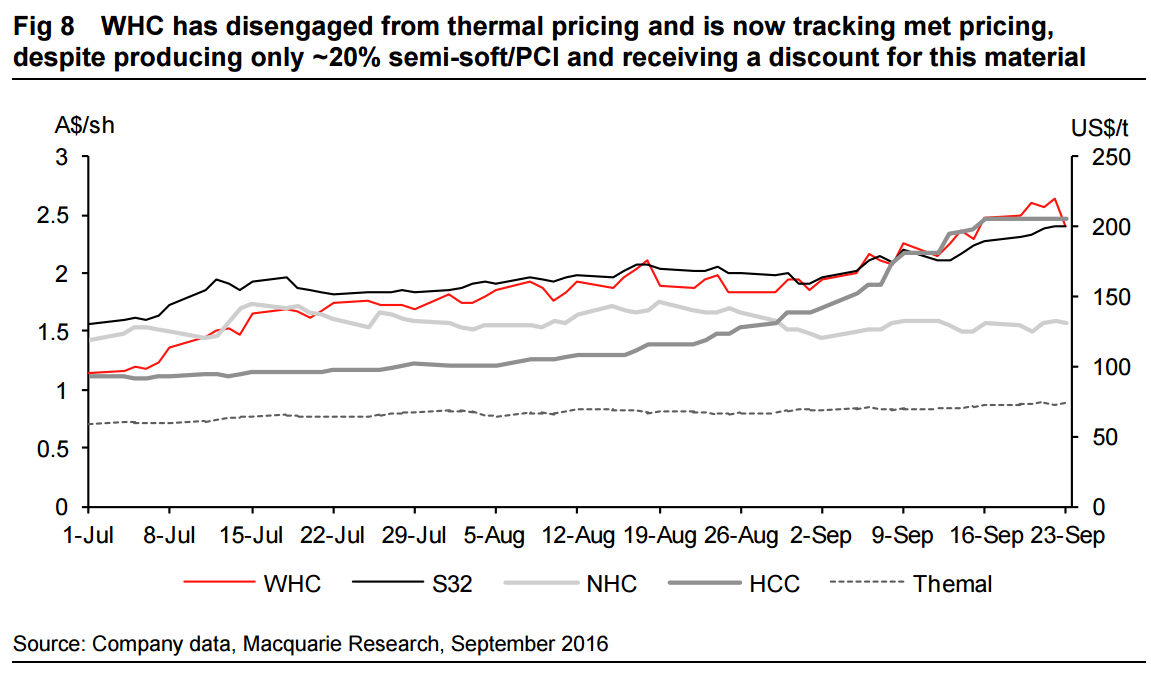
With spot metallurgical coal trading ~US$210/t, we have seen an astonishing 123% rise from US$92.5/t on July 1. Over the past month alone, spot HCC prices are up 91% or $100/t, with a YTD gain to a whopping 171%. This price spike is proportionally larger than that seen during the Queensland floods of 2011.
This rise has unequivocally been due to the Chinese policy decision regarding 276 operating days, rather than any real change in demand. Nonetheless, in spite of the Chinese Iron and Steel Association (CISA) imploring the NDRC for action at the emergency meeting last Friday, it seems like nothing will stop its inexorable rise.
However, unlike thermal coal, where the seaborne price has simply tracked Chinese domestic higher, the seaborne met coal price rally has overshot Chinese prices. There is simply very little seaborne supply flex and the structural demand picture is underwhelming but not terrible, both features thermal coal doesn’t have.
From the traders interviewed in our proprietary survey, the average price forecast for Q4 settlement was $180/t. Unsurprisingly, those interviewed before the NDRC meeting were guiding towards $170/t, with those interviewed after were guiding towards $190/t. For CY17, our surveyed traders are forecasting US$150/t (Macq US$121/t).
Over the long term I expect Chinese steel output to fall much further than today (down to 600mt) and for scrap to rise as well thus I see considerable declines ahead in coking coal demand. In the near term the Chinese easing of restrictions, easing of QLD rains and the return of US supply will slowly eat away at the boomlet with a return to $120 or below by Q2.
I don’t follow coal miners closely enough to say whether there are big shorts here but here’s Macquarie:
Advertisement
A potential free cash flow boost to BHP
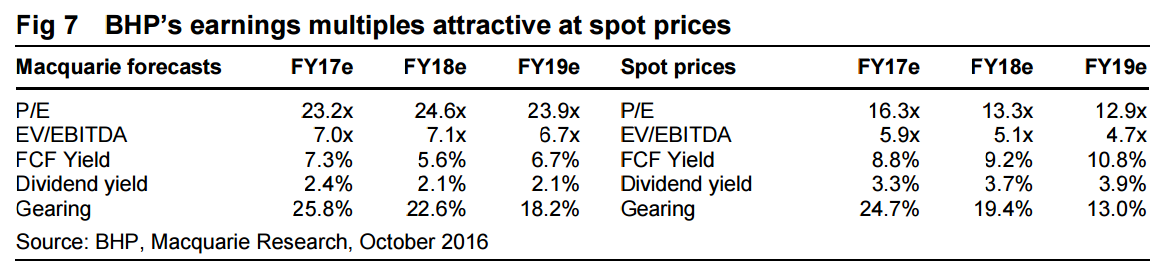
We currently forecast BHP to generate US$6.6bn of free cash flow in FY17. Using the US$200/t for the 2QFY17 adds ~US$170m in free cash flow and a US$200/t for the remainder of FY17 would lift free cash flow by ~US$700m, 10% higher than our current forecast. We note that running spot prices in FY18 translates to attractive earnings and cash flow multiples for BHP.
Using a US$200/t average price for the 2QFY17 would boost S32 free cash flow by US$40m, while running the price for the remainder of FY17 adds US$170m, an increase of 15% on our base case forecasts. We note that using spot prices of all of S32’s commodities for FY17 translates to ~40% higher free cash flow than our forecasts. Running spot prices into FY18 delivers further improvements in S32’s earnings multiples and an impressive free cash flow yield of 18%.
Assuming WHC’s semi-soft/PCI product gets the same price as Peabody’s recent US$133/t contract settlement and keeping it flat for FY17 and thermal coal prices of US$80/t and US$70/t, WHC could become debt-free by September 2016 and January 2018, respectively.
For WHC, the year ahead is one of de-gearing. The company already stated at the FY16 results that in July alone they paid off more debt than in the entirety of FY16.
To test the impact on WHC’s FCF generation, if we assume no change in currency, for each US$1/t increase in thermal coal prices above our Commodity teams’ forecast, we see a ~A$16m increase in FCF in FY17.
If we do the same test on semi-soft production, we see merely ~A$3m increase in FCF for FY17. However, it is in the potential magnitude of the movement in semi-soft prices that could drive a substantial increase in FCF. Q4FY16 semi-soft pricing was ~US$70/t, but current market sentiment could mean pricing of US$133/t, an almost 90% increase.
The impact of these prices on coal producers has been disproportionate. WHC produces 80% thermal coal and only 20% semi-soft/PCI material that typically trades at a 10% discount to already discounted semi-soft price, but has had a share price rally of 126%. Conversely, S32 with ~24% and 11% of EBITDA from coking coal and thermal coal respectively, and with material that actually receives the benchmark price for HCC, has rallied only 56%. Despite this, we note that there remains material upside risk to our improved base case forecasts for the bulk commodity producers using spot prices. Using spot prices drives a 20% higher valuation for BHP and nearly 50% higher for S32. For NHC our spot valuation is 33% higher than our base case while for WHC the upside to our spot valuation is over three times our current base case.
David Llewellyn-Smith is Chief Strategist at the MB Fund and MB Super. David is the founding publisher and editor of MacroBusiness and was the founding publisher and global economy editor of The Diplomat, the Asia Pacific's leading geo-politics and economics portal.
He is also a former gold trader and economic commentator at The Sydney Morning Herald, The Age, the ABC and Business Spectator. He is the co-author of The Great Crash of 2008 with Ross Garnaut and was the editor of the second Garnaut Climate Change Review.