
Advertisement
Iron ore price charts for September 8, 2016:
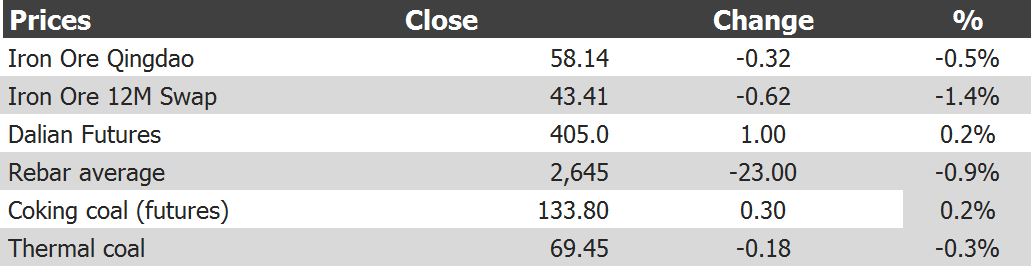
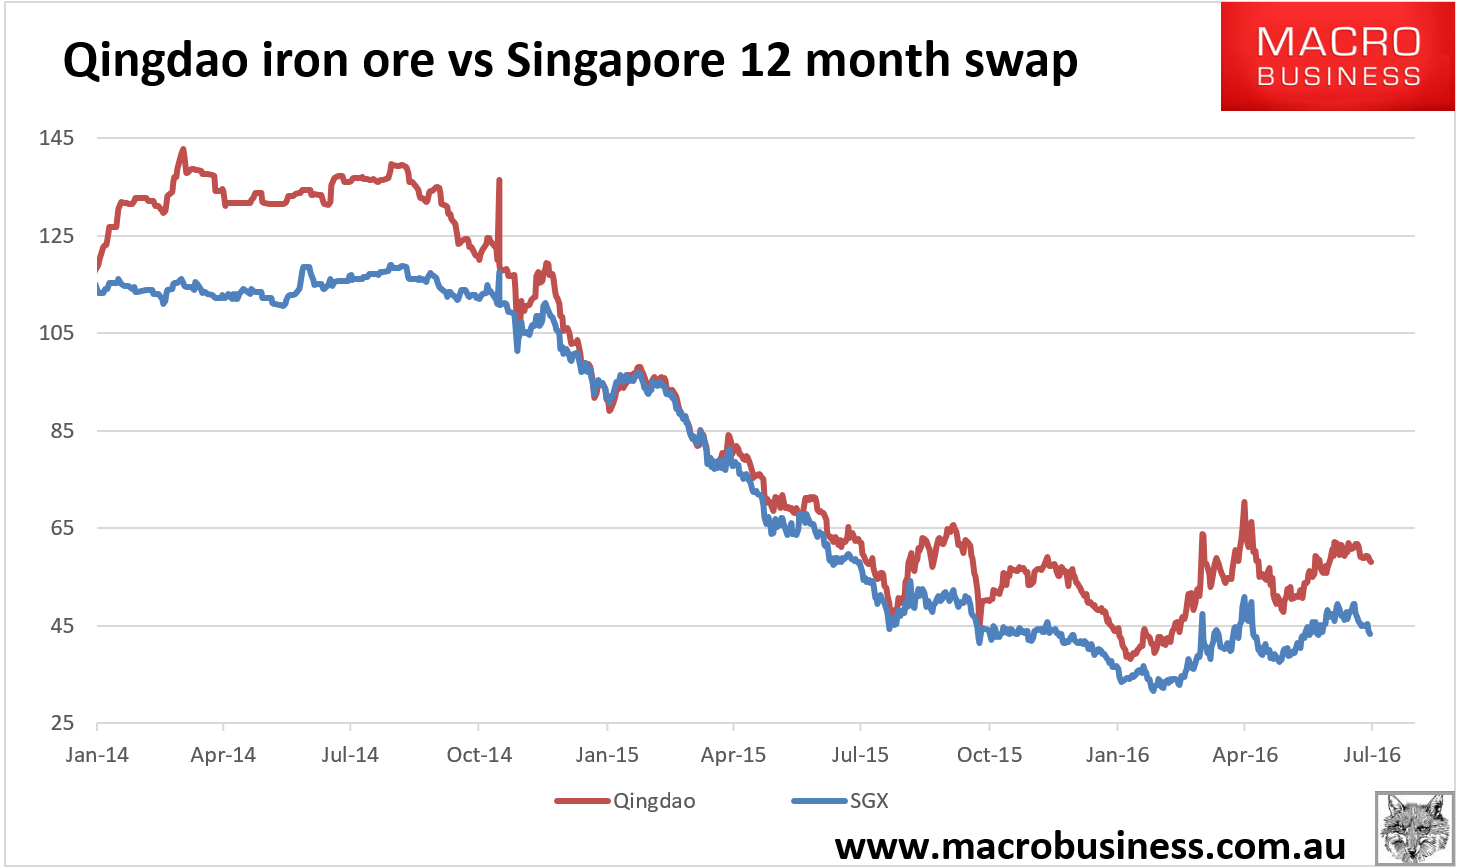
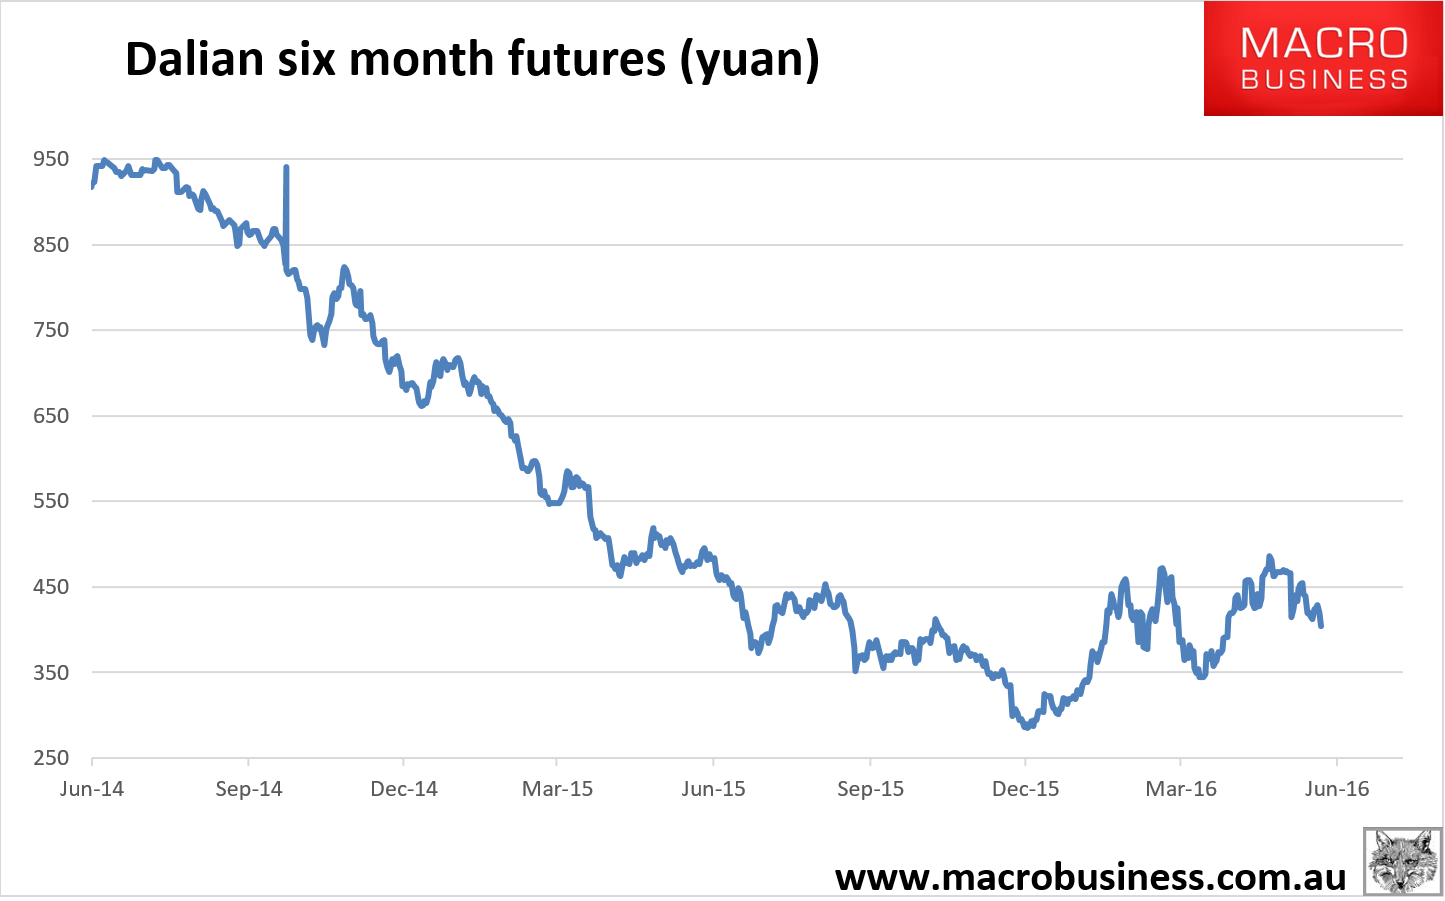
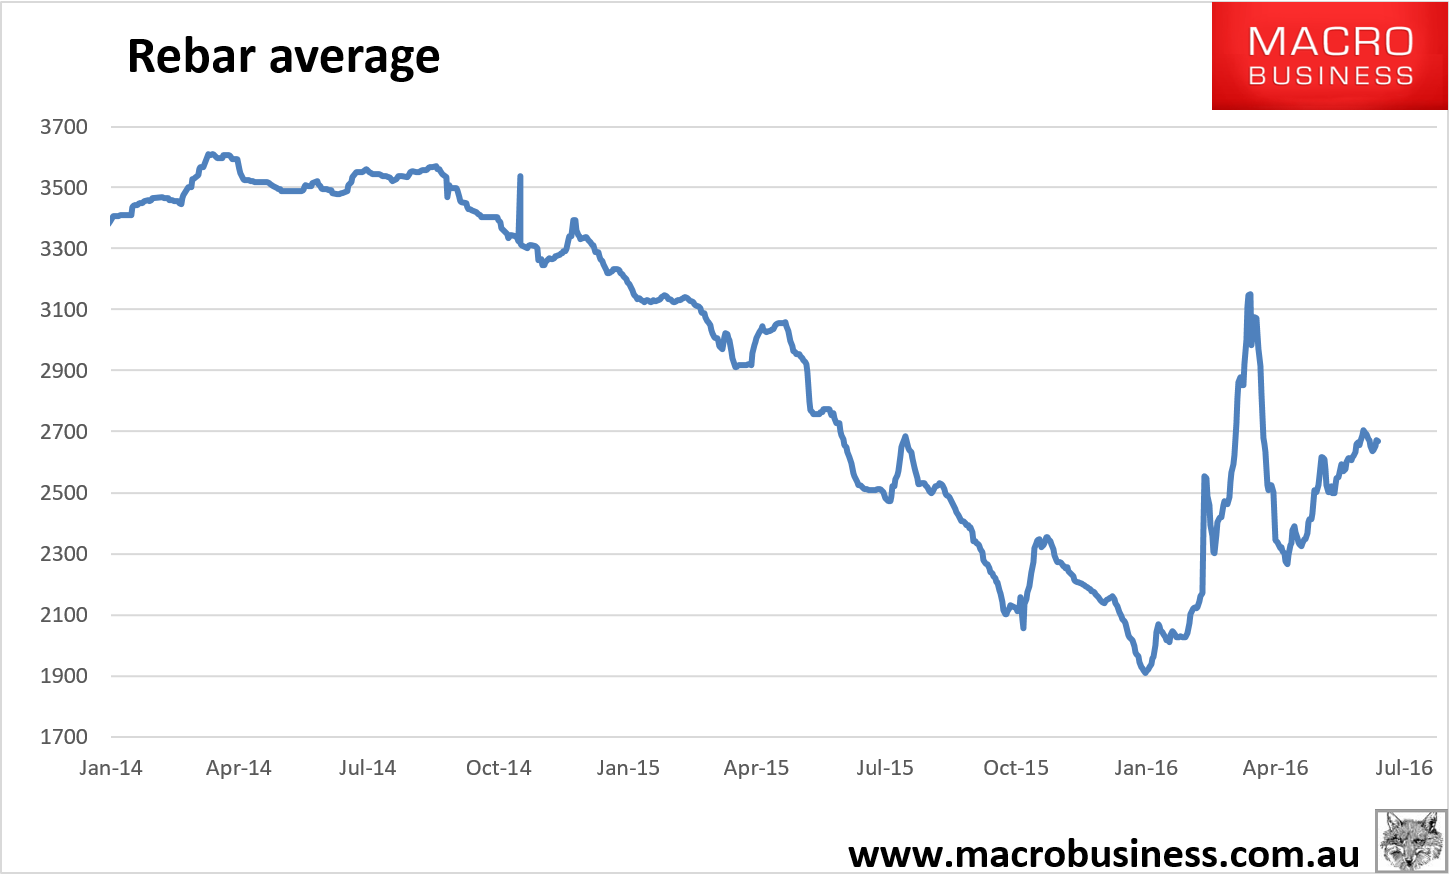
Tianjin benchmark fell 1.5% to $57.40. Paper was soft. Rebar rolled again. One way or another I think we’re into out year-end draw down now. Supply is flooding with more to come. And demand looks shaky. CISA mill output fell heavily in the final ten days of August:
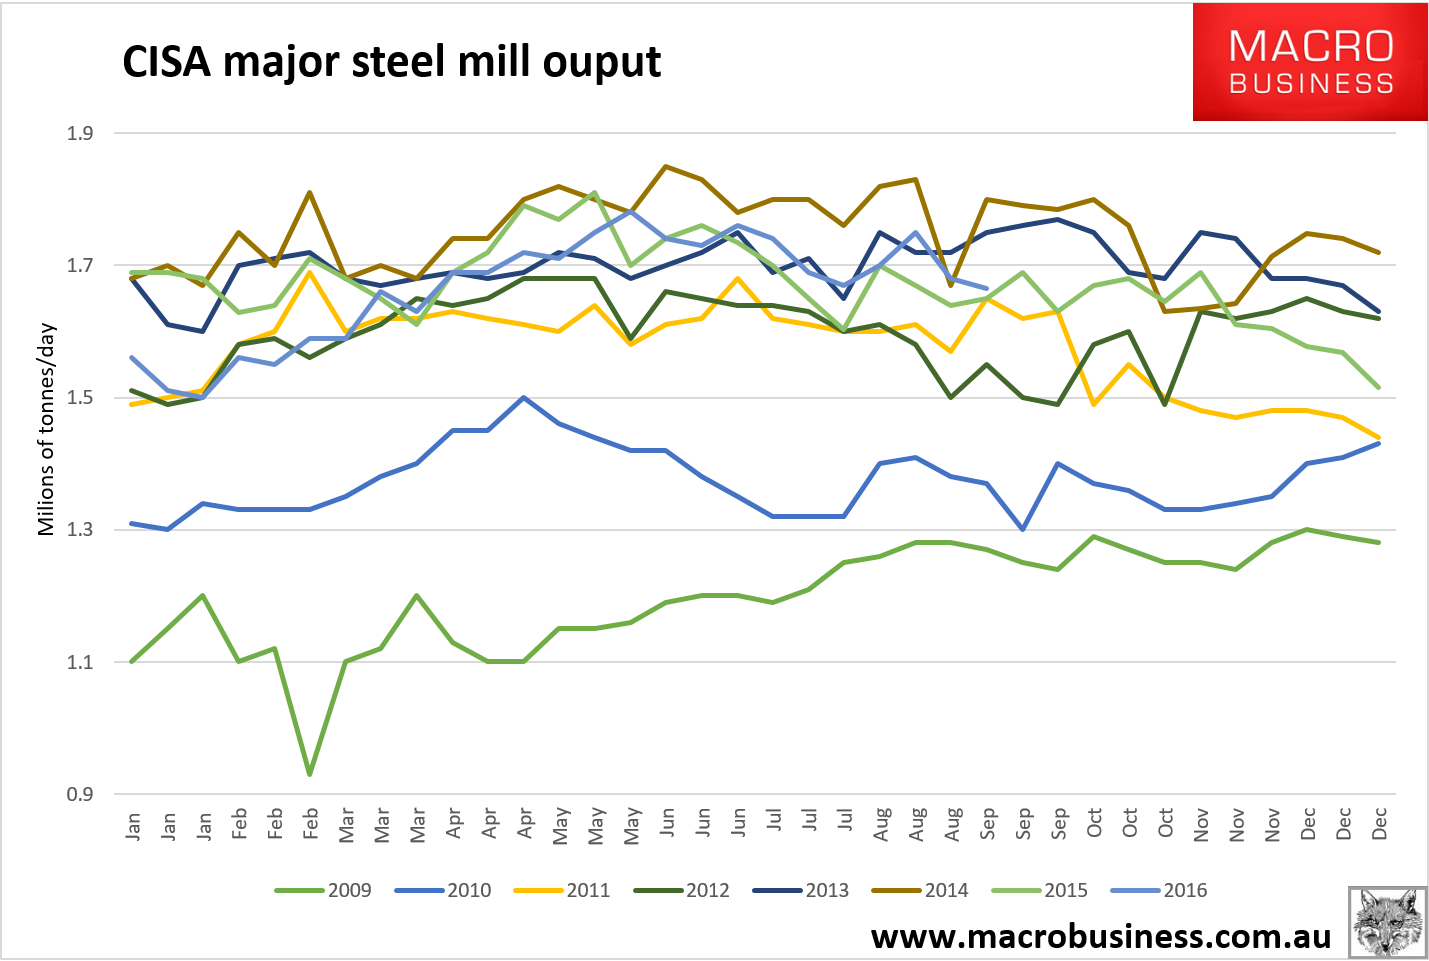
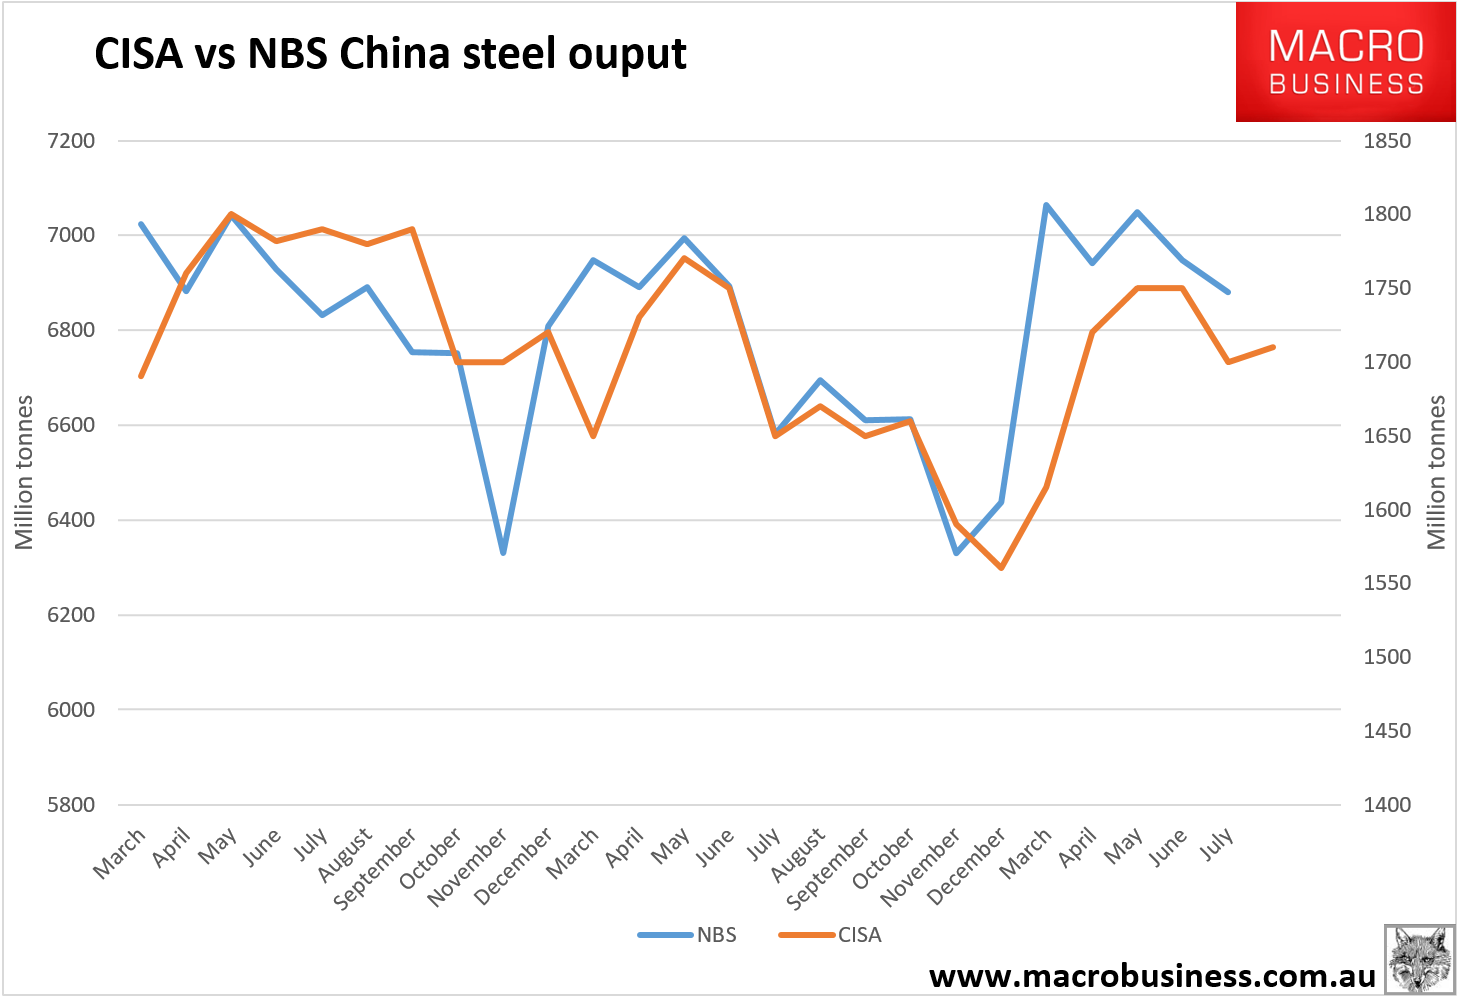
And is signalling solid falls in official August output data for next week:
Advertisement
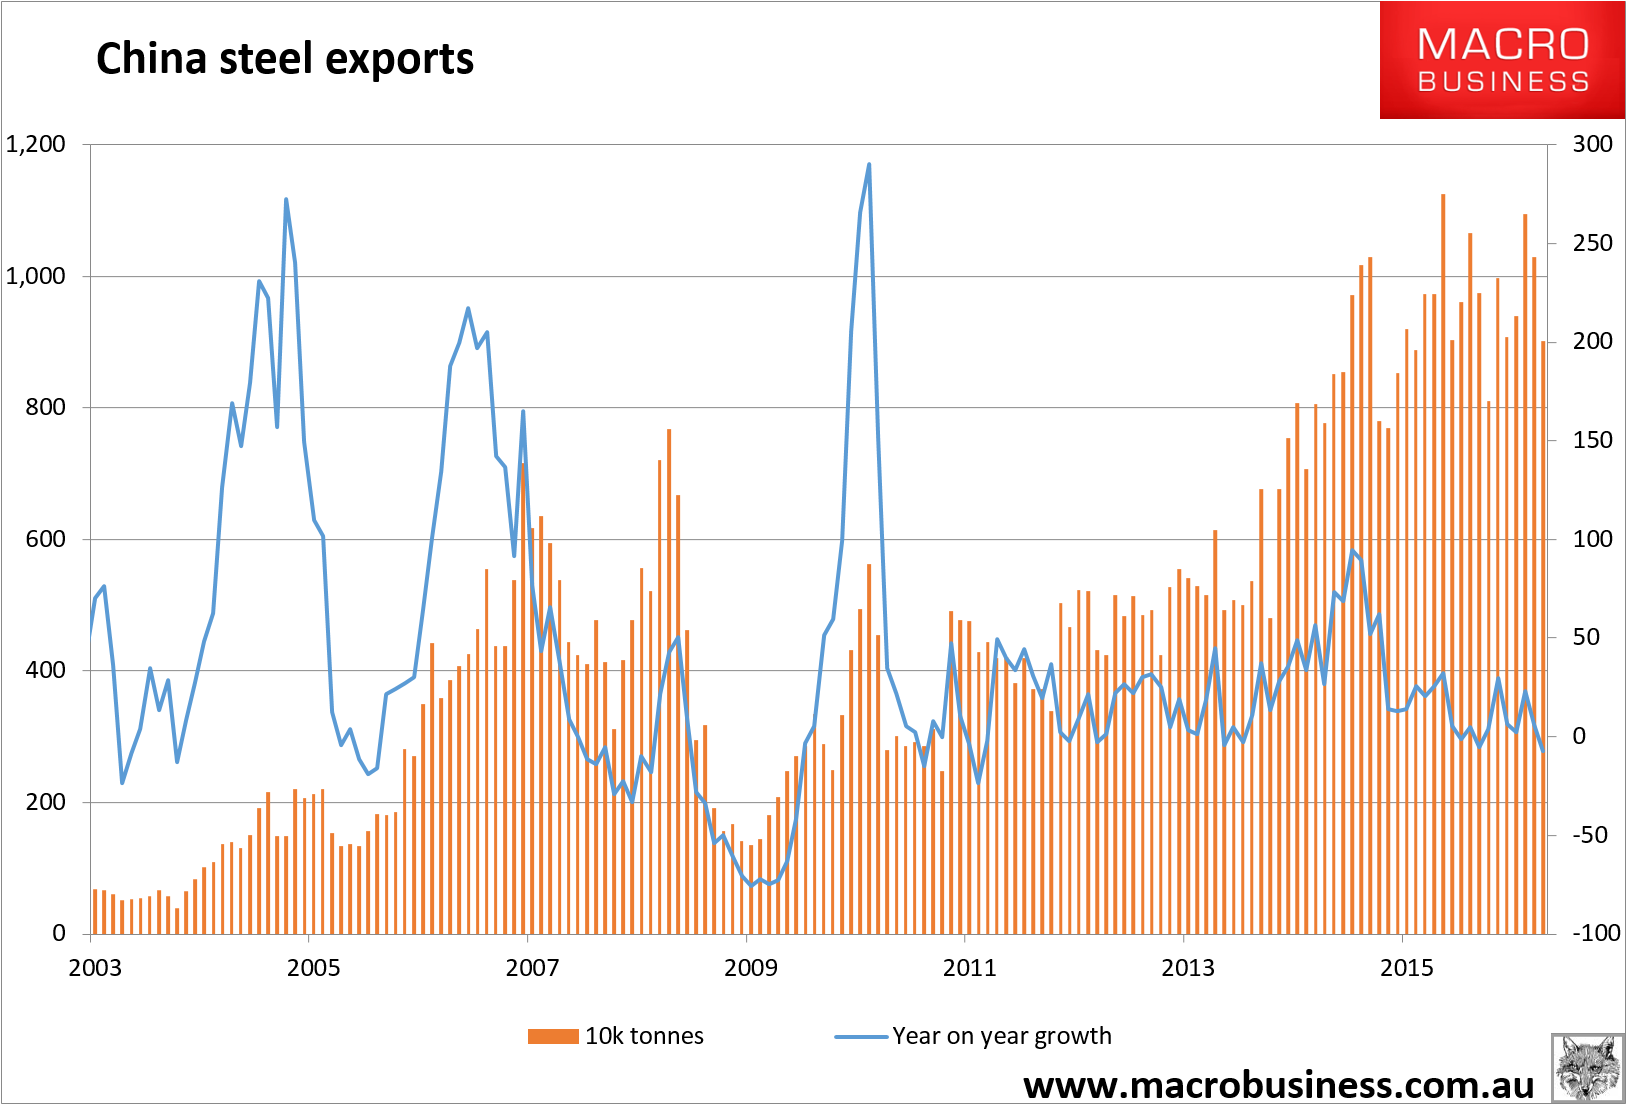
Steel exports were hit -7% year on year in August too:
Advertisement
Year to date growth is still up 6.6% but is steadily declining as trade tensions mount.
All of this is still impacted by G20 disruptions but with the macro picture also set to slow through Q4 I think it fair to say that this market has had its day.
About the author

David Llewellyn-Smith is Chief Strategist at the MB Fund and MB Super. David is the founding publisher and editor of MacroBusiness and was the founding publisher and global economy editor of The Diplomat, the Asia Pacific's leading geo-politics and economics portal.
He is also a former gold trader and economic commentator at The Sydney Morning Herald, The Age, the ABC and Business Spectator. He is the co-author of The Great Crash of 2008 with Ross Garnaut and was the editor of the second Garnaut Climate Change Review.
Advertisement