
Iron ore price charts for July 14, 2016:
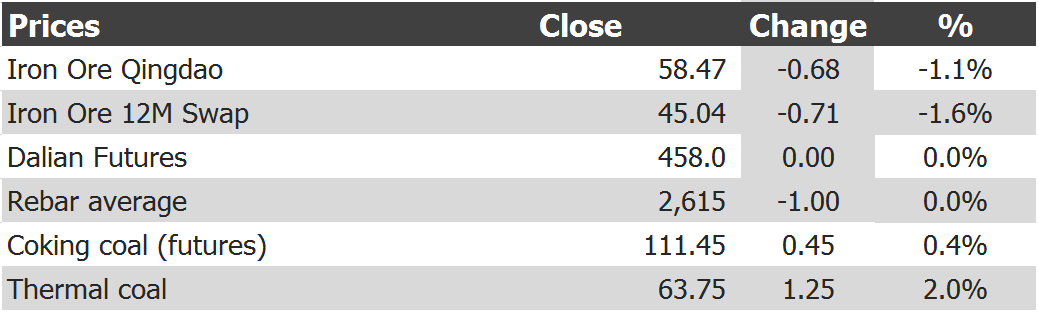
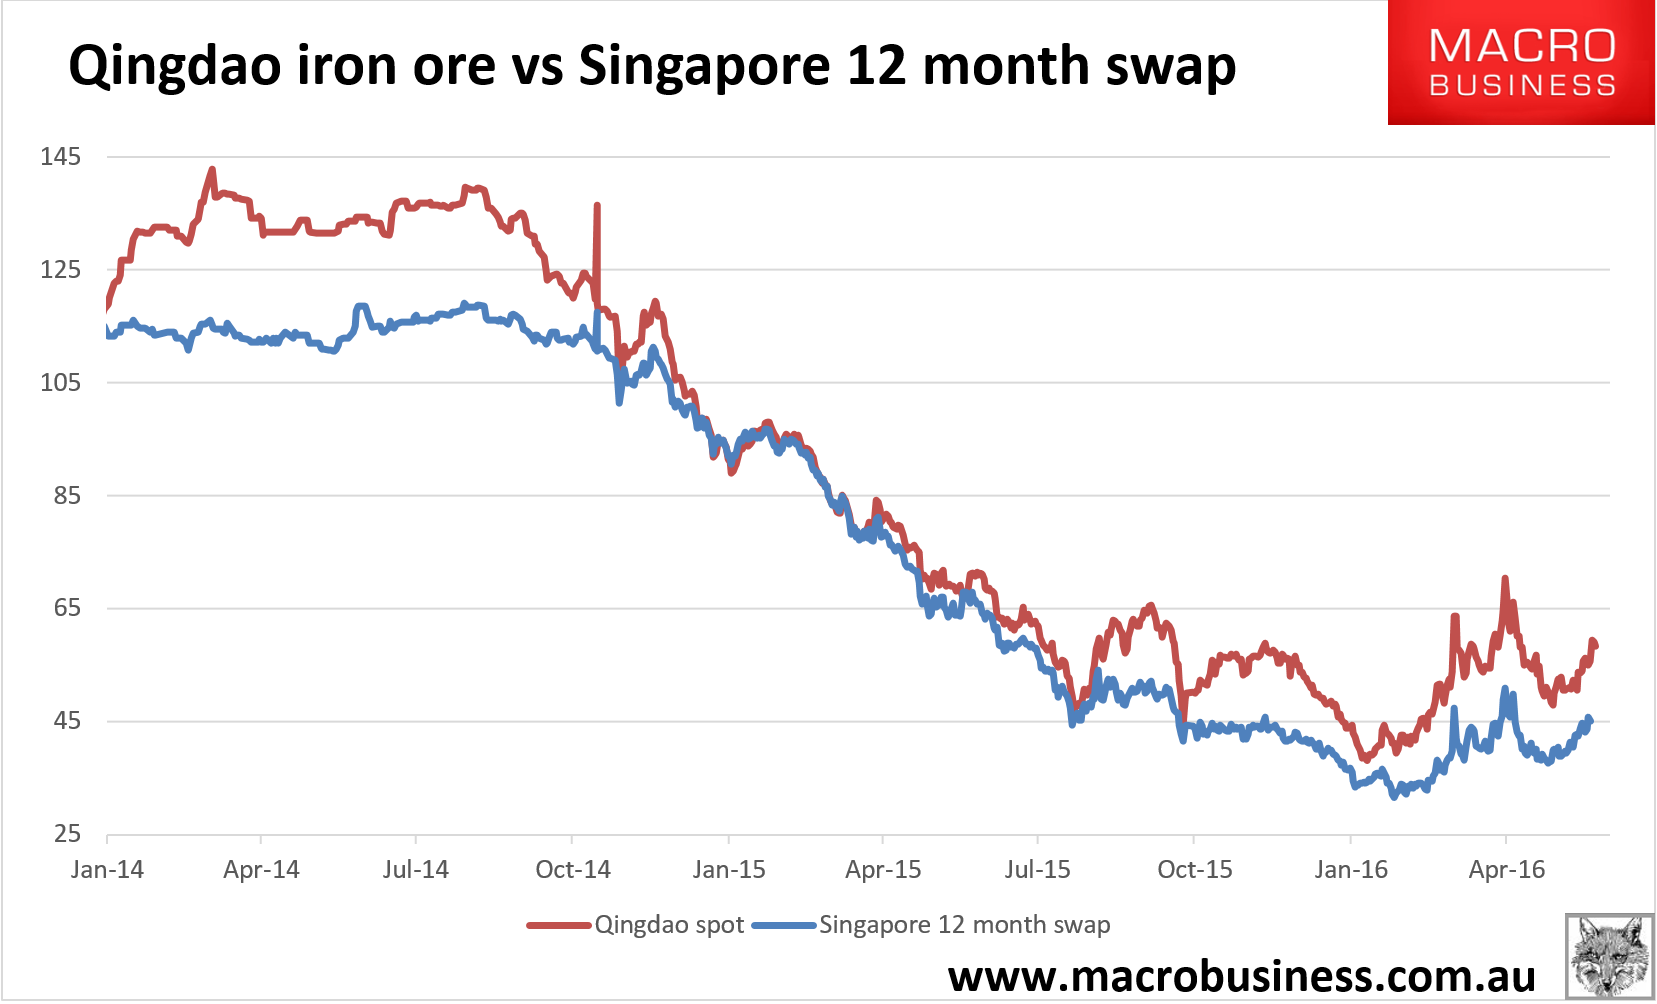
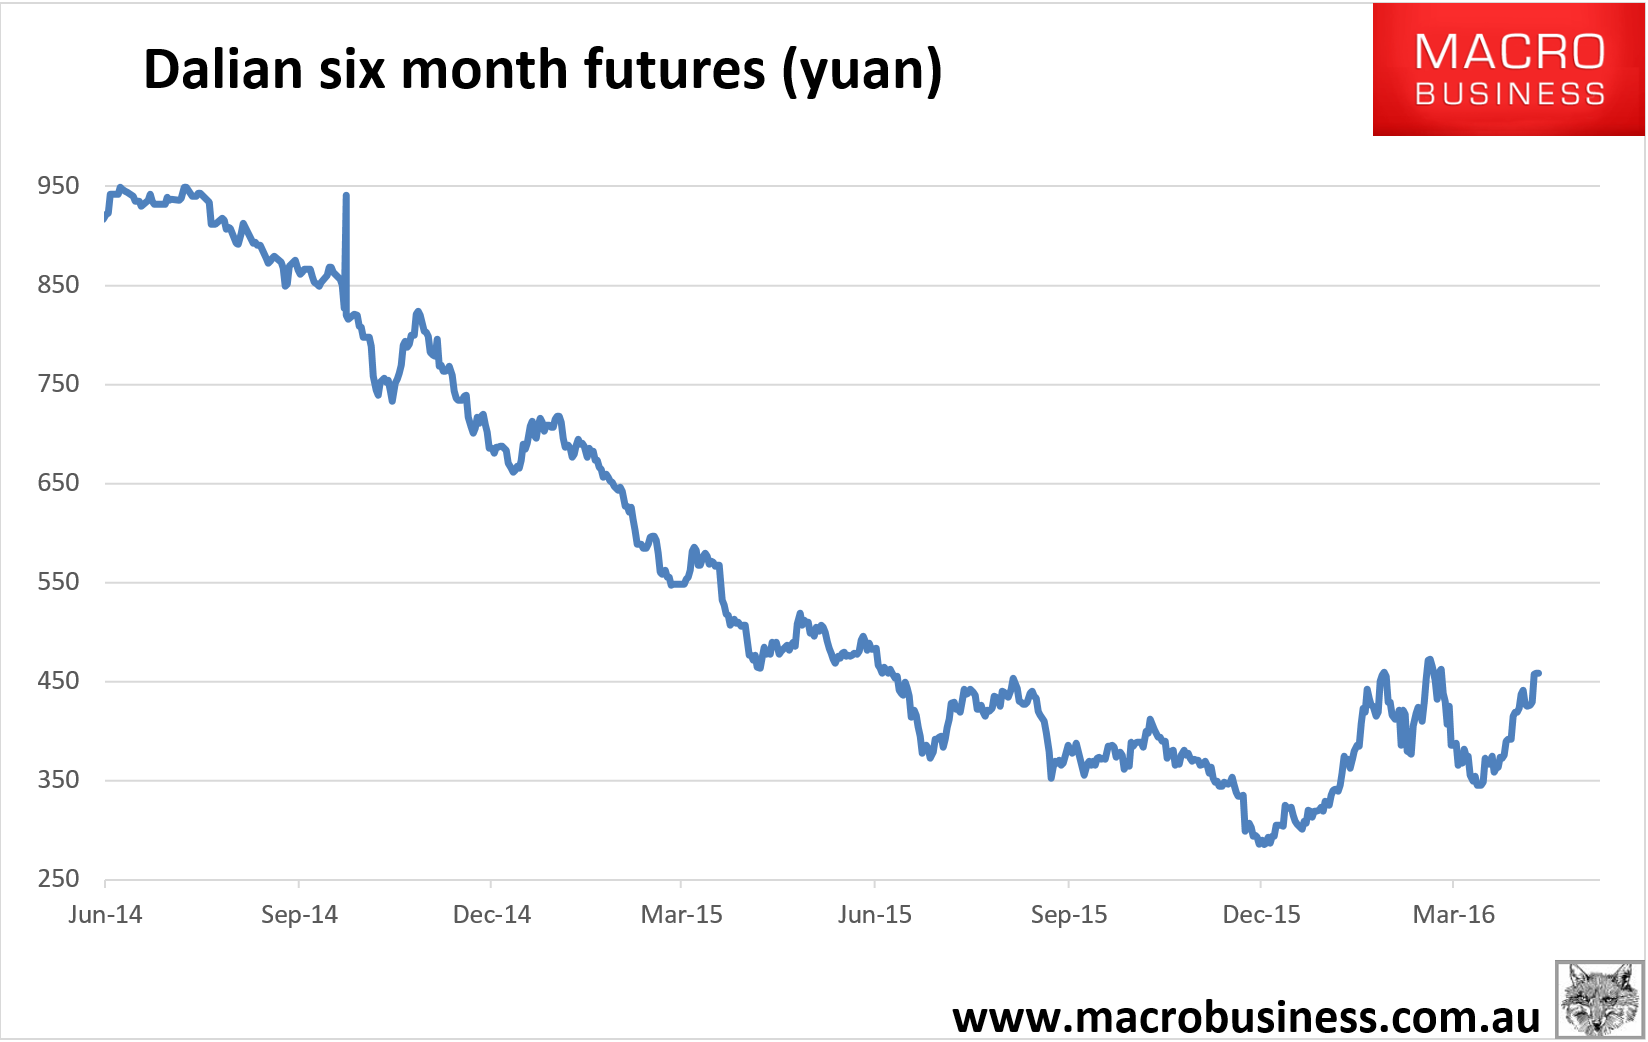
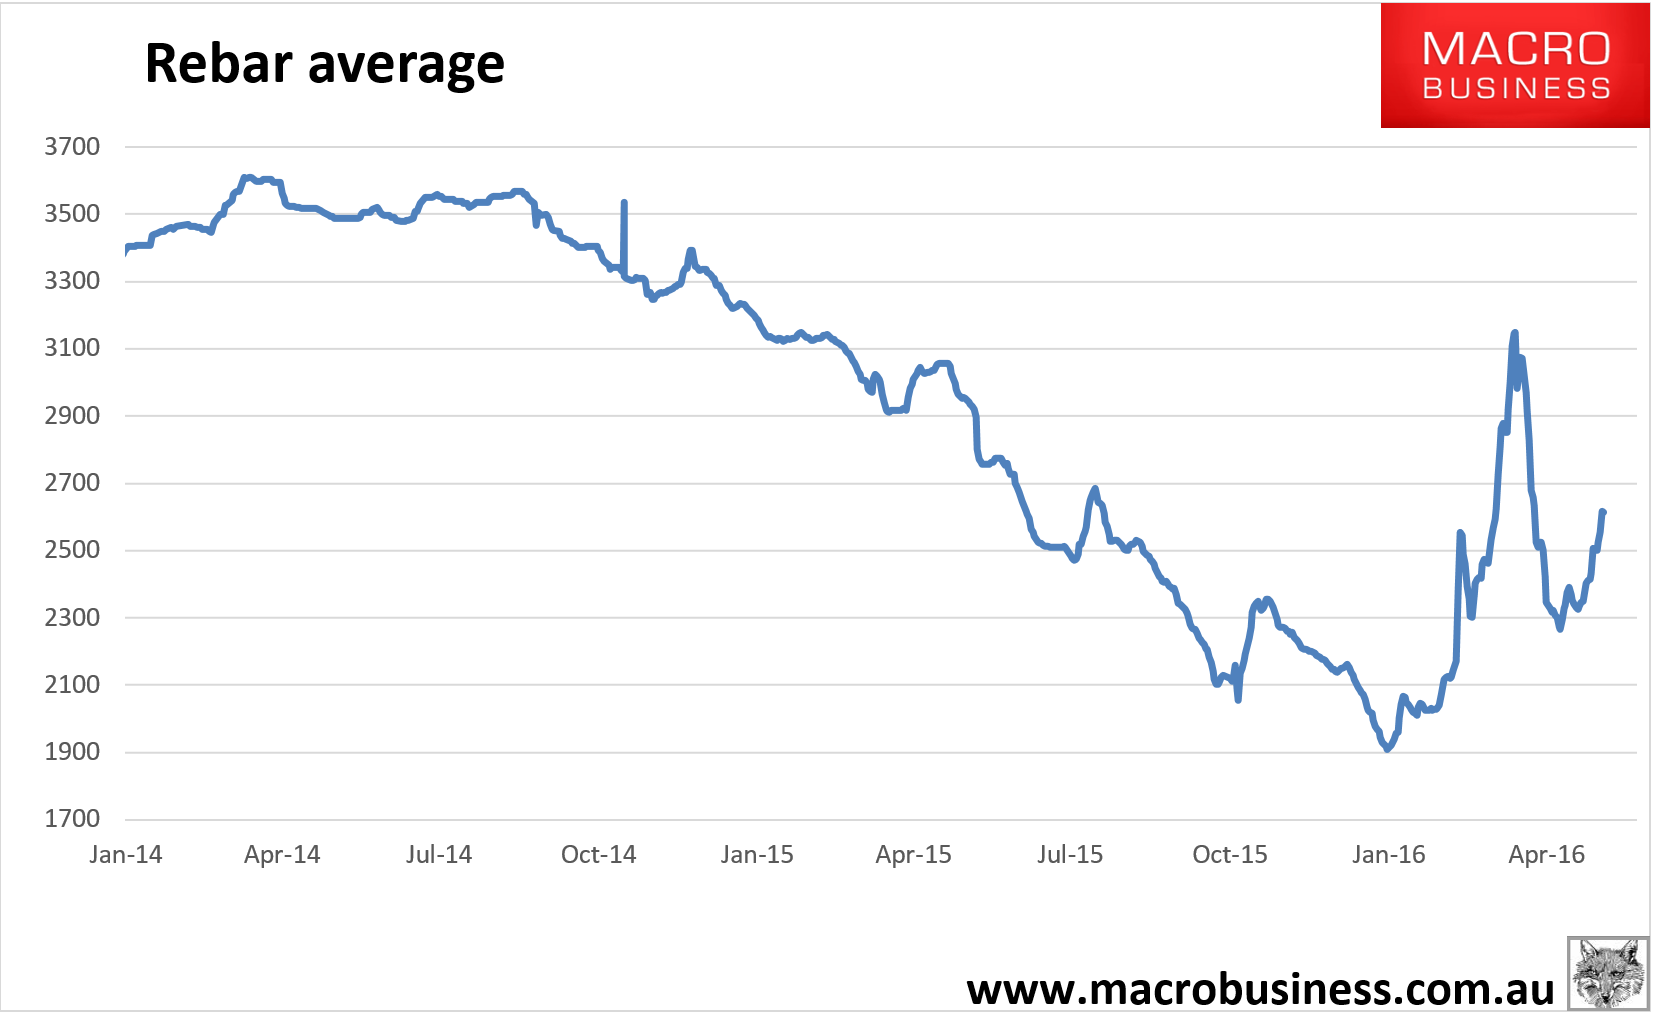
Tianjin benchmark fell 1.2% to $58, paper stalled, rebar averaged stalled. It’s very tempting to call the top for the year right here. The divergence between physical and paper is bearish. Having said that, today’s Chinese GDP and partials are unlikely to be inspiring (or overly weak) and, although in the past I would taken this as a bearish signal, in these days of financialised “do the opposite” evidence of slowing demand for ore is just as likely to send us on another leg up in anticipation of moar stimulus, real or imagined.
The best we can say these days is that on a medium term time frame we are sort of near the top. The seasonal draw downs will begin in a month or so and inventories are high and going higher on recent price lunacy. Reuters has texture:
