Daily iron ore price update (GLUT)

Advertisement

Iron ore charts for July 17, 2016:

sdva dsva Capturetrhwgt Capturedfba Capture

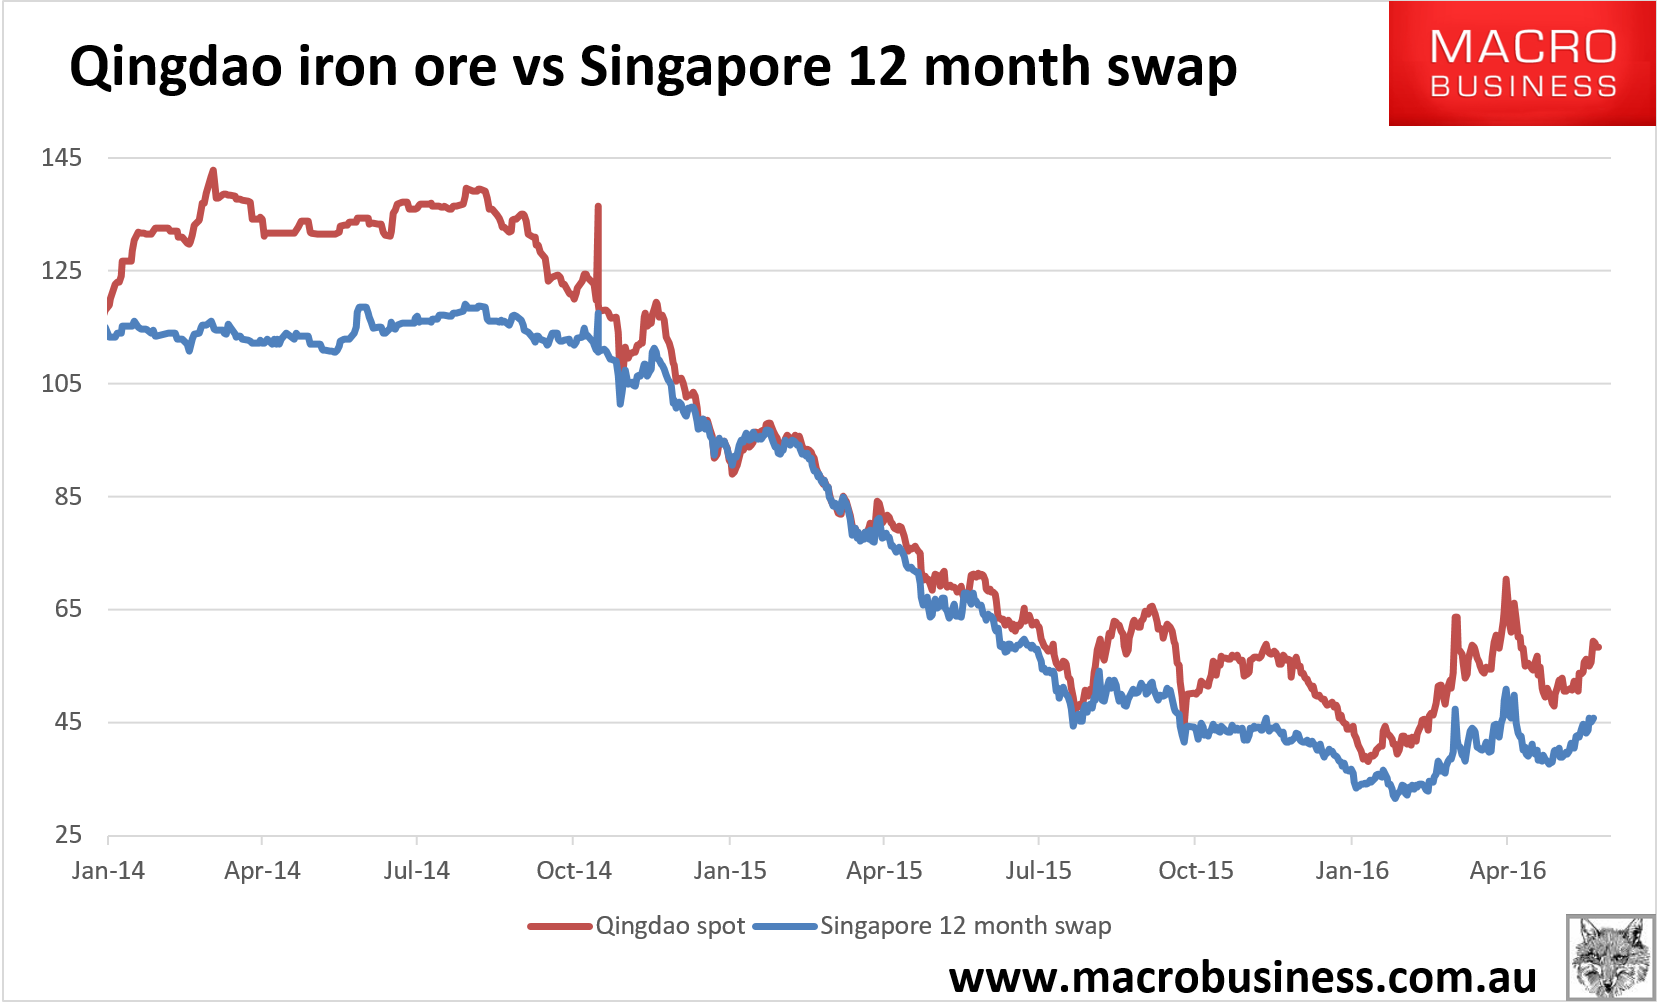
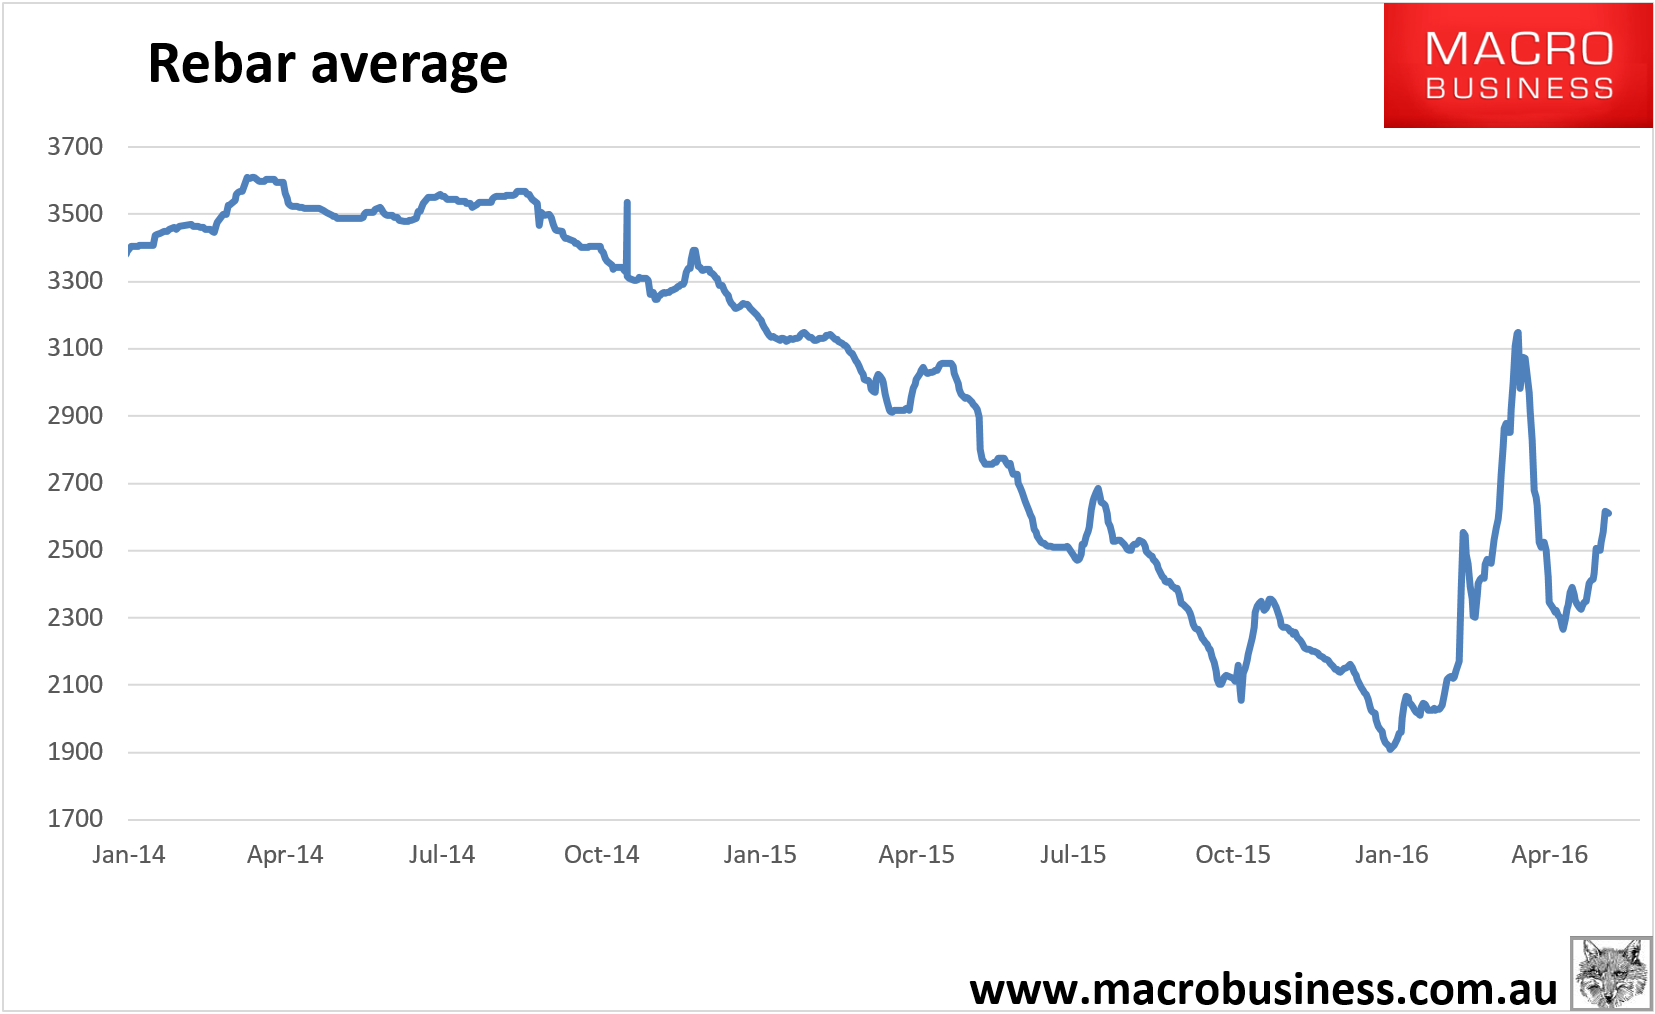
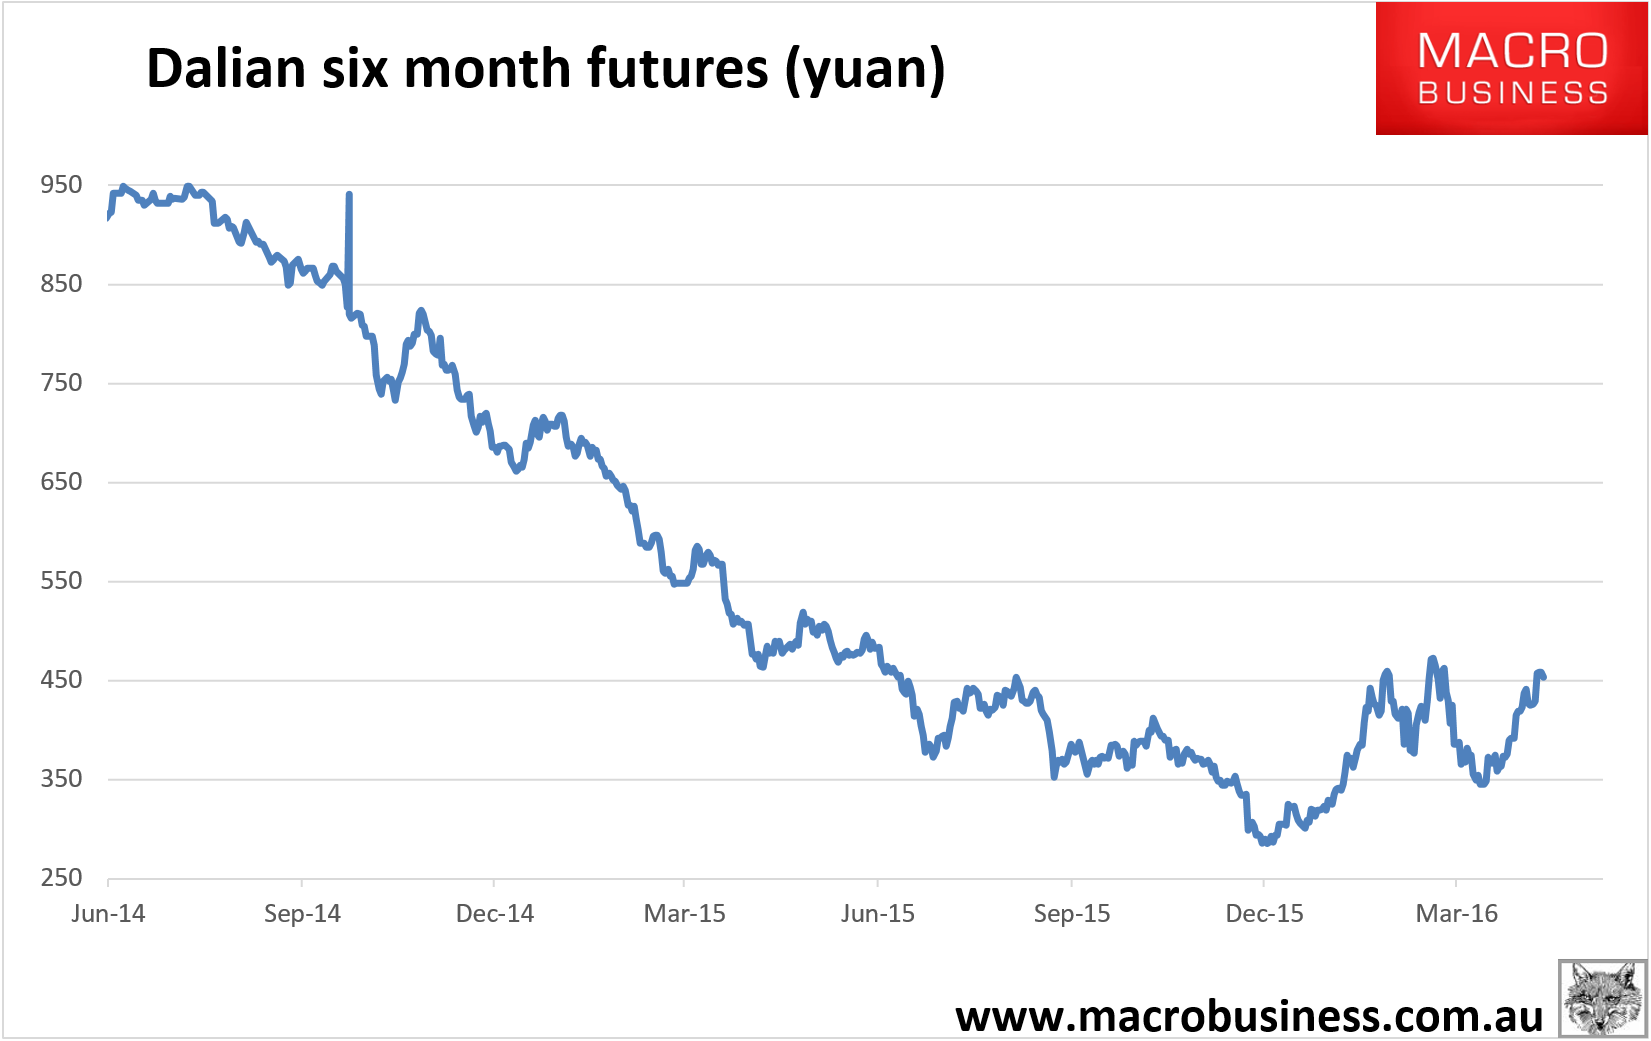
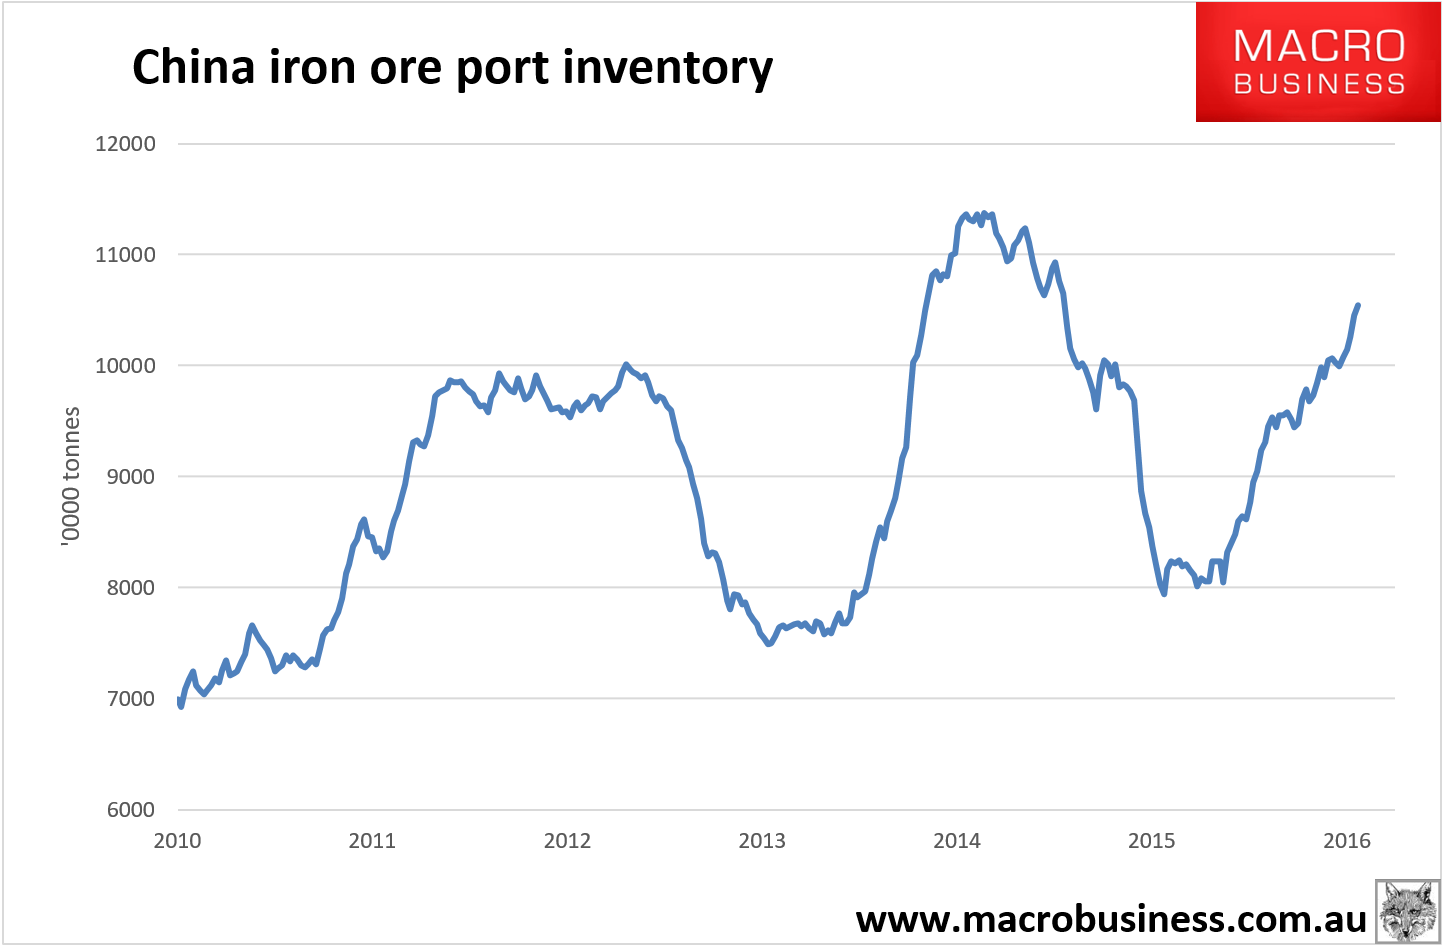
Spot eased, paper fell, rebar average appears to have topped. Chinese port inventory grew another 900kt. Looks like the top is in for the year given Q2 Chinese data is now passed and suggested a gentle fade in activity ahead but not enough for new stimulus.

Port stocks are an especially ugly indicator given they’ve lift 4.9mt in the past month indicating an annual excess to underyling demand of 56.4mt of iron ore. Take that out of the equation and iron ore is back at $40. And take it out the market will before year end, and more, as destocking begins.

The full text of this article is available to MacroBusiness subscribers

$1 for your first month, then:
Cancel at any time through our billing provider, Stripe
About the author
David Llewellyn-Smith is Chief Strategist at the MB Fund and MB Super. David is the founding publisher and editor of MacroBusiness and was the founding publisher and global economy editor of The Diplomat, the Asia Pacific’s leading geo-politics and economics portal. He is also a former gold trader and economic commentator at The Sydney Morning Herald, The Age, the ABC and Business Spectator. He is the co-author of The Great Crash of 2008 with Ross Garnaut and was the editor of the second Garnaut Climate Change Review.