Worst ever housing affordability analysis award goes to…
Stephen Koukoulas (“the Kouk”) has posted a rant at The Guardian arguing that Generation Y should stop complaining about housing affordability and that they “might choke on their lattes if they had to make the same sort of sacrifices” that “Gen Xers and baby boomers” did:
While house prices today are high, it is possible for any Gen X person to go to a financial institution, get a loan and pay a staggeringly low interest rate as they buy their first house.
Those Gen Xers and the baby boomers who took the risk of buying a “cheap” house in the 70s and early 80s were confronted with interest rates that averaged 13% and peaked at 17% in the late 80s. If any Gen Y has ever put that sort of interest rate into their mortgage calculators, they might choke on their skinny soy lattes.
It is important to also recall that in the cloistered banking sector of 30 to 40 years ago, customer loyalty to a bank was important in getting a loan. If you were a Bank of New South Wales customer, it was difficult if not impossible to get a loan with a different bank. Or if you did, they would only lend you about 80% of what you wanted at the mortgage rate (remember, double digits) and the other 20% would be a “cocktail” loan with a personal loan type interest rate. There was minimal competition so it was a take it or leave it offer from the bank.
Research by the Reserve Bank of Australia shows that interest rates and not house prices are the most important determinant of servicing a mortgage debt. At the moment, the average mortgage repayment is a smaller proportion of income than the long-run average. Servicing a big mortgage on an expensive dwelling with low interest rates today is about as easy, if not easier, than managing a smallish loan on a cheap house with very high interest rates in the 70s and 80s…
It is also important to be frank and acknowledge that it is always hard to buy a house. It was in the 70s, in the 80s, 90s and it still is. It requires a huge savings effort and a bit of time with baked beans on toast and glamour-free holidays to get your foot in the door.
This is one of the worst analysis of housing affordability that I have read.
First, the Kouk has conveniently failed to account for the size of the deposit that must be saved by today’s buyers, which dwarfs prior generations.
As shown in the next table, which comes from the ABS’ Household Income and Wealth Survey (2013-14), the typical (median) Aussie capital city household earned $77,740 in 2013-14 (see below table). Adjust this upwards by the ABS’ wages price survey and this becomes $80,495 as at December 2015.
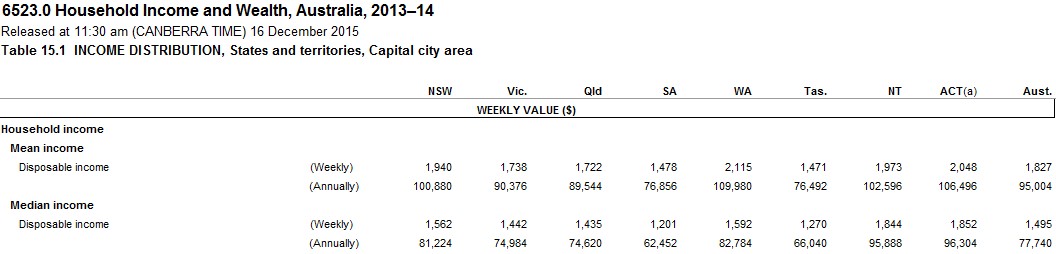
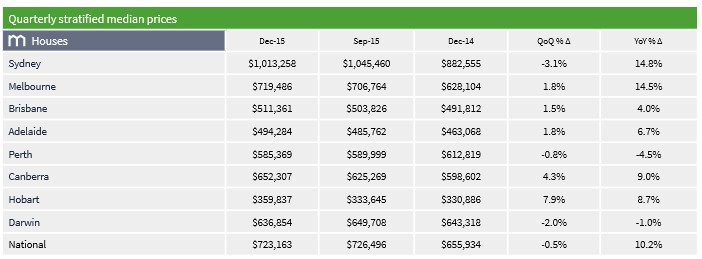
According to Domain, the median capital city house was valued at $723,163 as at December 2015 (see below), giving a median house price-to-income ratio of 9.0 times!
Assuming that the household can save 30% of their disposable income for a deposit, it would take them an incredible 3 years to save a 10% deposit and 6 years to save a 20% deposit for the median priced house. Add stamp duty into the mix, which is much higher today than it was in the 1970s and 1980s, and the equation worsens materially.
Second, the Kouk has conveniently drawn his conclusions by arguing that interest rates are much lower today than in the 1970s and 1980s (see below chart).
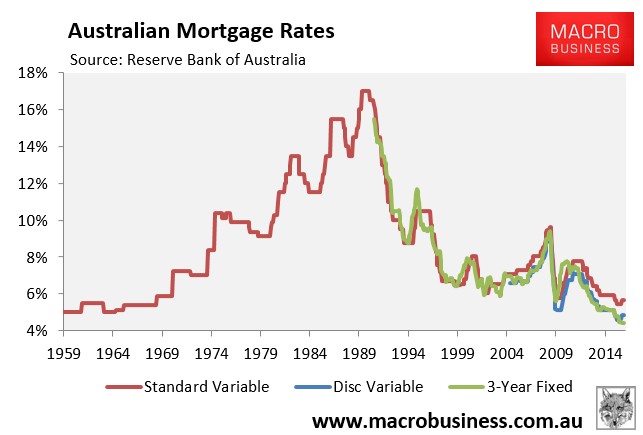
This is misleading on a number of levels.
First, interest rates in the late 1980s – when they were at their highest – did not stay high for long and a home buyer back then got to enjoy the benefit of a massive drop in mortgage rates over subsequent years and a corresponding massive rise in house prices.
Does anyone honestly believe that today’s first home buyer is likely to face similar conditions in the years ahead, whereby mortgage rates more than halve and values skyrocket? Unlikely.
More importantly, when adjusted for inflation, real mortgage rates – 3.15% (discounted) as at December 2015 – are above levels that existed prior to the early-1980s – a time when many baby boomers purchased their homes (see next chart).
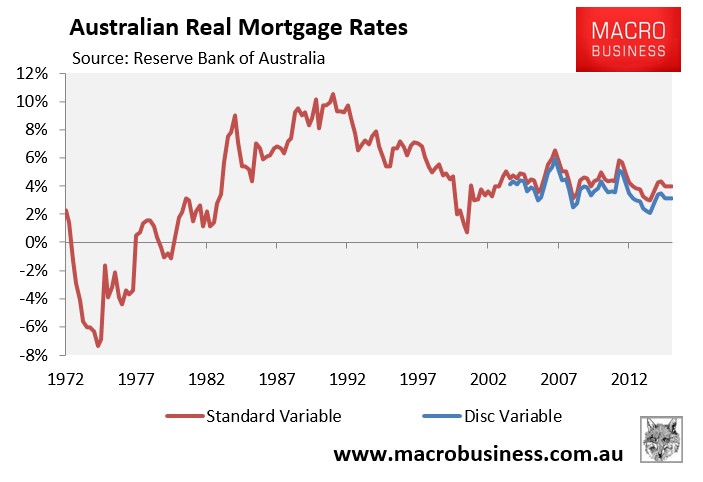
Indeed, it is the inflation component that Kouk conveniently omits from his analysis.
When interest rates, inflation and wages growth were high, the upfront cost of buying a home was high (because the of the mortgage rate) but the payments became much easier over time as wage rises inflated the debt burden away. By contrast, these days low interest rates makes it much easier to buy a house (provided you can raise a deposit) but low inflation and low wages growth makes it much much harder to pay-off.
To illustrate this point, check out the next chart of annual wages growth going back to 1970:
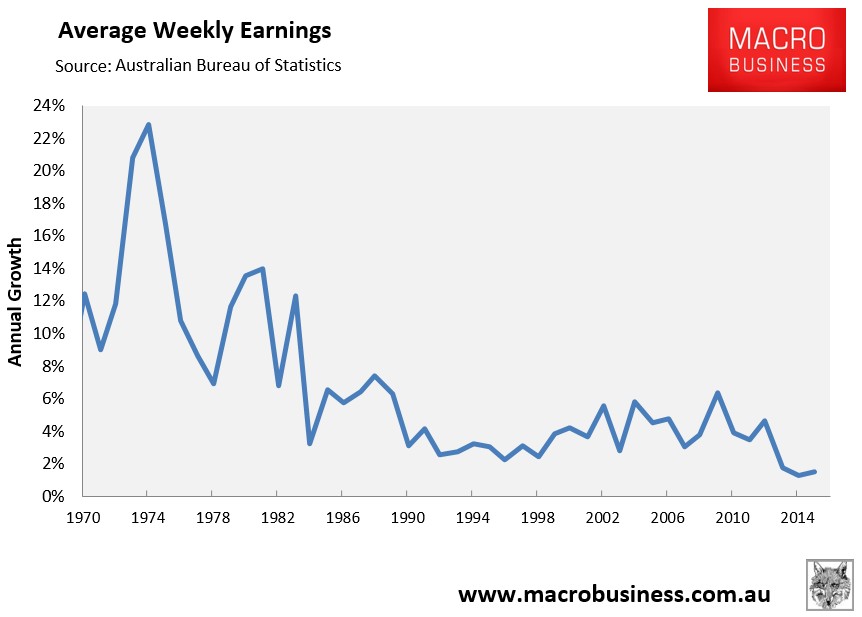
As you can see, buyers of houses in the 1970s and 1980s enjoyed massive wage rises thanks to high inflation, which inflated their debts away quick smart. By contrast, today’s buyers are facing some of the lowest wages growth and inflation on record, meaning a massive mortgage today will still be a big mortgage in 10-year’s time.
This also means today’s buyers will have to sacrifice a much larger proportion of their lifetime’s earnings on housing than previous generations did.
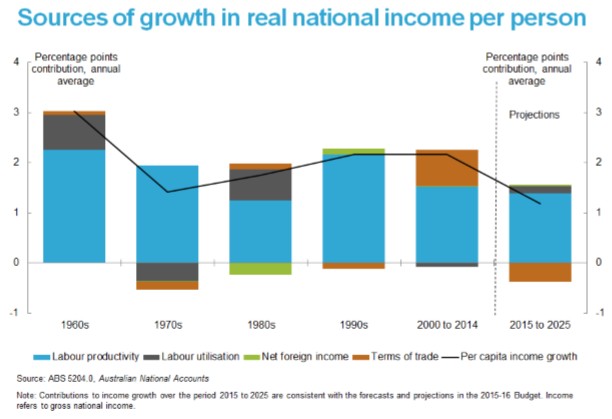
Unfortunately, the situation for today’s buyers is unlikely to change any time soon, given the Australian Treasury has forecasted that income growth will be the weakest in at least 60 years over the coming decade, which will make paying-off today’s mega mortgage far more difficult (see next chart).
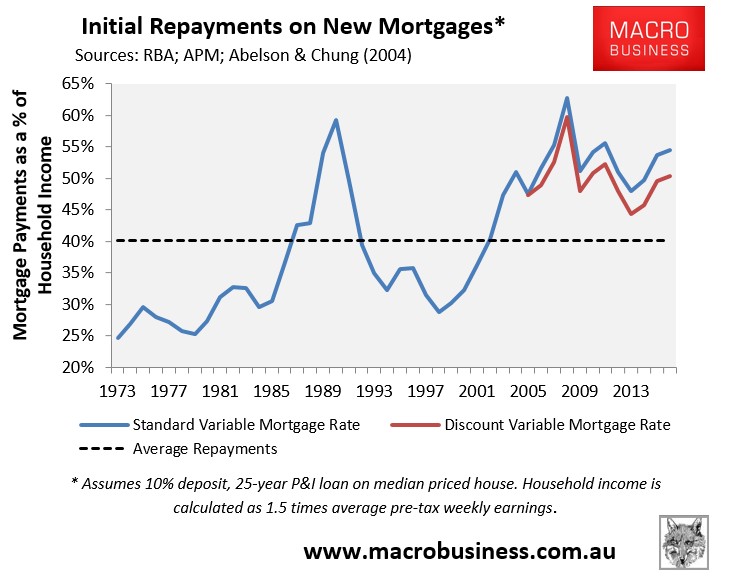
The Kouk’s statement that “the average mortgage repayment is a smaller proportion of income than the long-run average” is also false. As shown in the next chart, initial repayments on new mortgages remain well above the 40-year average. Therefore, current housing conditions remain unfavourable, particularly given the anaemic income growth.
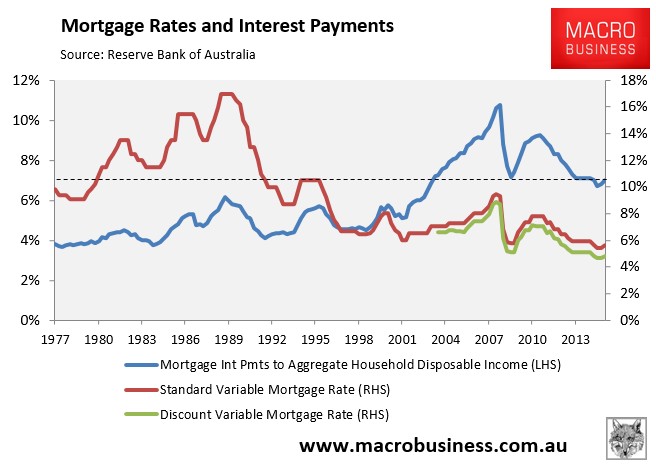
Moreover, despite the lowest nominal mortgage rates on record, the huge growth of dwelling values has seen aggregate mortgage repayments to aggregate household disposable income remain some 13% above the level when mortgage interest rates peaked at 17% in the late-1980s (see next chart). If you added the higher mortgage principal today, which also must be repaid, then the chart would obviously worsen for today’s housing slaves.
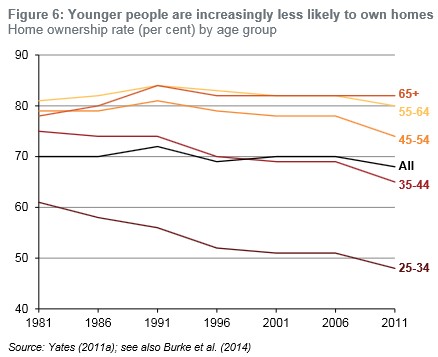
Finally, the Kouk conveniently fails to mention the sharp drop-off in home ownership rates among younger cohorts – bonafide evidence of falling housing affordability (see next chart).
What should also become clear from the above charts is that the 1970s was a dream time to purchase a home. Not only were homes highly affordable relative to incomes, but a purchaser was in the fortunate position to have had their debts inflated away via high inflation and wages growth that easily outpaced the cost of credit.
Of course, it was also the early baby boomers who benefited the most from these favourable conditions before enjoying the rampant house price inflation that followed. If only today’s home buyers were so lucky!
