
Here are the iron ore charts for March 22, 2016:
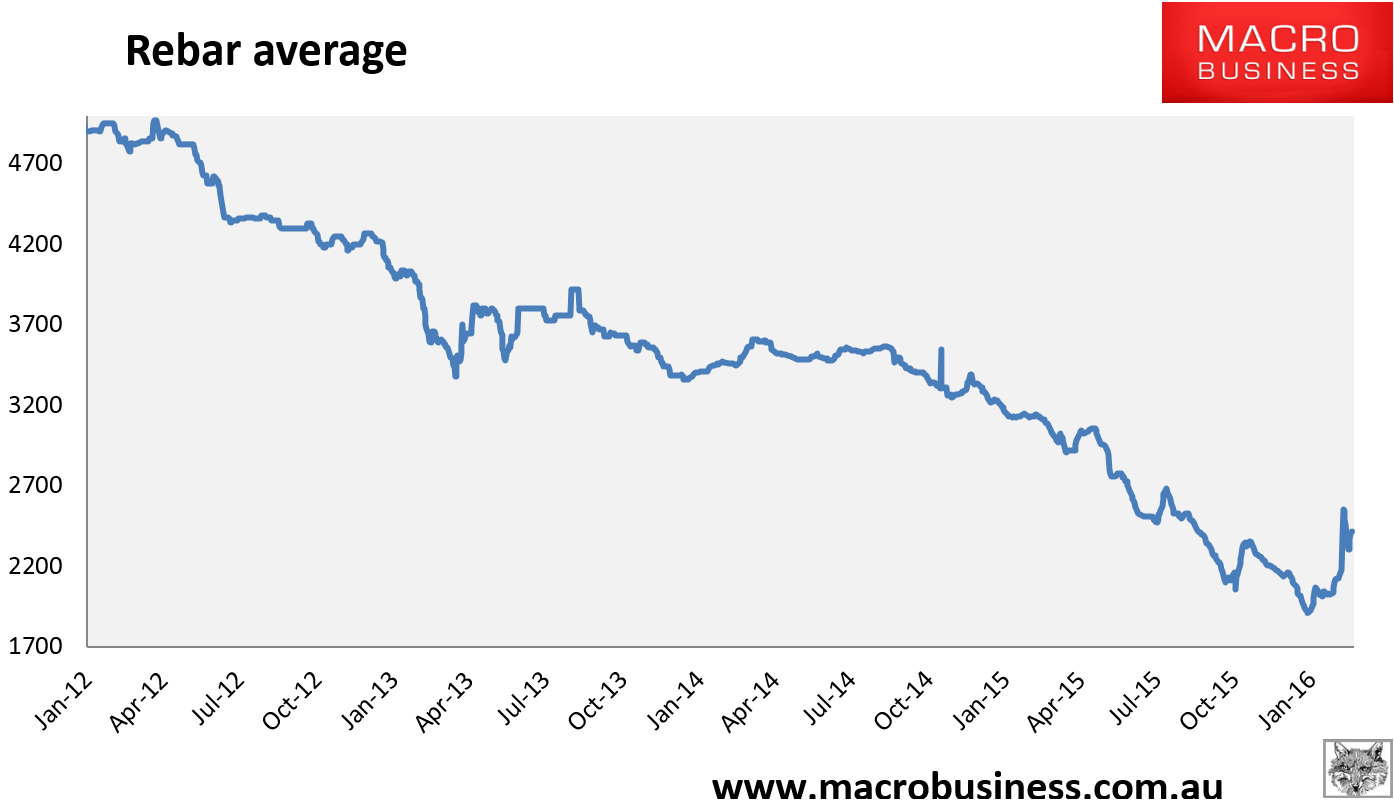
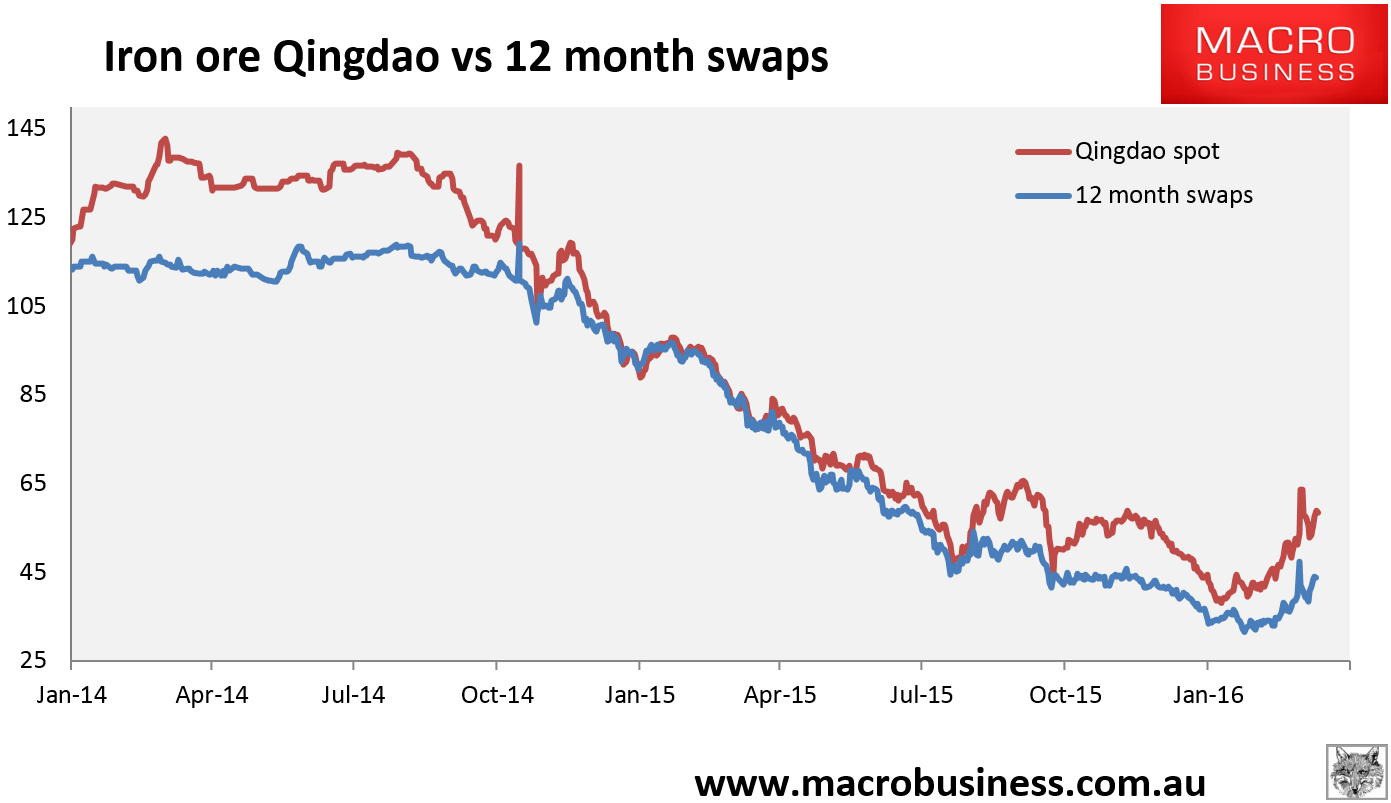
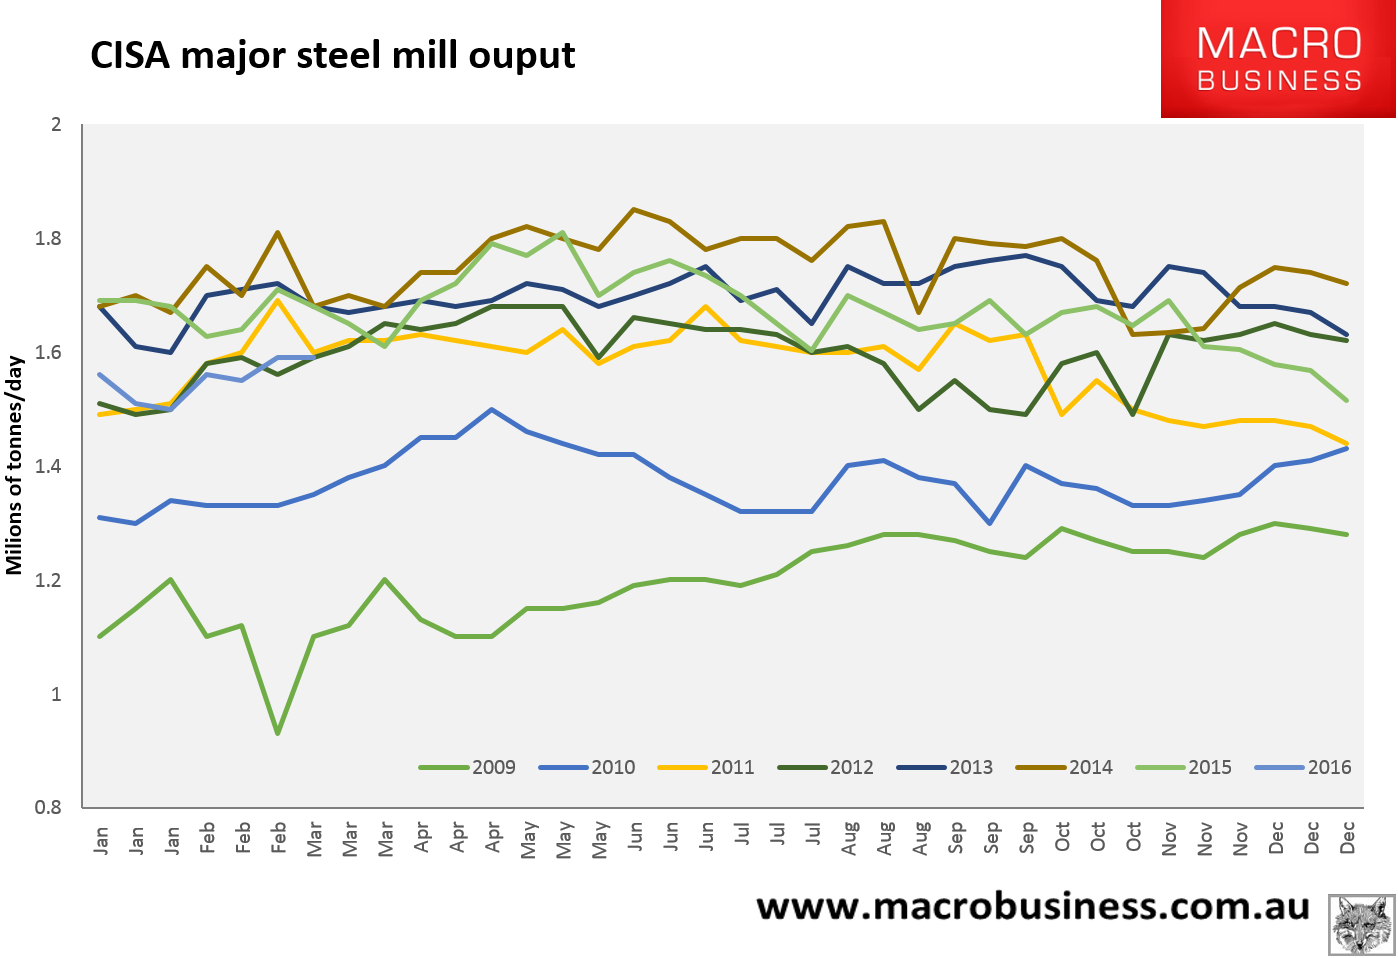
Spot eased with Tianjin benchmark down -0.2% to $57.90. Paper fell. Rebar ran out of rocket fuel. The most bizarre chart today is the last one. CISA fast data on steel mill output in early March fell marginally to 1.56 million tonnes (mt) per day. This was amid a firm rally in steel prices though the big spike was only just beginning so that may explain the apparent slowness of mills to respond to price rises with higher output. Macquarie’s steel mills survey yesterday did show movement on that front:
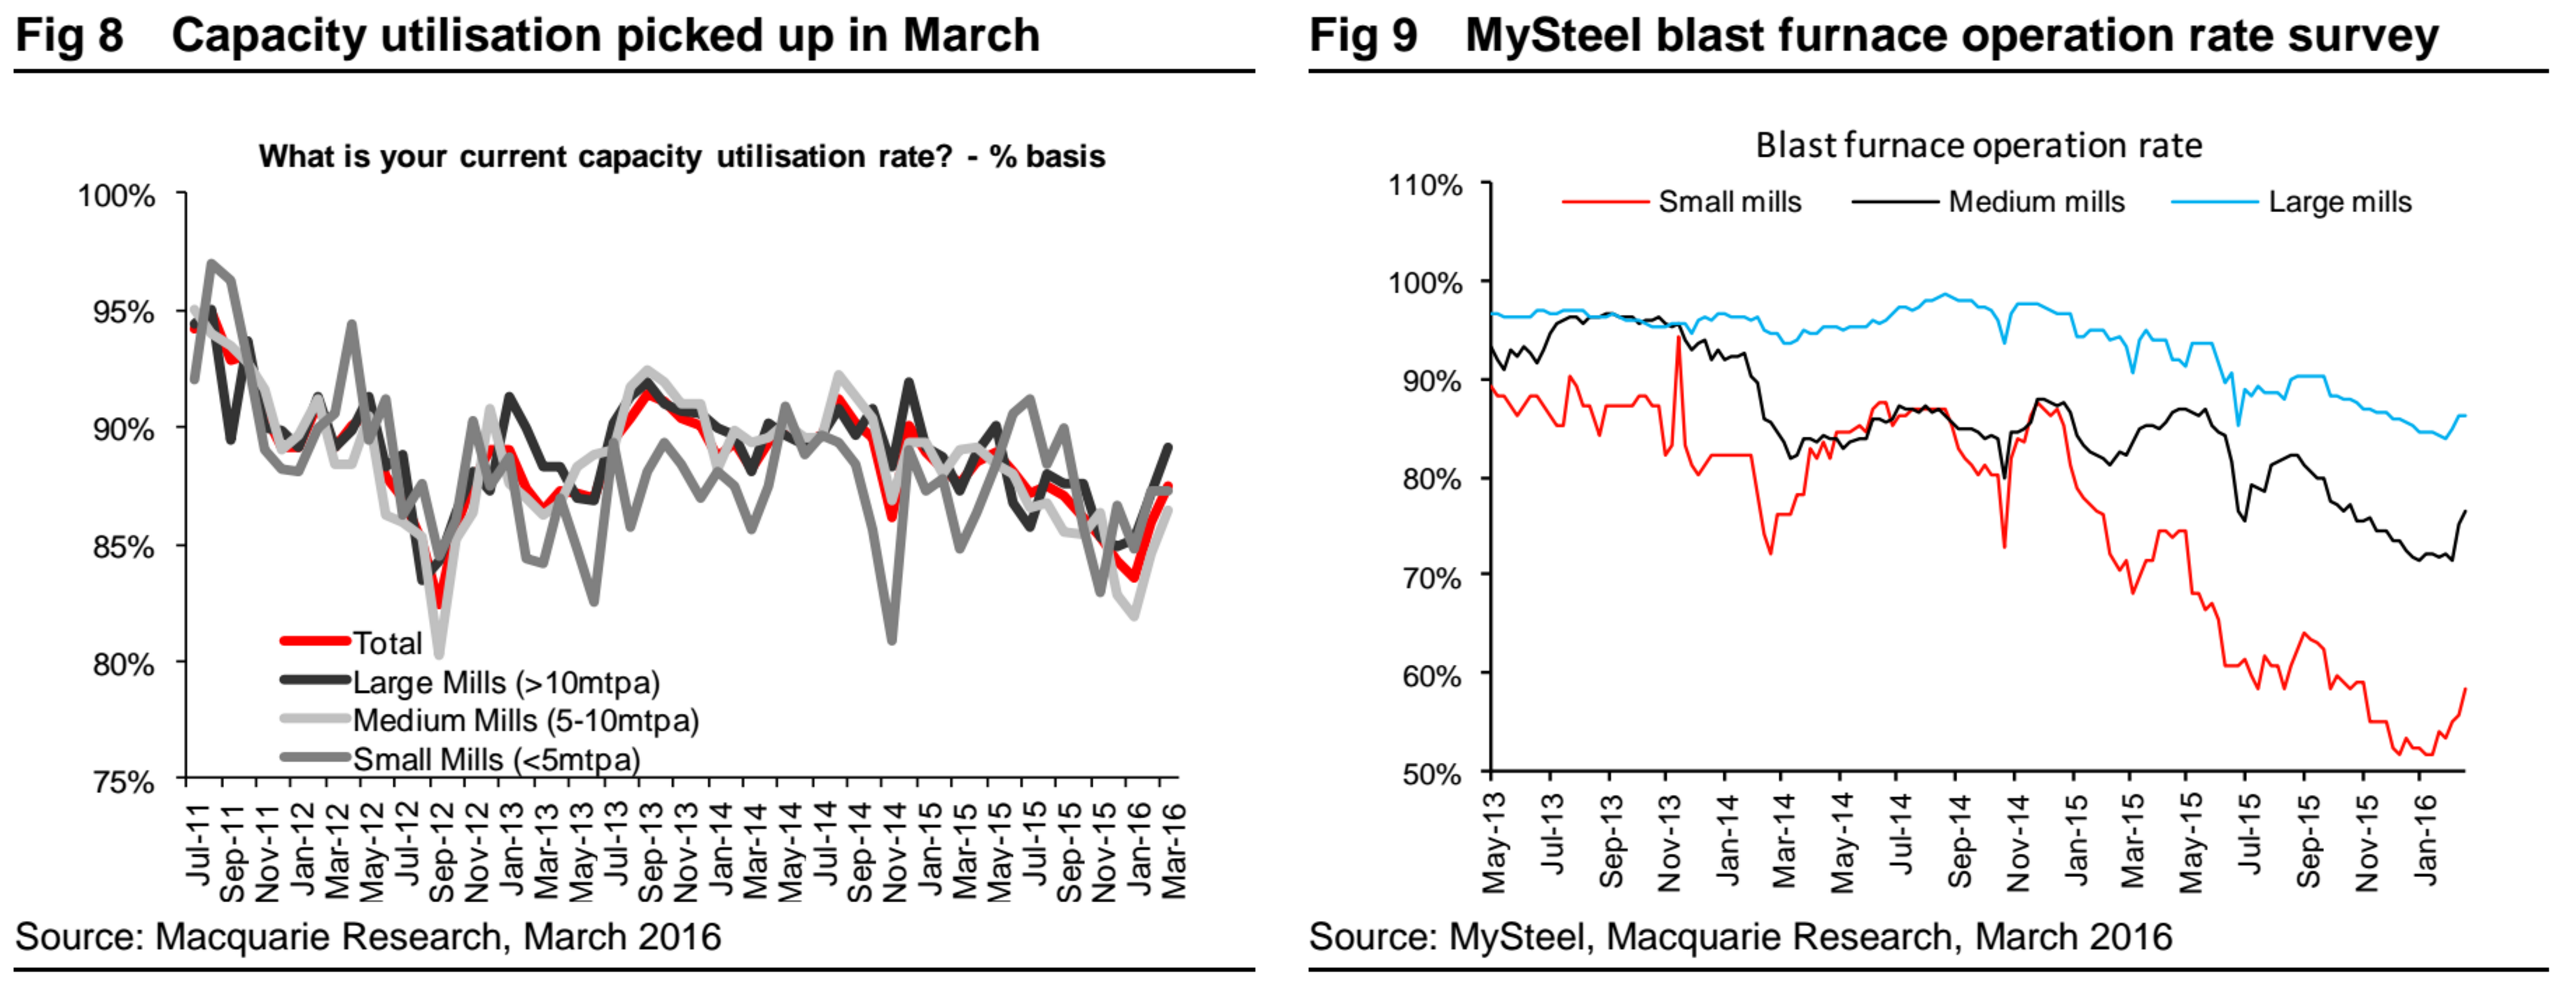
It takes a few weeks to fire up idled furnaces, even so, the response is unusually slow suggesting either mills don’t want to disrupt price appreciation or authorities are preventing them from restarting owing to restructuring, pollution, flowers etc.
