Daily iron ore price update (2011)

Advertisement

Here are the iron ore charts for February 16, 2016:

Capture 1 4 6 123

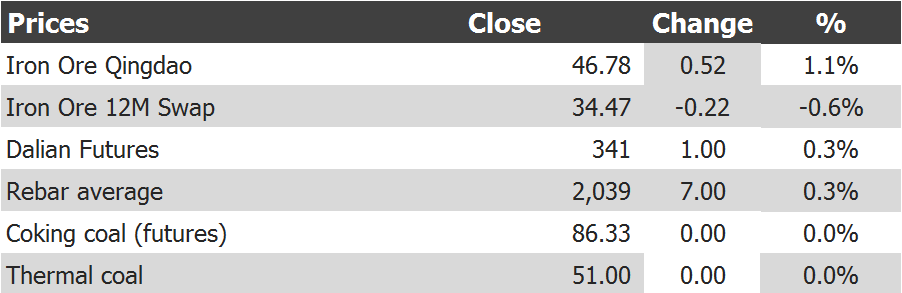
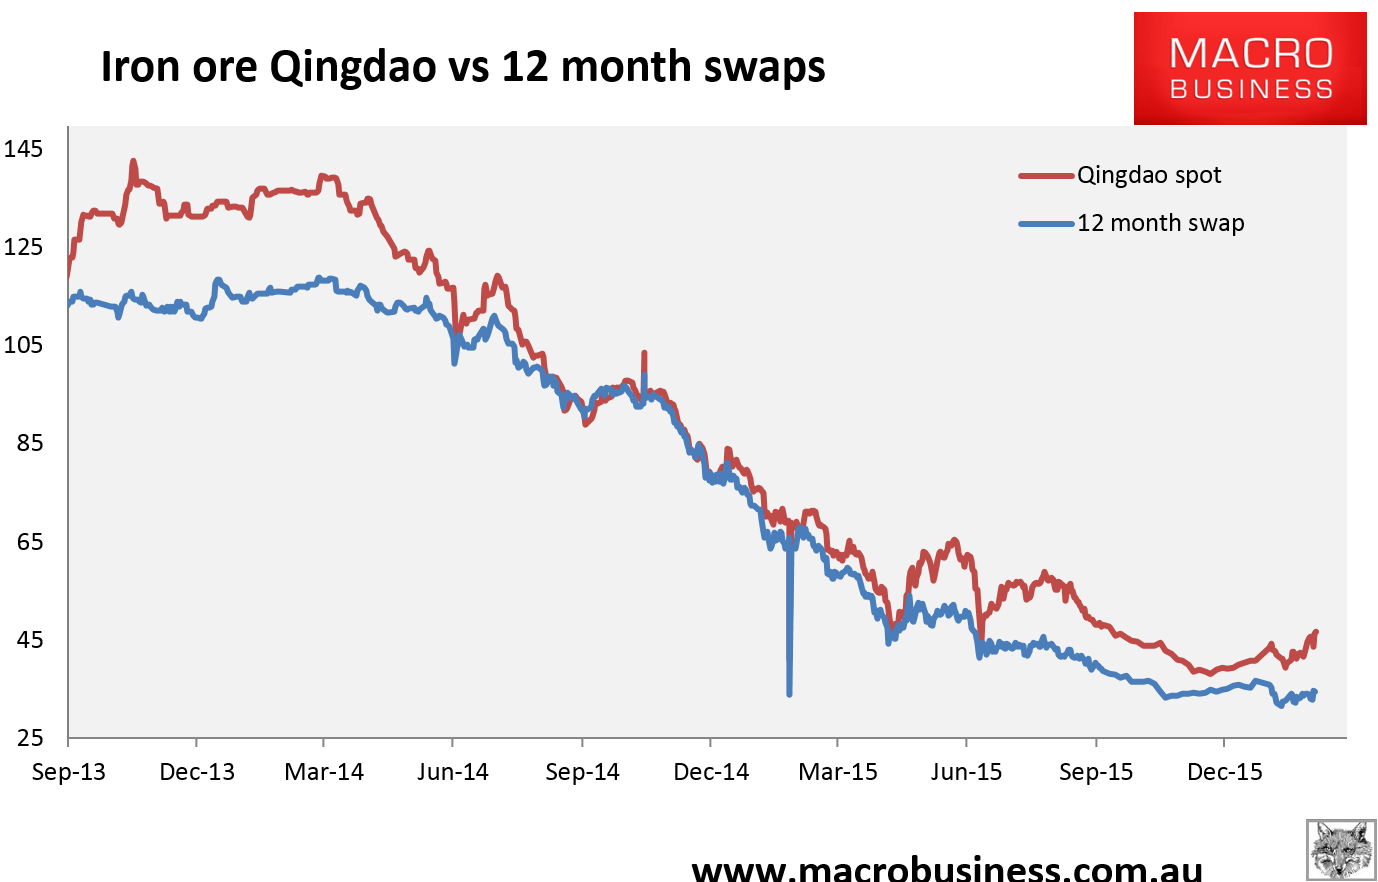
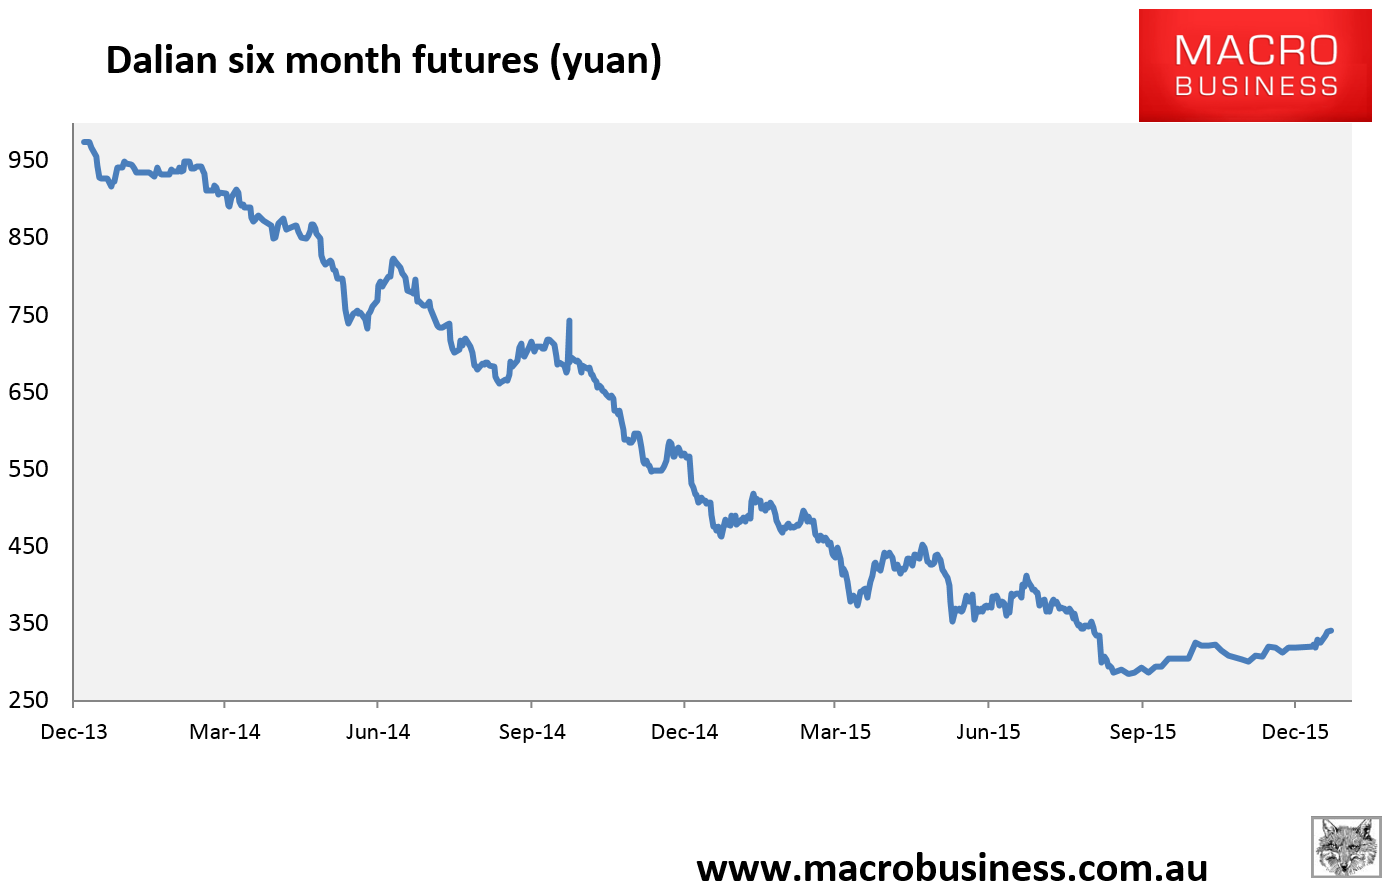
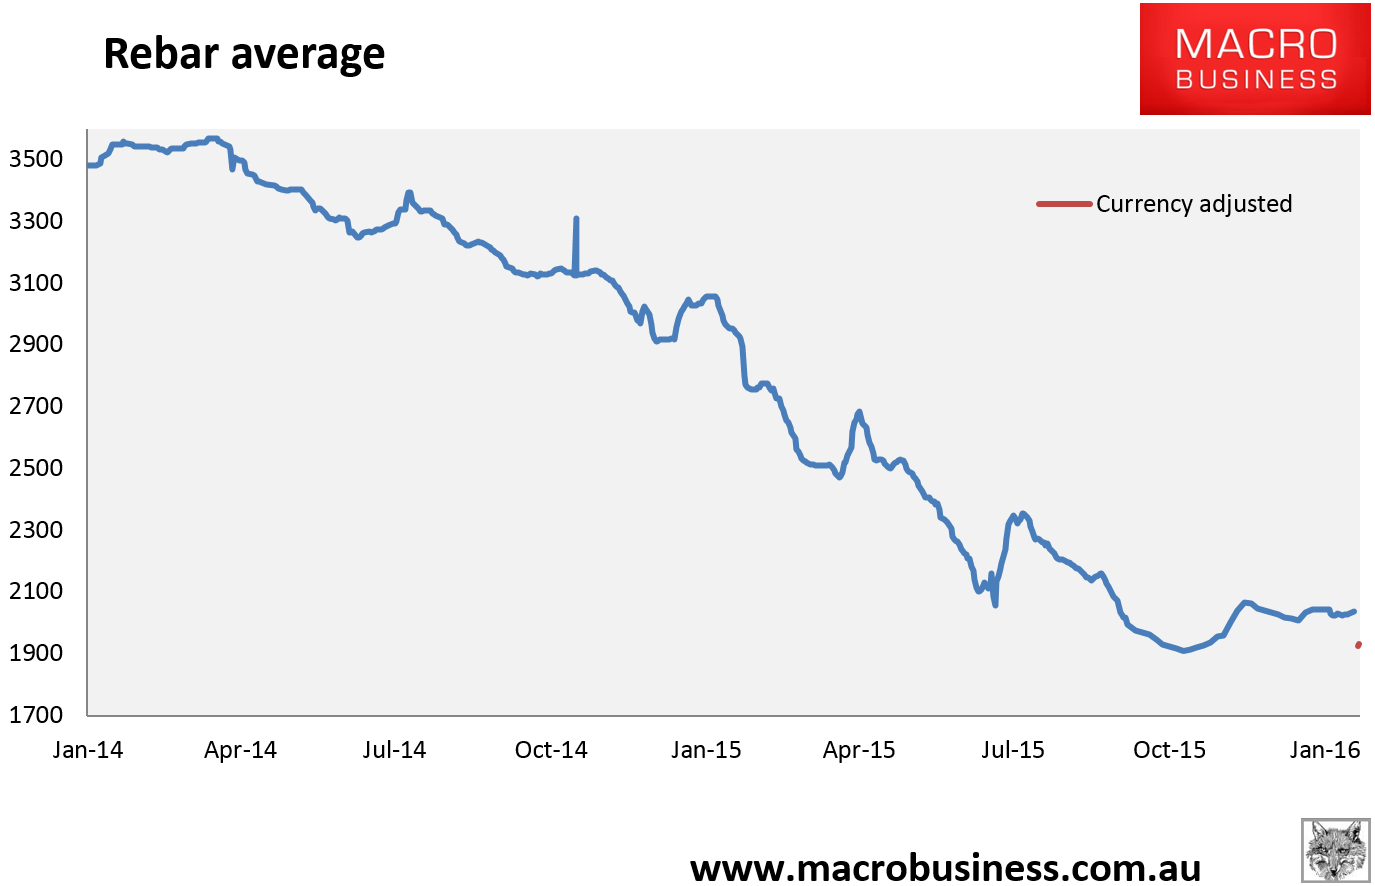
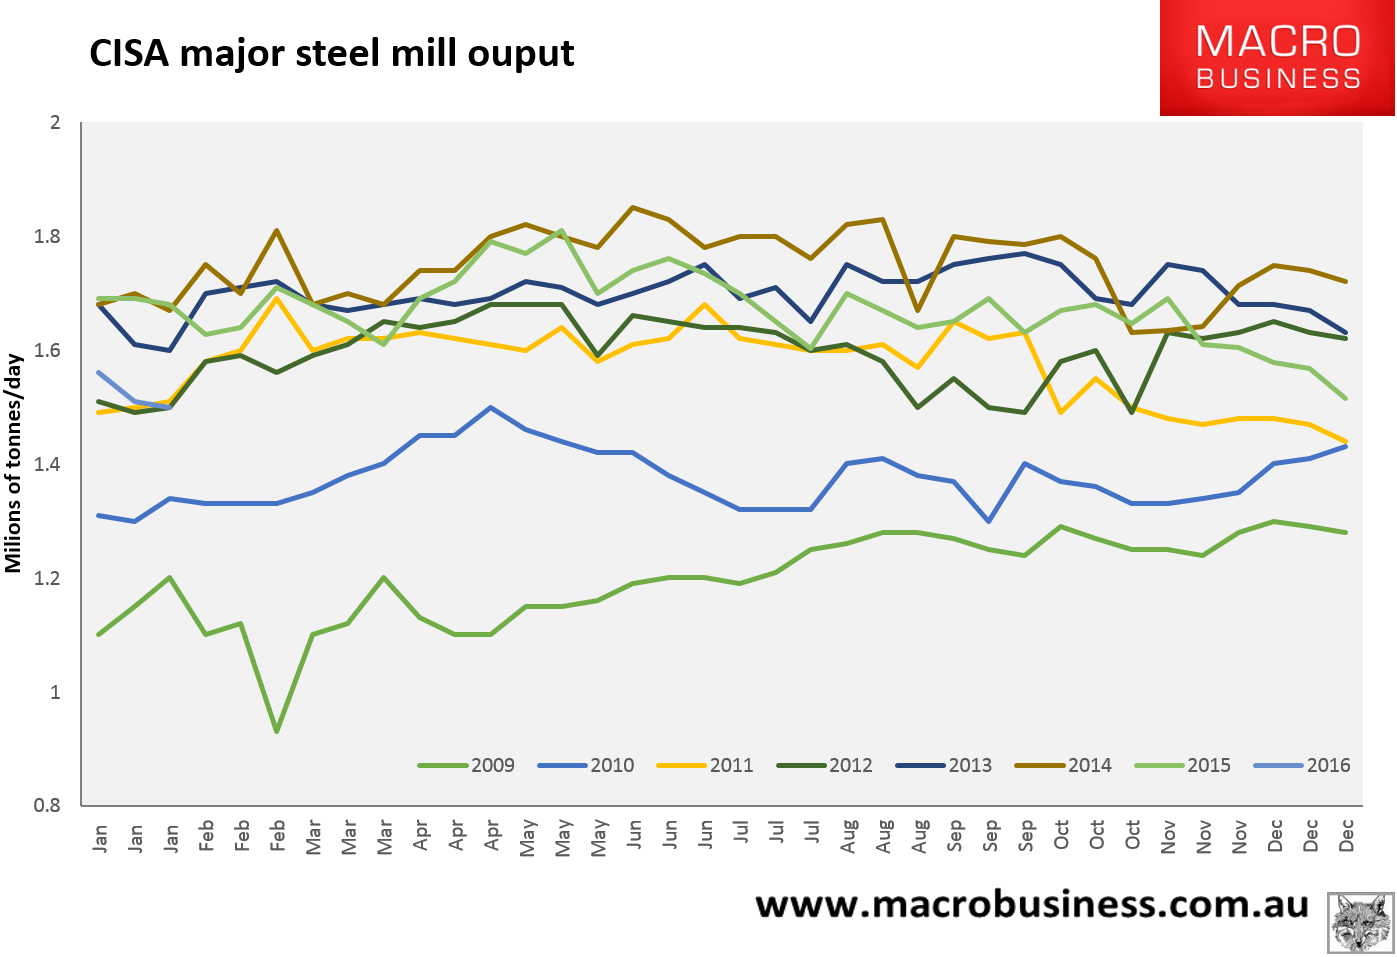
Spot firmed with Tianjin benchmark up 50 cents to $46.10. Paper softened. Rebar still holding. The last chart is the CISA fast data for late January which shows steel mills cutting output another -0.5% to 1.5 million tonnes per day, below 2011 levels for the same period. In that year China produced 695.5mt only!

The restock will run as far as it needs to then we’ll crash again.

Advertisement

The full text of this article is available to MacroBusiness subscribers

$1 for your first month, then:
Cancel at any time through our billing provider, Stripe
About the author
David Llewellyn-Smith is Chief Strategist at the MB Fund and MB Super. David is the founding publisher and editor of MacroBusiness and was the founding publisher and global economy editor of The Diplomat, the Asia Pacific’s leading geo-politics and economics portal. He is also a former gold trader and economic commentator at The Sydney Morning Herald, The Age, the ABC and Business Spectator. He is the co-author of The Great Crash of 2008 with Ross Garnaut and was the editor of the second Garnaut Climate Change Review.