
Unless you’ve been living on Mars, everyone knows that the oil price has taken a shellacking in recent months with the WTI contract nearly halving since the May-July 2015 high:
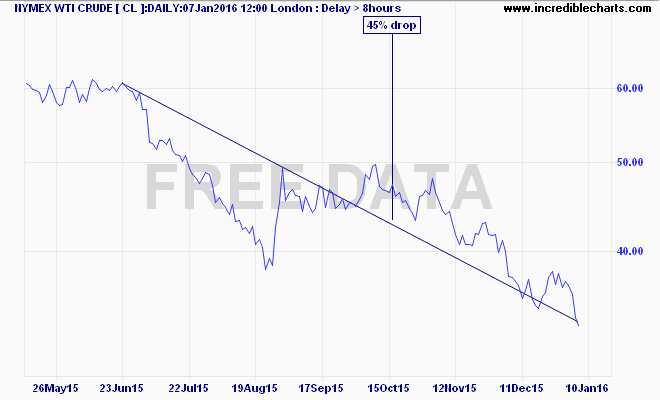
But what about prices at the pump?
From the Australian Institute of Petroleum comes the national average weekly chart over the same time period:
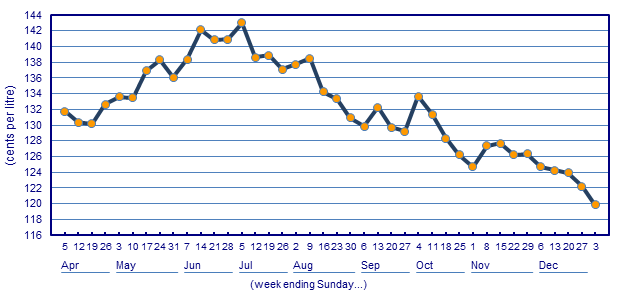
Thats a drop from 143 cents to 120 cents, but only 13% contraction in pump prices.
Hmm. A welcome change but what about the difference with WTI and Brent Crude (also down around 40%) – well, its the TAPIS and Singapore unleaded price that matters locally due to refiner margins.
Here’s the relevant chart, similar timeframe:

Falls in the circa 25% region here – still short of the 13% drop. But we’re missing one crucial element (apologies for those who know whats coming) – the fall in the Australian dollar.
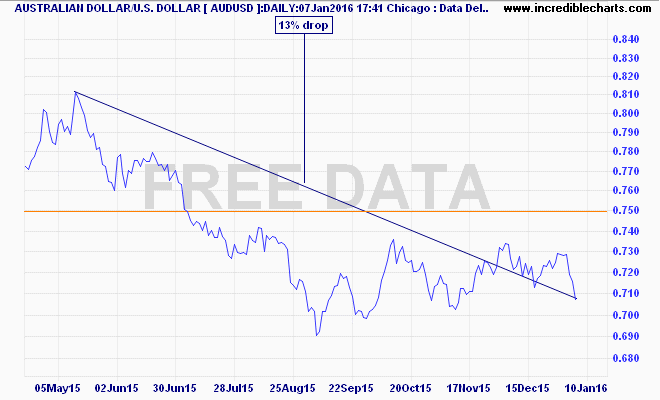
And how far has it fallen since late May (and including the usual one to two week lag from spot price to refinery to bowser)?
From a peak of just above 80cents to the USD, now just above 70 cents, or around 13% fall:
Energy prices are one area where tradeable inflation is not yet making a mark due to the fall in the Aussie dollar. But this is only due to external factors, namely the failed Saudi strategy in trying to swamp the US shale oil market and not make cuts in production.
History shows oil can spike and fall 50% within months. If the Australian dollar does not appreciate on the next spike, get ready to be shafted at the pump.