Here are the iron ore charts for December 22, 2015:
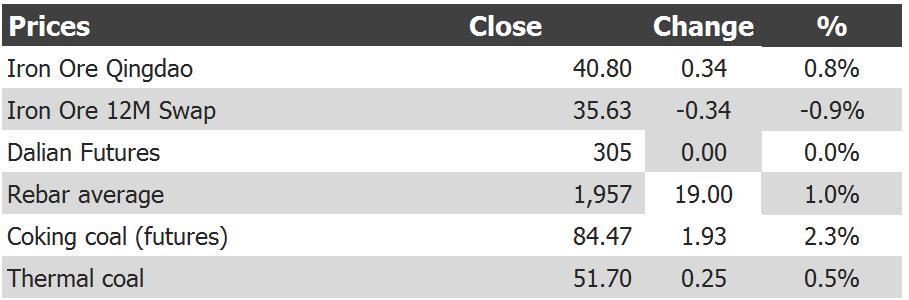
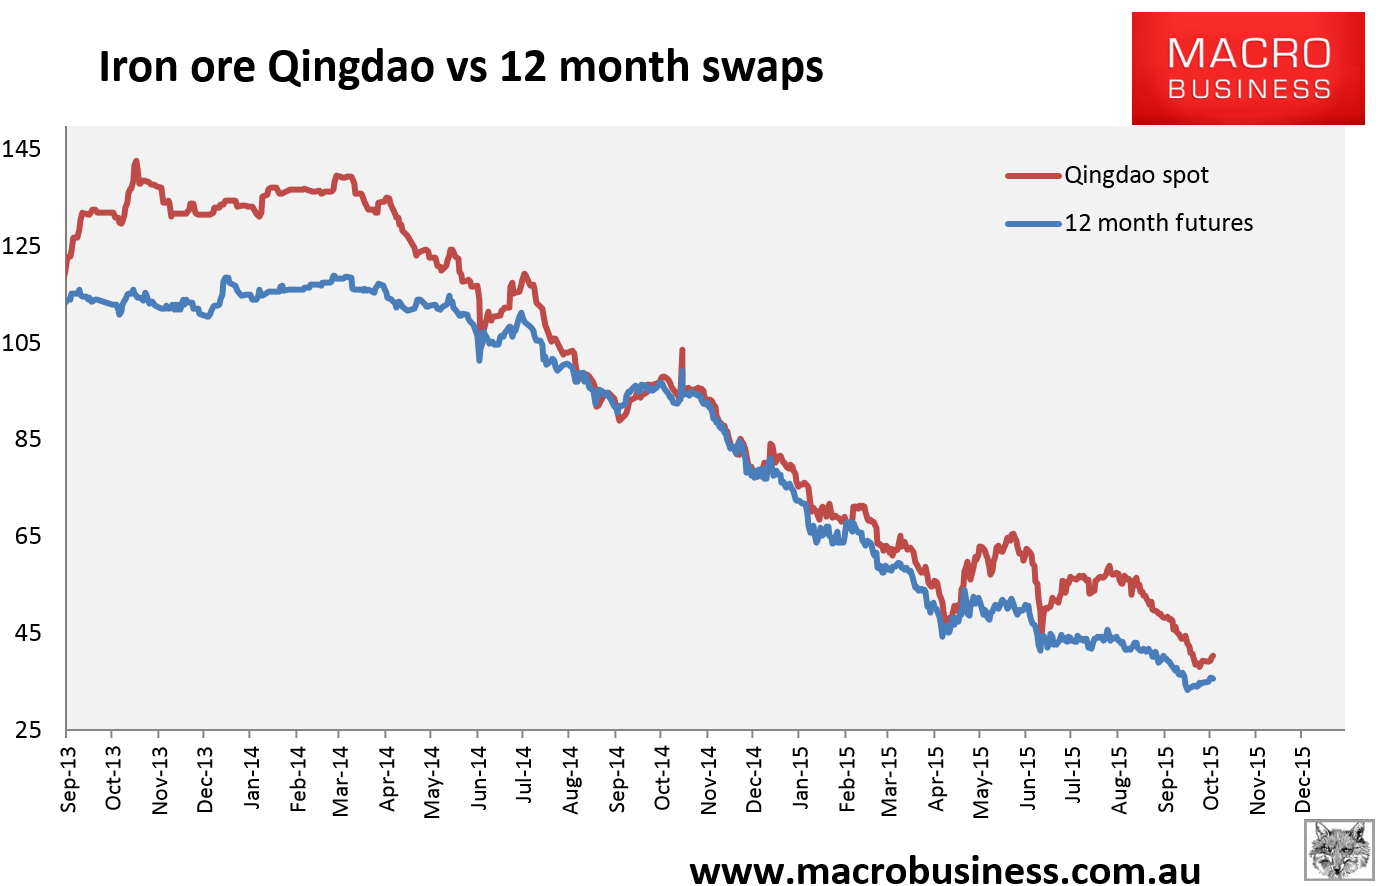
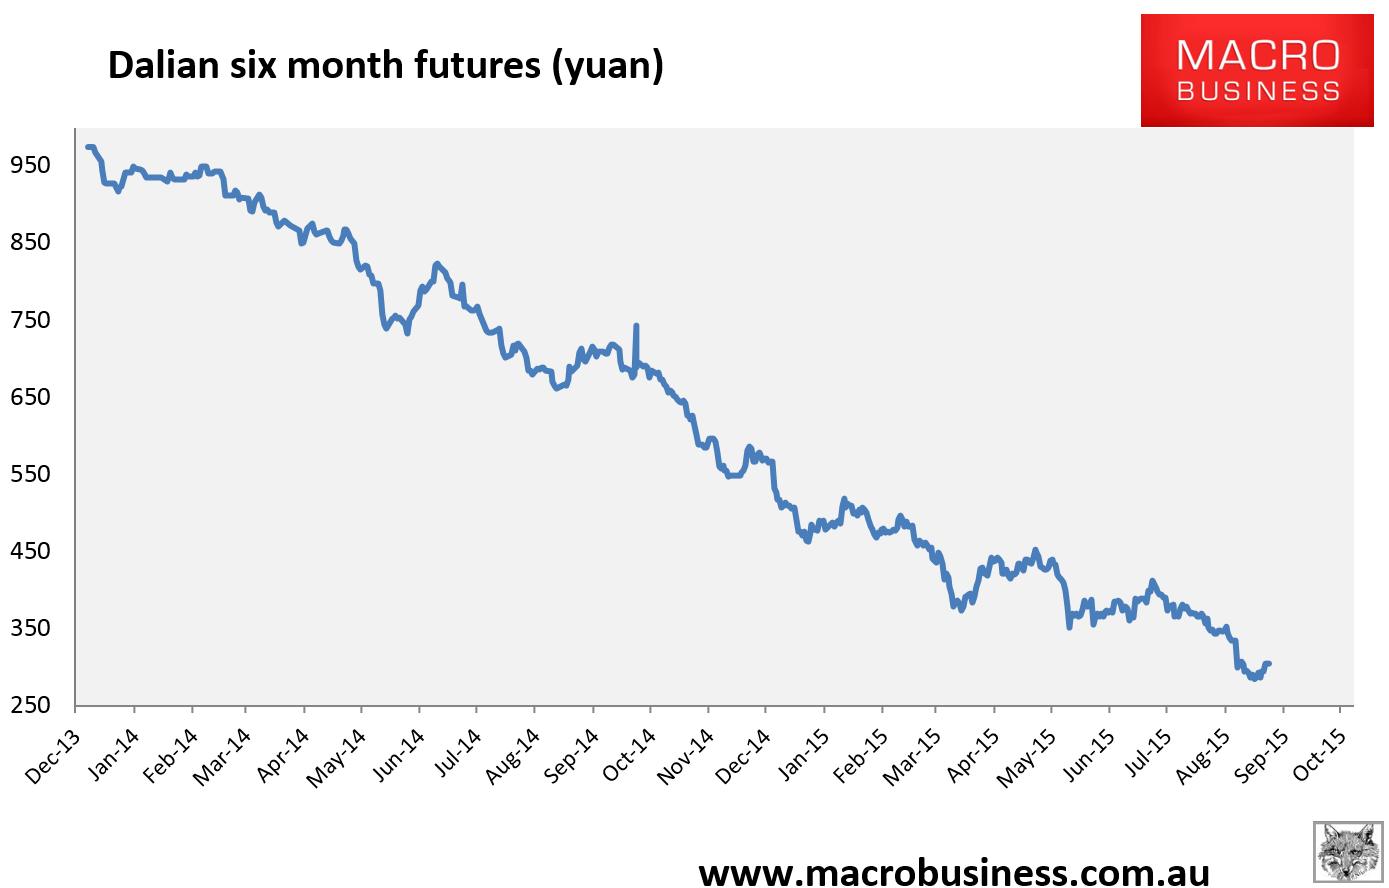
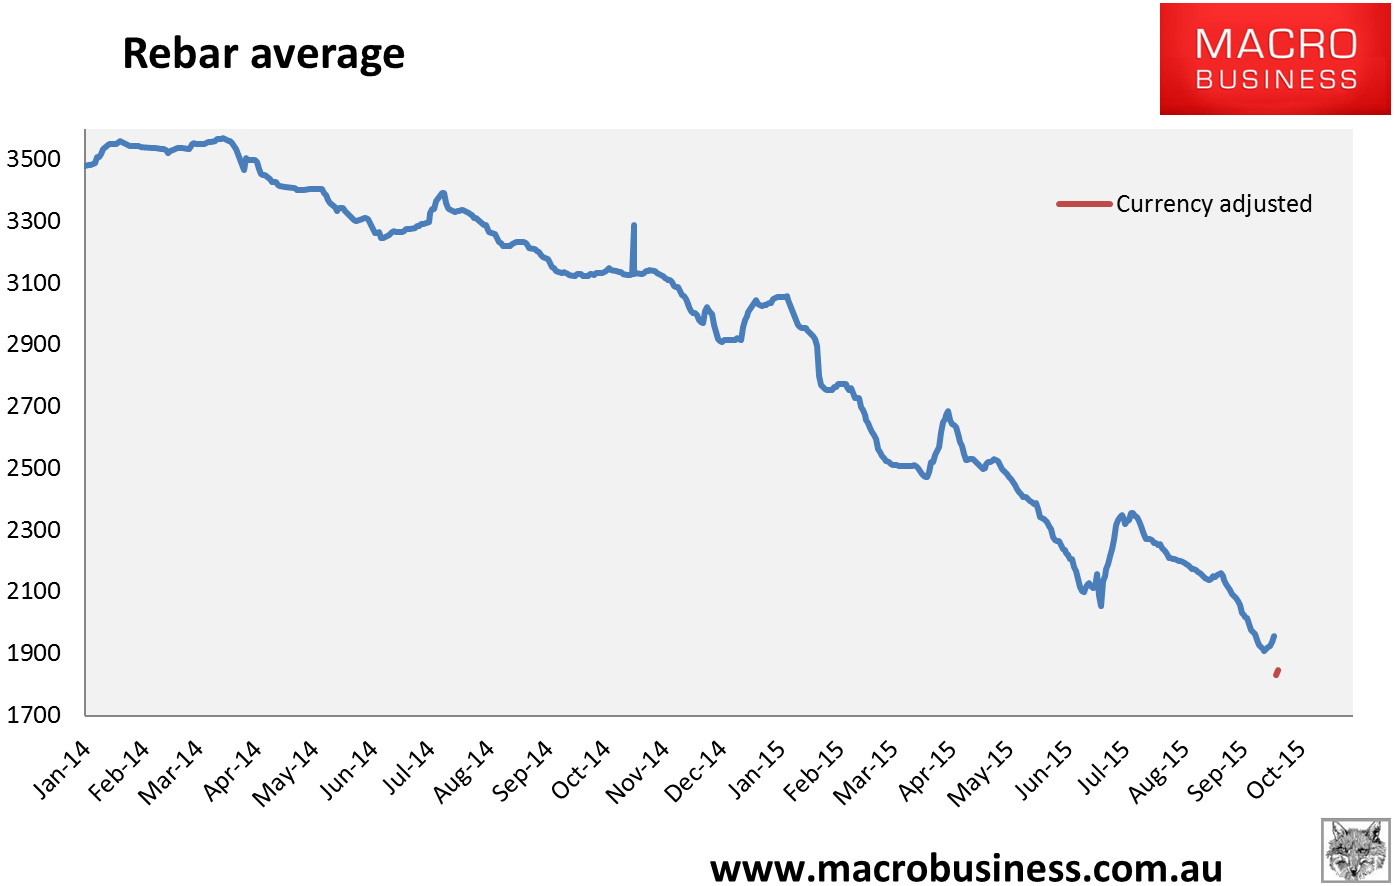
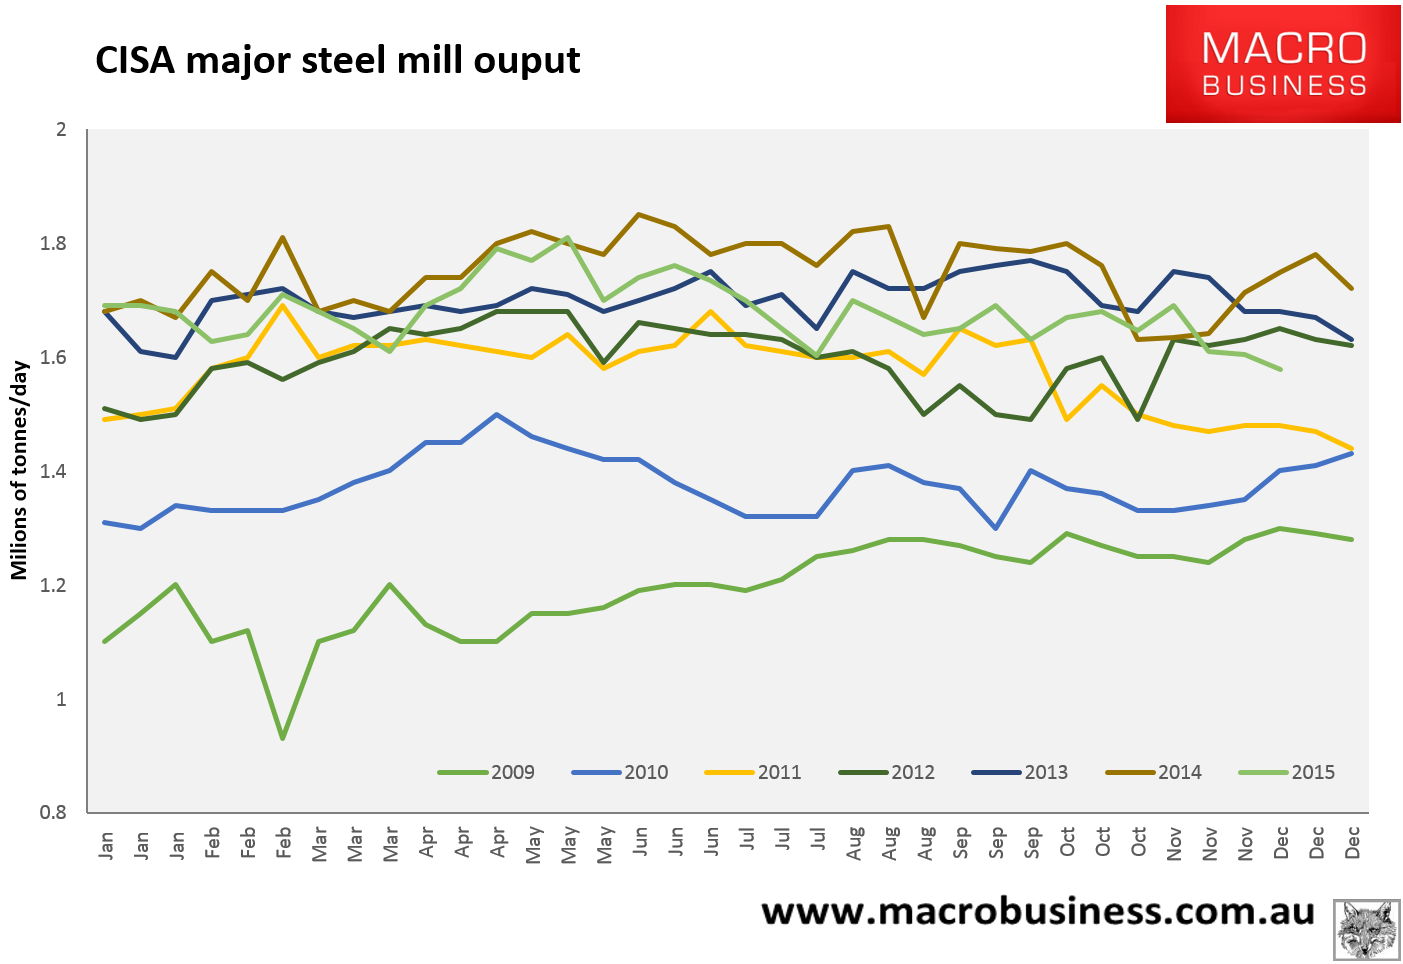
Spot still rising with Tianjin jumping 2% to $40.20. Paper is fading with Dalian unchanged. Rebar average took off too. But if you want to know what’s happening (and forthcoming) look no further than the last chart, CISA major steel mill output for the first ten days of December, down 9.8% year on year for the comparable week. If annualised, that figure equals a fall in steel production of 80.6 million tonnes (mt) to 740mt. In iron ore terms that is a staggering 134mt lower requirement than last year. It is not fair to annualise 10 days of production but it is indicative of how weak demand is and underlines the “step down” in production that we appear to be undergoing. The average for the year is still down 4%, 32mt of steel or 51.6mt of iron ore, and the last six months is down 5.7%, 47mt of steel or 76mt of iron ore. It’s accelerating. Nobody has this outcome in their numbers but increasingly it is in prices regardless.
And the export pressure valve for Chinese steel is still closing, from Bloomberg:
The full text of this article is available to MacroBusiness subscribers
