
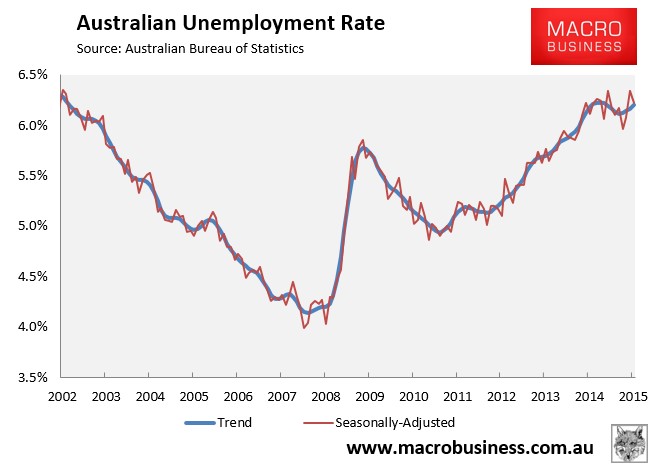
As summarised earlier, the Australian Bureau of Statistics (ABS) today released labour force data for the month of August, which registered a small fall in the headline unemployment rate (from 6.3% to 6.2%) with 17,400 jobs added.
The result compared to analyst’s expectations that the unemployment rate would fall to 6.2% with 5,000 jobs created.
In trend terms, the unemployment rate rose ever so slightly but because of rounding remained at 6.2%:
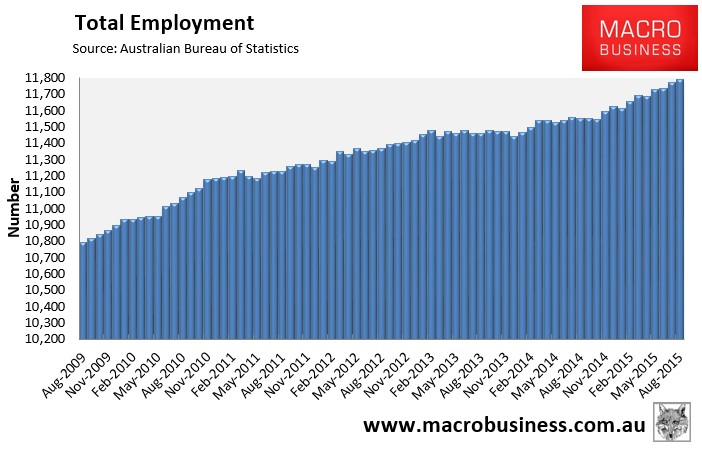
Again, total employment rose a seasonally adjusted 17,400 to 11,775,800, with full-time employment increasing 11,500 to 8,141,000 and part-time employment increasing 5,900 to 3,634,800.
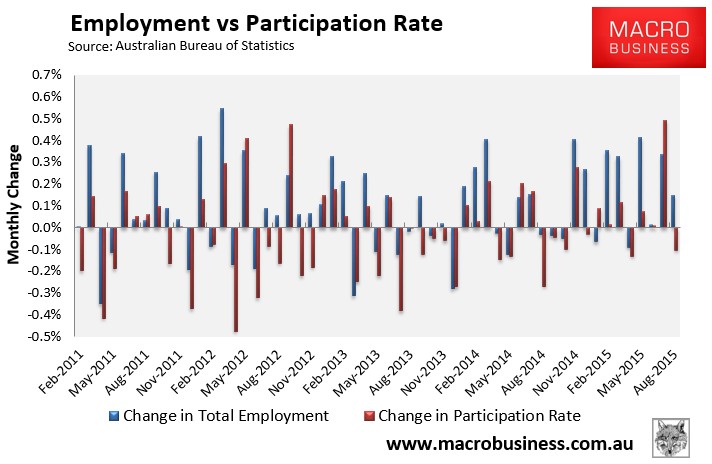
The concern that unemployment could rise on the back of new Newstart rules also proved unfounded, with the labour force participation rate falling by 0.1% to 65.0%:
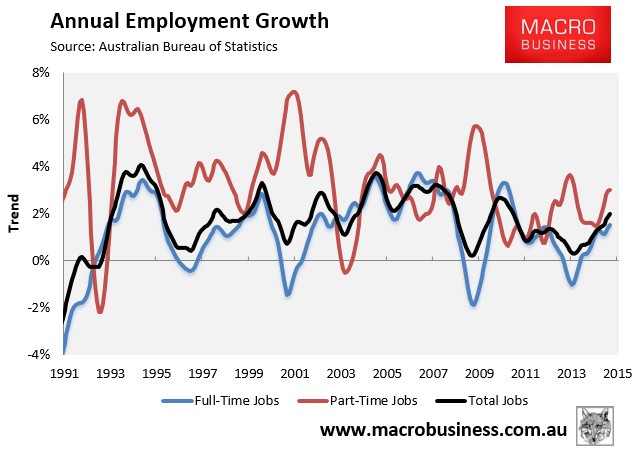
The trend in total employment remains strong:
Although, annual employment growth is being driven primarily by part-time employment (+3.0% trend; +3.0% seasonally adjusted), with full-time jobs growth (+1.5% trend; +1.6% seasonally adjusted) much weaker:
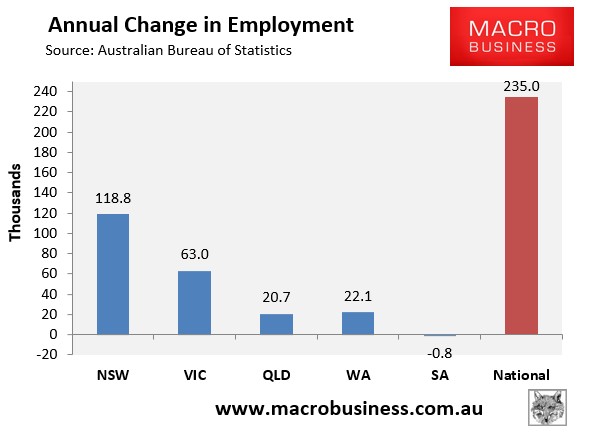
The housing bubble epicentres of New South Wales (Sydney) and Victoria (Melbourne) have clearly driven jobs growth over the past year in seasonally adjusted terms, accounting for 77% of national jobs growth (see next chart).
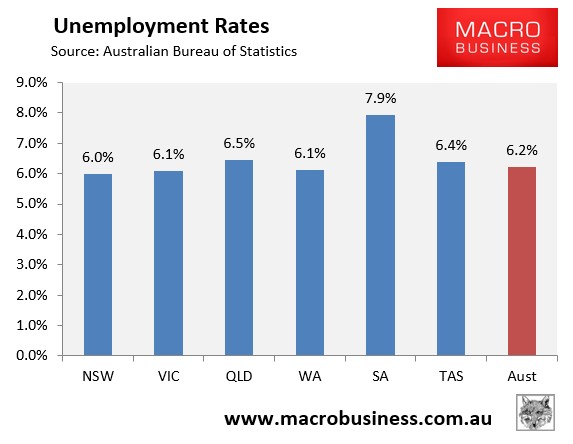
And South Australia has by far the highest seasonally adjusted unemployment, whereas New South Wales has the lowest (see next chart).
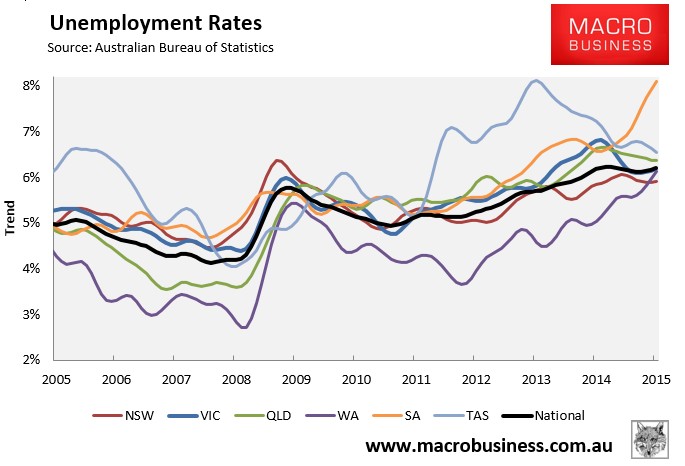
The state seasonally-adjusted figures are notoriously volatile and subject to a big margin of error. As such, the below chart shows the ABS’ trend unemployment rates, which shows New South Wales with the lowest unemployment (and trending down), Western Australia and South Australia with worsening trends (and South Australia’s at 8.1%), and Tasmania, Queensland and Victoria with improving trends:
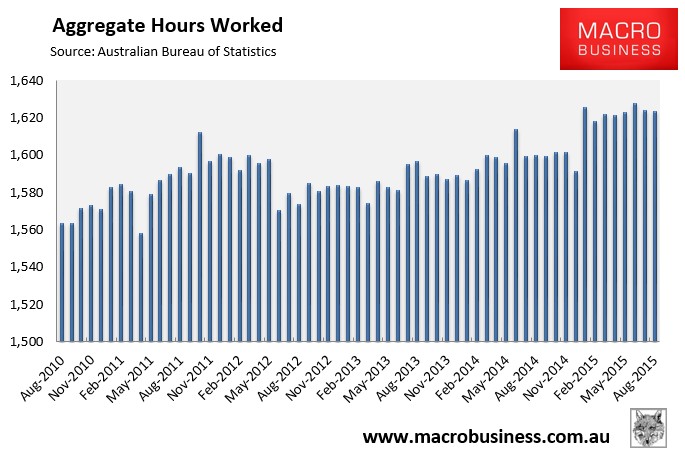
The aggregate number of hours worked fell marginally in seasonally adjusted terms in August (down 0.6 million hours or 0.04%), although it has been fairly flat for six months. Hours worked have also risen by 1.5% over the past year, which is slightly above the growth in the population:
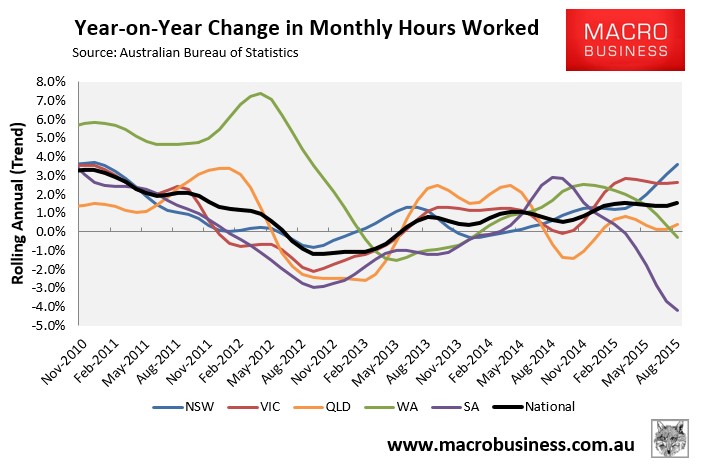
The below chart, which tracks the changes in hours worked on a trend basis, shows a mixed bag across the states (and a crash in South Australia) and a slightly improving trend nationally (+1.5% YoY):
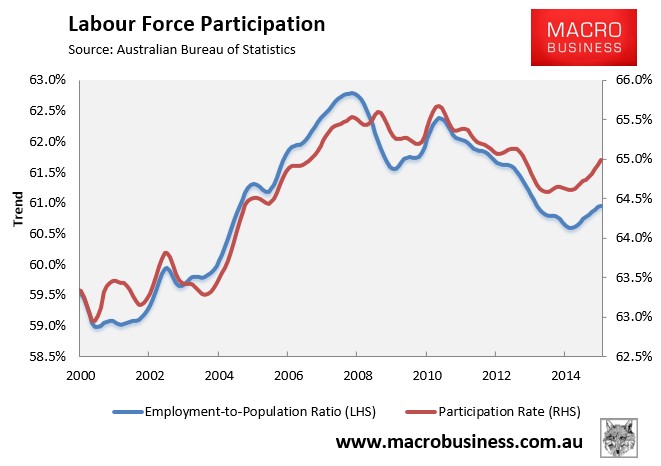
The trend participation rate continues to recover, as does the employment-to-population ratio:
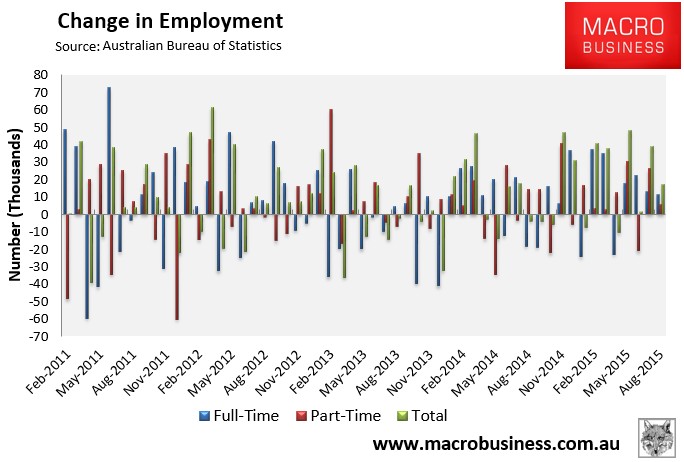
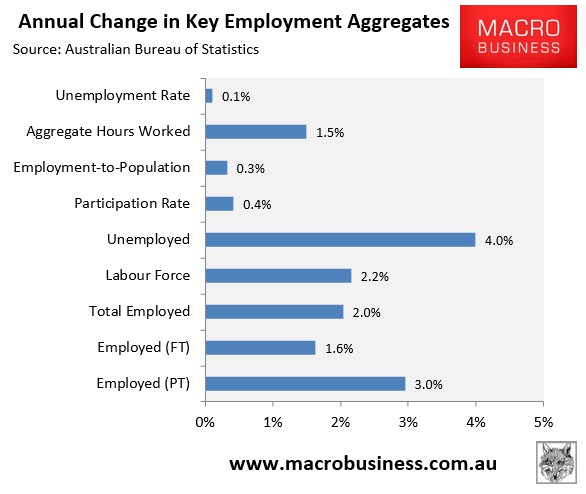
Finally, to round things out, the next chart summarises the annual change in the key employment aggregates on a seasonally-adjusted basis:
Overall, this release continues the theme that has developed over the past six months, whereby the bubble in Sydney and Melbourne housing prices, and the construction surge that has followed, has driven employment growth across these two jurisdictions, more than offsetting weakness in Western Australia and South Australia.
This momentum will likely continue for the remainder of this year and possibly the start of the next.
The concern for employment is 2016-17 when cratering mining investment and the closure of the car industry is likely to meet falling dwelling construction and prices as the bubble deflates.
