
by Chris Becker
Predictions continue to be hard to make about the future, but there is no doubt that the most recent run up in Chinese equity prices was (is?) a bubble.
And here’s another nail in the coffin to the “its all over” thesis. From Research Affiliates, via history squared, comes this chart tracking the monthly trailing price/earnings (P/E) ratio of the NASDAQ in 2000, the Nikkei 225 in 1989 and the Shanghai Composite currently:
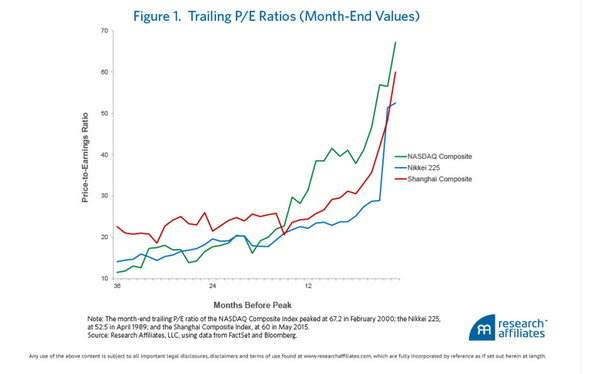
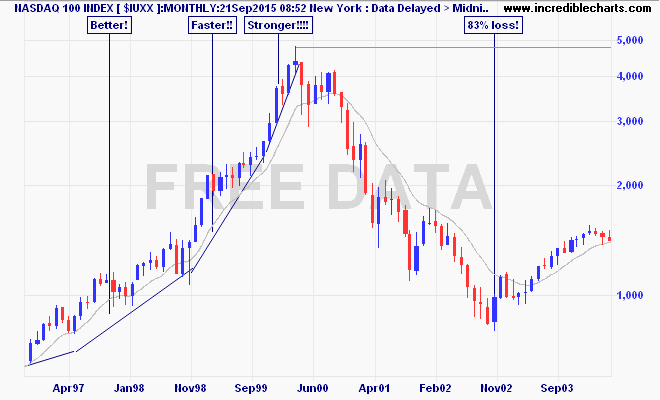
The outcome for Japanese and equities and the NASDAQ Composite was an epic slump, the latter losing over 80% in value:
Advertisement
Chinese authorities intervened in the market yesterday, dragging the bourse up again by over 1% but this is a losing battle.