
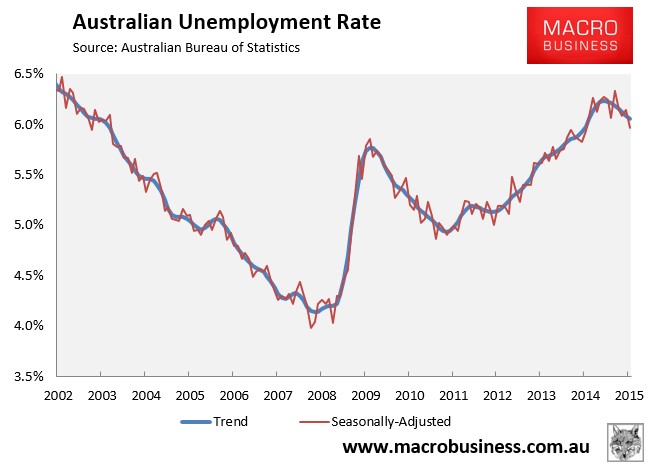
As summarised earlier, the Australian Bureau of Statistics (ABS) today released labour force data for the month of March, which registered a large drop in the headline unemployment rate (from 6.2% to 6.0%).
The result beat analyst’s expectations, who had expected the unemployment rate to hold steady at 6.2%, but with 15,000 new jobs created.
In trend terms, the unemployment rate also improved to 6.0% in May from April’s 6.1%:
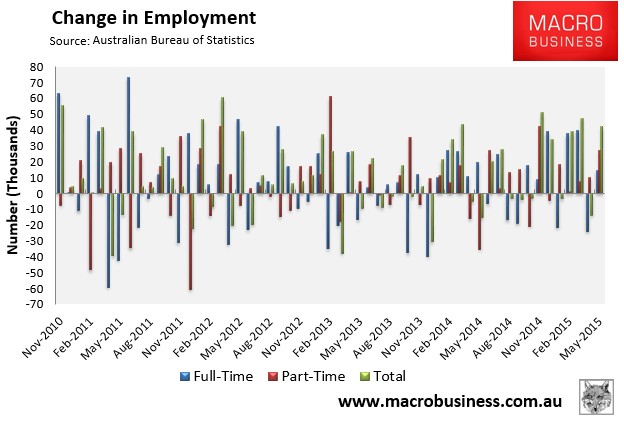
Total employment jumped a seasonally adjusted 42,000 to 11,759,600, with full-time employment increasing 14,700 to 8,128,600 and part-time employment increasing 27,300 to 3,630,900.
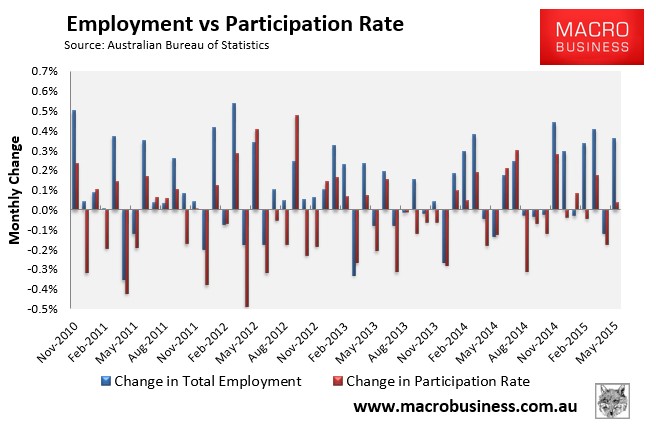
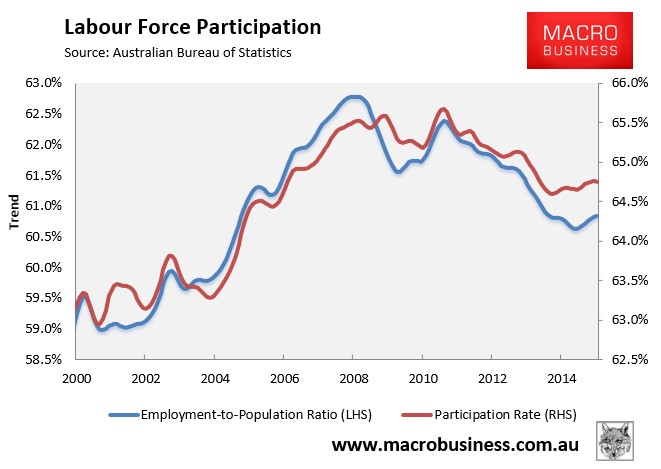
Meanwhile, the Participation rate remained steady at 64.7%.
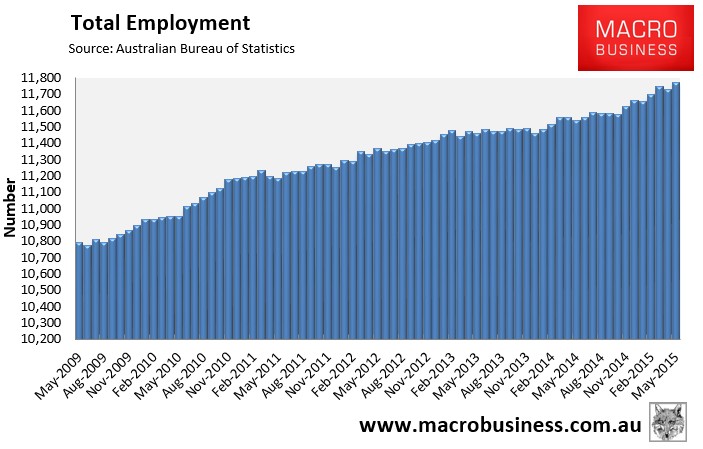
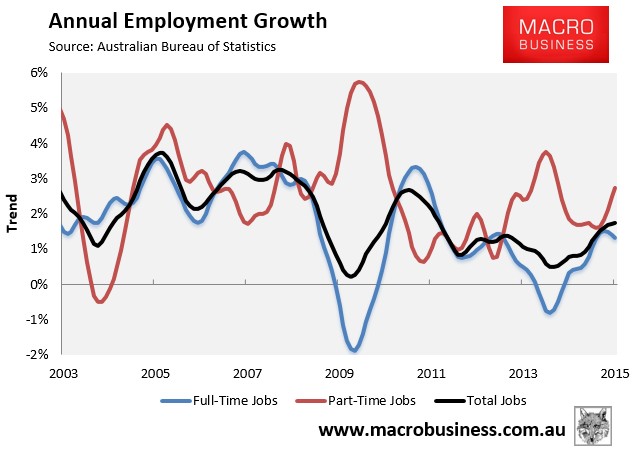
The trend in total employment has improved since October 2014 (see next chart).
But full-time jobs growth (1.2% seasonally adjusted, 1.3% trend) is weakening once more (see next chart).
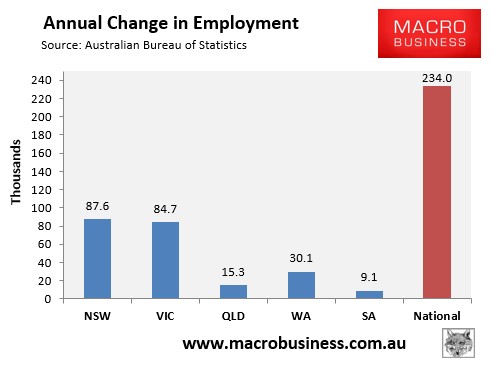
The housing bubble epicentres of New South Wales (Sydney) and Victoria (Melbourne) have driven jobs growth over the past year in seasonally adjusted terms (see next chart).
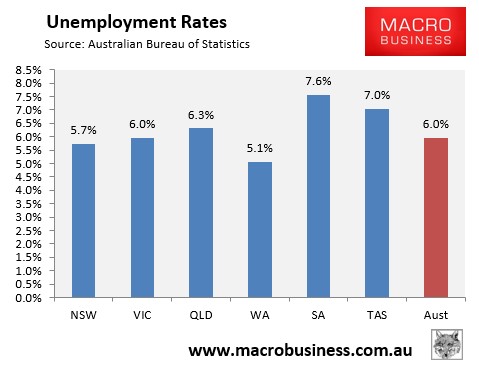
And South Australia and Tasmania now have the highest seasonally adjusted unemployment on the mainland, whereas Western Australia and New South Wales have the lowest (see next chart).
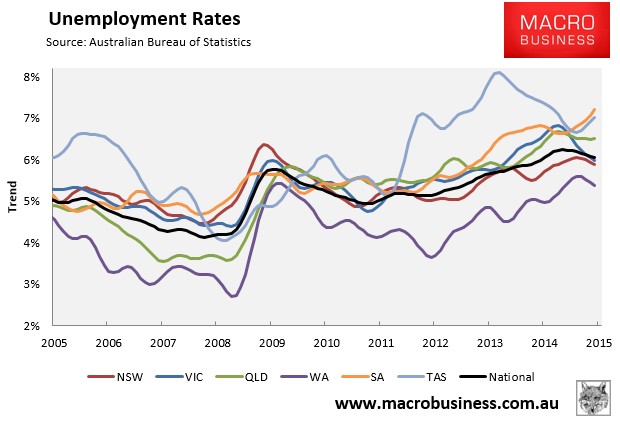
The state seasonally-adjusted figures are notoriously volatile and subject to a big margin of error. As such, the below chart shows the ABS’ trend unemployment rates, which shows Western Australia with the lowest unemployment (and falling), South Australia, Tasmania and Queensland with the highest, and Victoria’s and New South Wale’s improving:
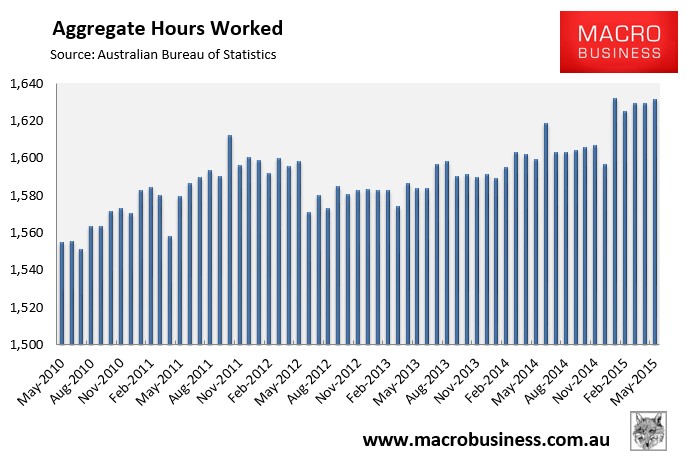
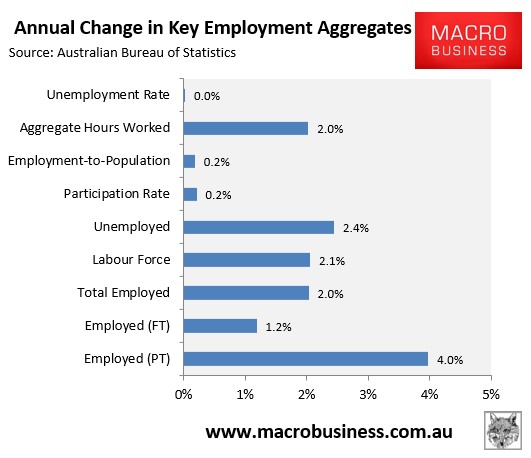
Aggregate number of hours worked rose in seasonally adjusted terms in May (up 2.2 million hours or 0.1%), although it has been fairly flat for five months. It has also risen by 2.0% over the past year, which is slightly above the growth in the population:
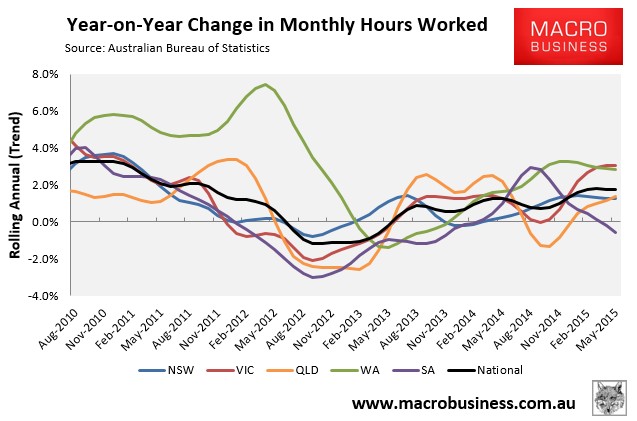
The below chart, which tracks the changes in hours worked on a trend basis, shows a mixed bag across the states and a flat trend nationally (+1.8% YoY):
The participation rate is also recovering, as is the employment-to-population ratio:
Finally, to round things out, the next chart summarises the annual change in the key employment aggregates on a seasonally-adjusted basis:
It is important to note that there appears to be some numberwang in this month’s report, with the ABS reporting the following:
“In compiling this month’s estimates the ABS identified that the growth in employment for Western Australia, in original terms, was unparalleled compared to previous May results. Investigations showed that a significant contributor to this was change in response patterns from April to May 2015. As a result, the ABS has removed this impact from the seasonally adjusted estimates for Western Australia and subsequently, Australia. As the ABS is unable to remove this impact from the original estimates, care should be taken in comparing the original and seasonally adjusted estimates, particularly for Western Australia.”
Nevertheless, the improving labour market trend, albeit on the back of part-time employment, is welcome.
So does this warrant a change in our forecasts about the Australian economy? The short answer is no.
Undoubtedly, the labour market is being supported by record high dwelling construction and other housing-related industries, brought about by cheap credit and continued strong house price appreciation, which are having a particularly positive impact in New South Wales and Victoria. This is expected to run for a while yet, so could see unemployment continue to trend lower in the short-term.
However, the housing construction boom is unsustainable and is likely to top-out sometime later this year or early next, just as the unwind of mining investment accelerates and the local car industry shutters.
In this regard, I view the recent improvement in labour market conditions as a cyclical improvement within a deteriorating medium-term situation.
2015 was never the problem for Australia’s labour market. It is 2016 and 2017 that are the concern, as the economy faces the triple threat of falling mining-related employment; falling housing-related employment; and falling manufacturing (car industry) employment.
unconventionaleconomist@hotmail.com
