Here are the iron ore charts for June 4, 2015:
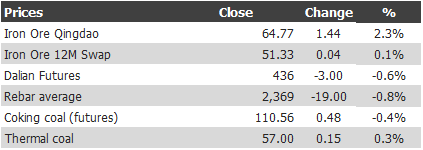
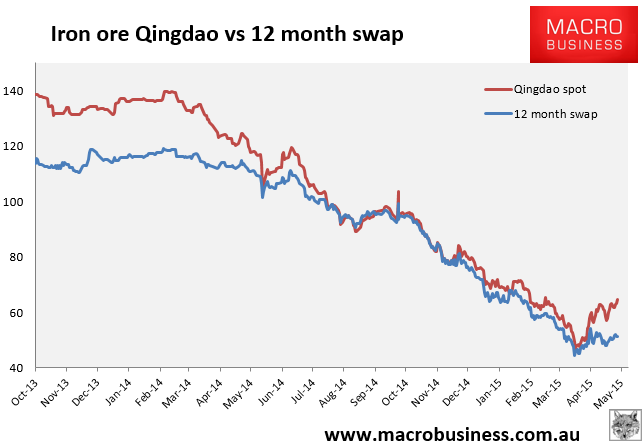
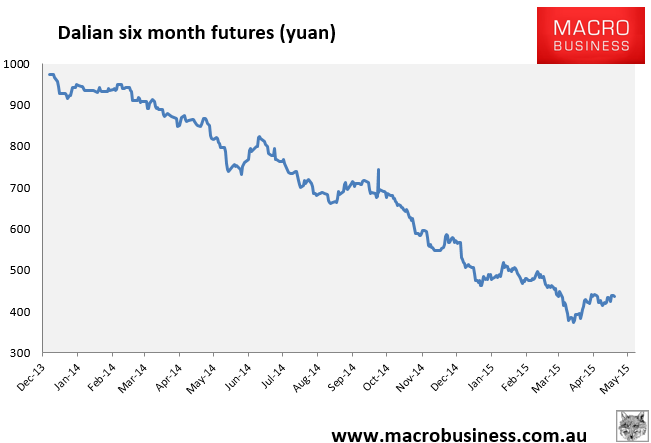
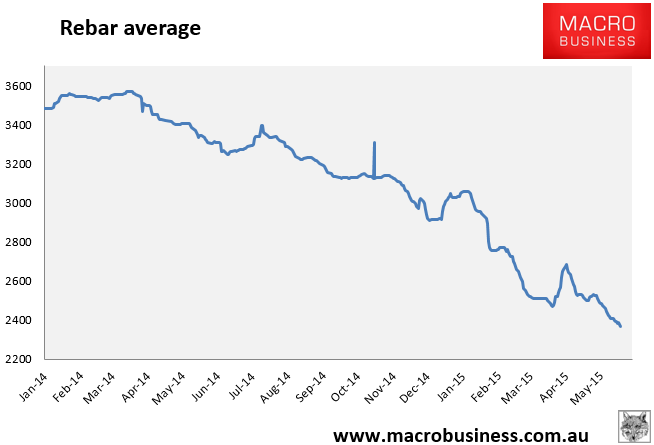
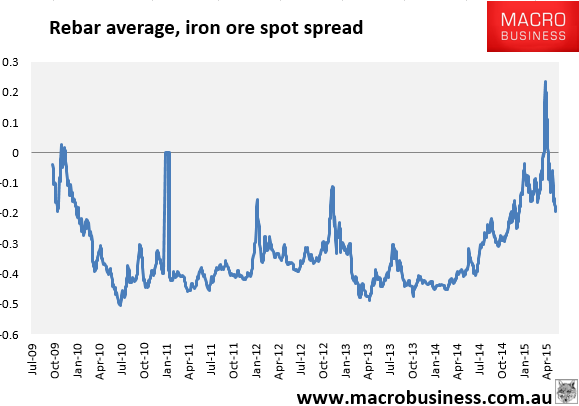
Take that in the eye, bears! Spot broke out handsomely above the bullish ascending triangle pattern identified recently. Tianjin benchmark rise 1.4% to $63.50. Paper is ignoring it with Dalian up 2 points overnight to 438 though it still has the same bullish pattern and could kick off another leg up if it breaks out. Singapore is still serenely trading sideways as rebar average is hammered lower and the free fall continues. To add to the confusion, mining equity was smashed yesterday and overnight!
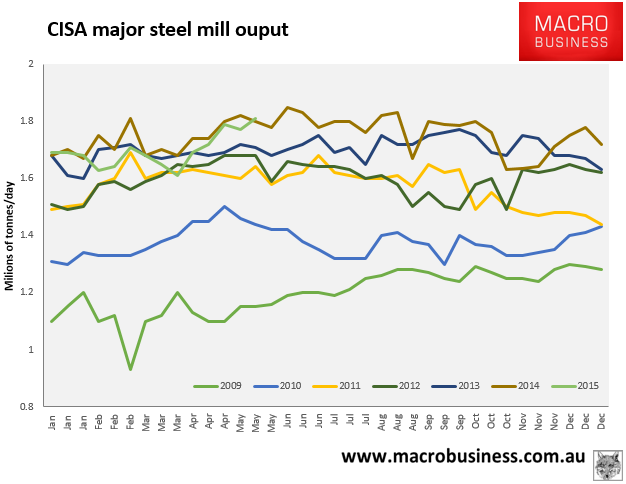
The answer to these various conundrums can be found in the last chart. CISA steel output data surged above last year for the first time this year in mid May. The year to date average is still down 1.7% but for now the mills are back and pumping I-beams. Thus they need ore even as the price of steel collapses. Needless to say this situation cannot be sustained for long as margins compress, and they are, fast: