
The report includes a bunch of interesting charts benchmarking Australian housing costs against our international peers. Below is a sample of the report’s key findings.
1) Saving for a deposit:
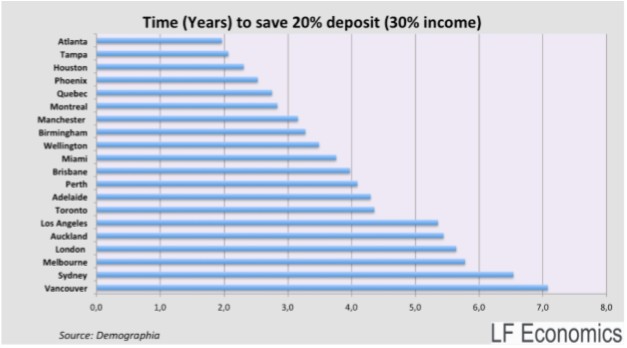
Based on median multiples, Sydney-siders will spend the better part of 6.54 years to save for a deposit on a median priced home. Of all the cities in the sample, only residents of Vancouver spend more time saving for a deposit on a home than in Sydney. Homebuyers in Melbourne, Adelaide, Perth and Brisbane will spend 5.78, 4.30, 4.09 and 3.97 years respectively to save for a 20% deposit. This stands in stark contrast to the time it takes the majority of Americans living in major cities to save for a deposit. Residents of Tampa, Houston, Atlanta and Phoenix spend 2.07, 2.32, 2.47 and 2.53 years respectively saving. Los Angeles, the second largest city in the US ranked 6th in the sample.
2. Time to pay off principal:
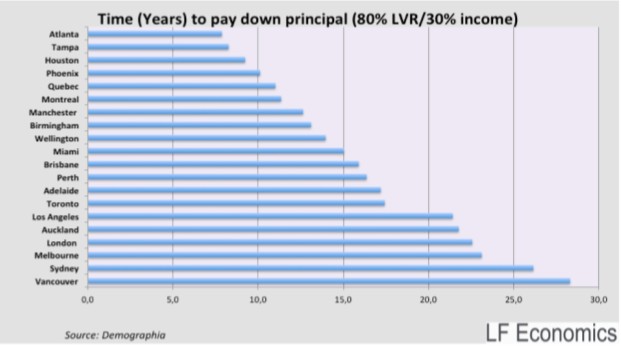
If 30% of today’s household income was allocated to paying just the principal on a home loan and it takes more than 15 years, we believe this represents ‘significant homebuyer mortgage stress’ and ‘severe mortgage affordability constraints’…
For residents of Sydney and Melbourne, it would take 26.15 and 23.12 years respectively to pay just the principal of an 80% LVR loan using 30% of today’s household income. In Tampa and Houston, it would take just 8.26 and 9.23 years respectively.
3. Years to own home outright before interest (30% of income):
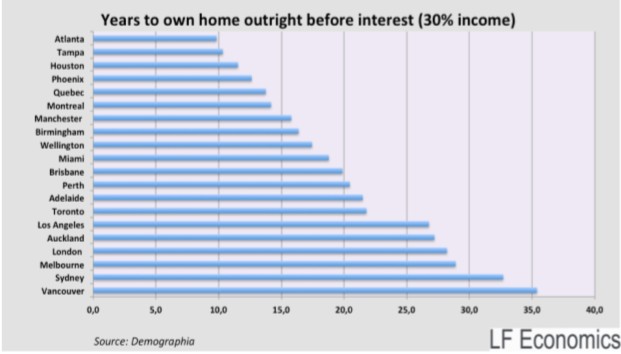
… using 30% of income to pay down principal before interest… it would be mathematically impossible, as per the calculated formula, for residents of Vancouver, Sydney, Melbourne, London, Auckland and Los Angeles to own their home outright within a span of less than a quarter of a century.
4. Principal payments as a proportion of income:
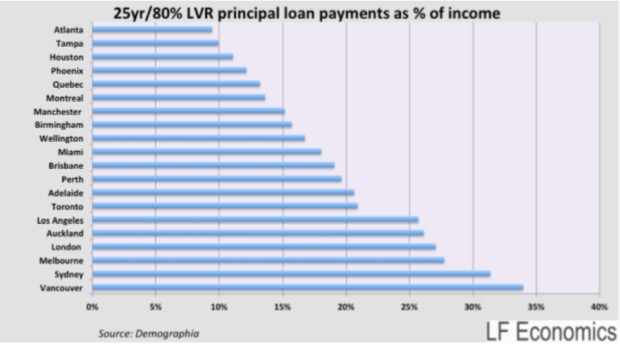
New homebuyers in Vancouver and Sydney are spending a hefty proportion of their incomes to pay down debt obligations even before interest is factored in.
The report has much more, including comparisons of the cost of servicing mortgages in different locations at various interest rates (i.e. 3%, 5% and 7%). Under all scenarios, housing affordability in Sydney and Melbourne, in particular, sucks.
What I like most about this analysis is that it focuses primarily on the costs of paying-off a home’s principal, and excludes mortgage rates. This nullifies the whole “but interest rates are at record lows” argument, even though Australian mortgage rates are typically higher than elsewhere.
Even excluding the impact of mortgage rates, on all measures Australian housing affordability is dismal – whether measured in absolute terms or relative to the rest of the world (Vancouver being the only exception).
