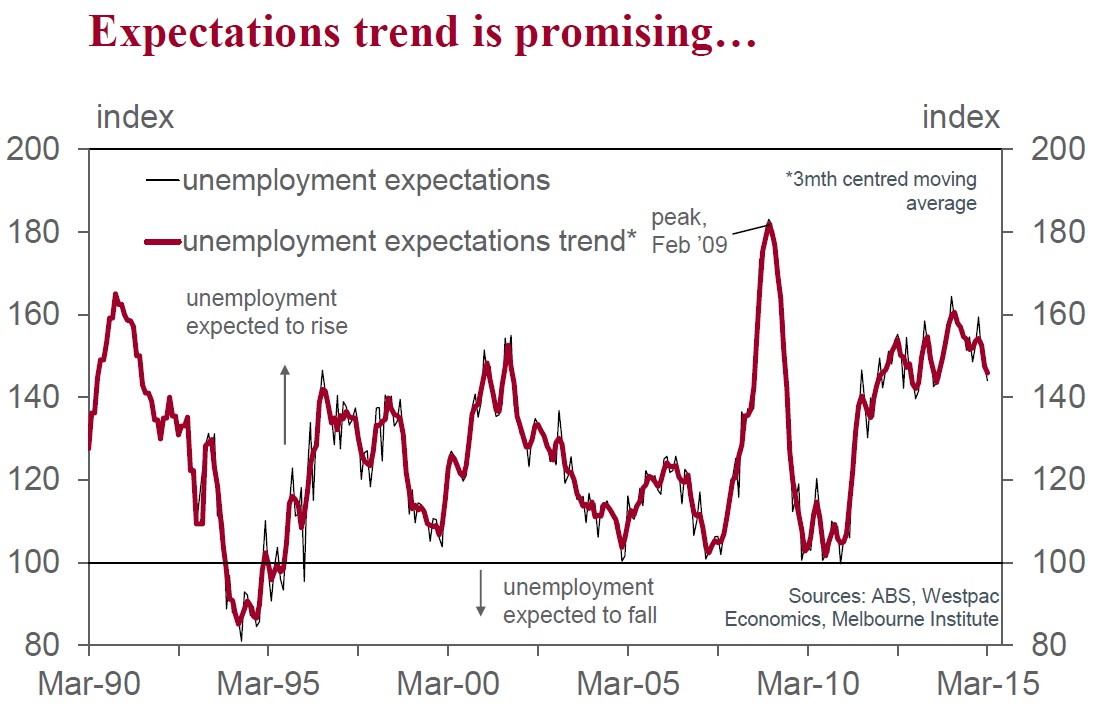
The Westpac-Melbourne Institute Unemployment Expectations Index fell a further 2.5% in Mar following a 1.9% in Feb. The index has fallen in 9 of the last 12 months to be down 12.4% in the year. Recall that a lower (higher) reading from the index indicates reduced (increased) concern around the labour market.
In trend terms, the index fell 1.1% following a 3.4% decline in Feb and a 0.8% decline in Jan. In Feb we noted that the trend improvement in the index had returned and the Mar print only reinforced that observation.
So far in 2015 households appear to be getting more positive about the labour market. Unemployment expectations are still high historically (about 15% higher than the long run average) but the trend in moving in the right direction.
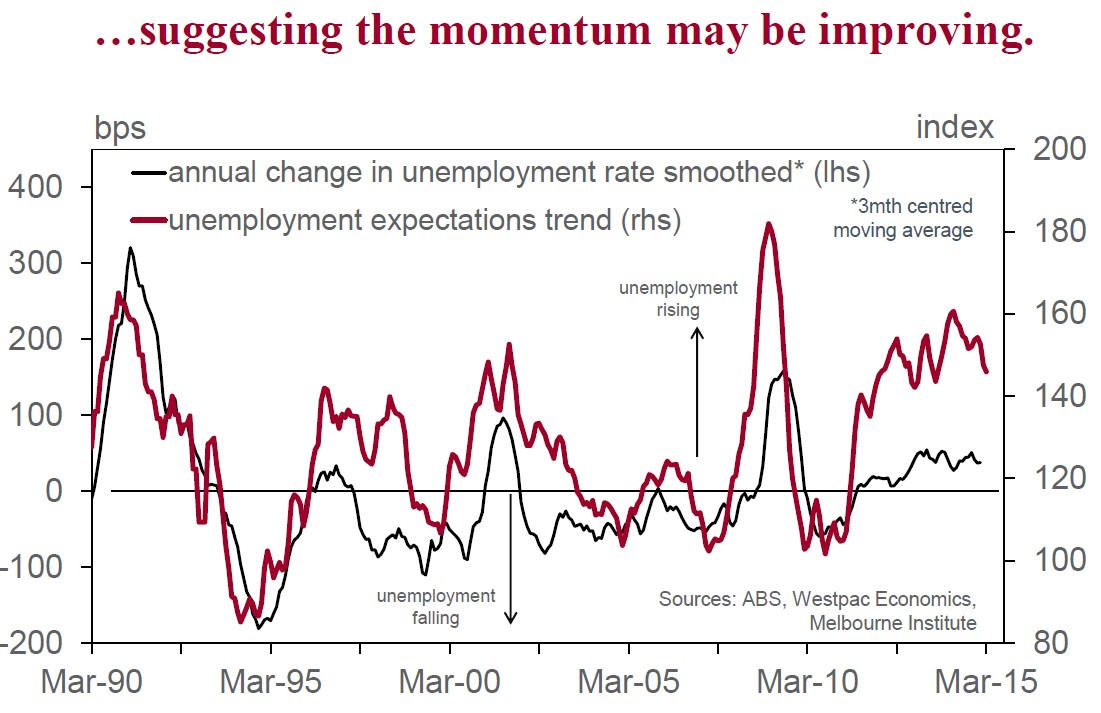
In the year to Jan 2015, the unemployment rate rose 6.0% to 6.4% which is less than what unemployment expectations suggested (see next chart). Remember the question is about the change in unemployment so the level of the index should be compared to the change in the unemployment rate.
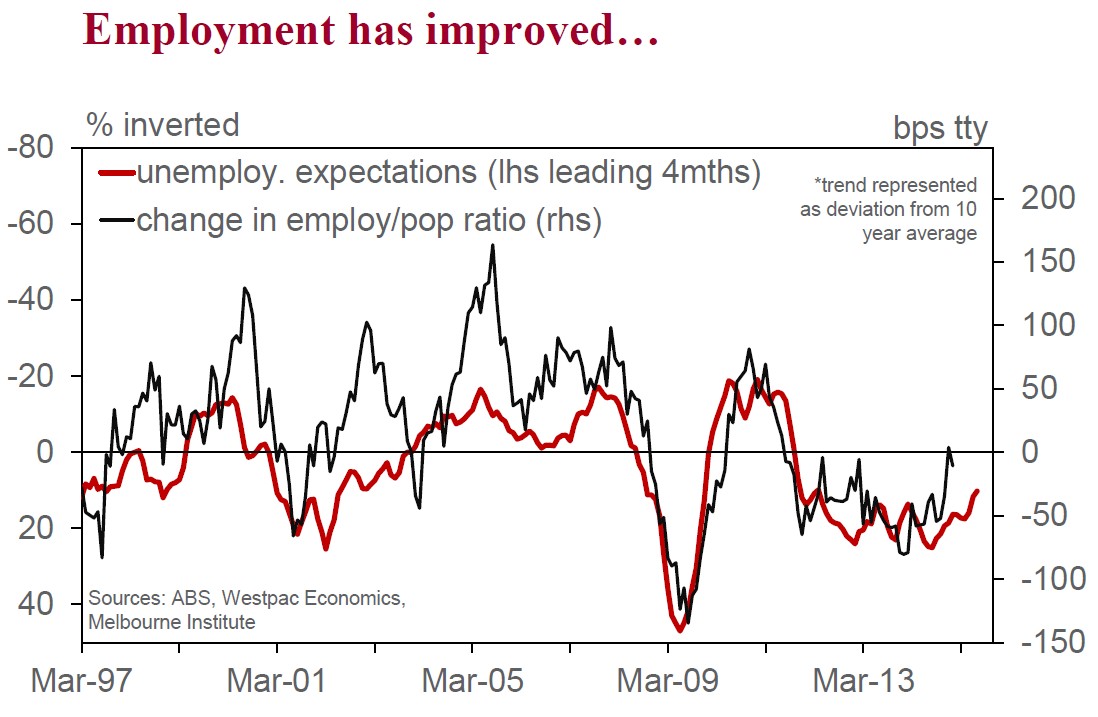
Compare this to the change in the employment to population ratio, which is immune to any changes in the participation ratio. Through the year to Jan, the employment/pop ratio was broadly flat resulting in an improvement in the annual change in employ/pop ratio (see next chart). This was a divergence to unemployment expectations ha d been suggesting but the stronger, more positive, trend in expectations is looking more consistent with the improvement in the employment to population ratio.
The ongoing improvement in expectations would be consistent with observing an improvement in employment relative to the pace of growth in the labour market.
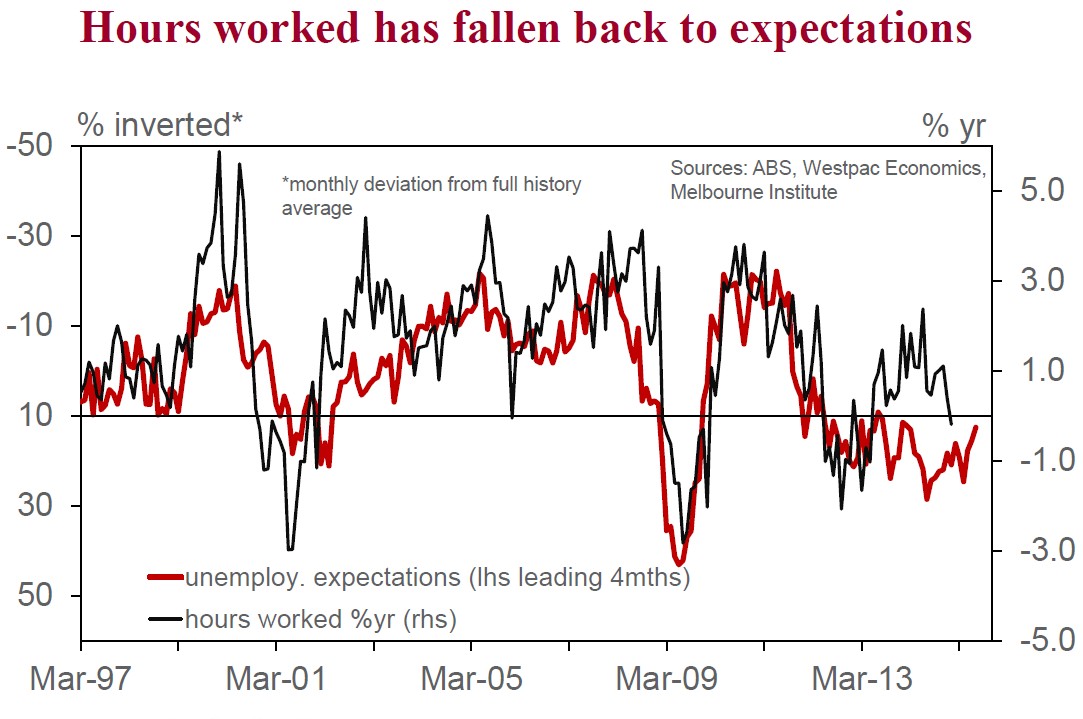
Since mid-2013 growth in hours worked has been running well ahead of expectations. Hours worked eased in Dec & Jan and are now much closer to what expectations would suggest. Hours worked have fallen back to expectations in NSW but they are a bit more stretched in Vic. Qld hours worked have fallen to expectations while we are waiting for the correction in hours worked in WA. And just how deep the correction to hours worked will be in SA.
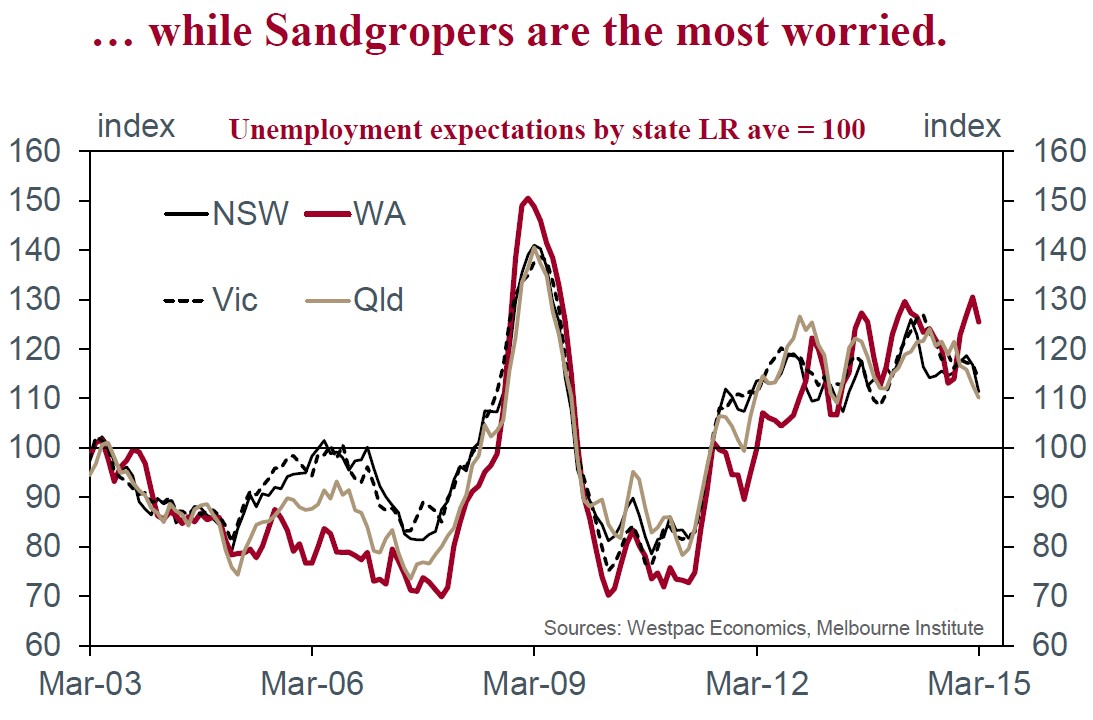
Unemployment expectations can diverge by city & state. Expectations are deteriorating quite rapidly in WA while NSW, Vic and Qld all are about the same relative to their long-run average.
Labourers/operators have the highest level of expectations but what is surprising is that expectations for sales & clerical workers is back to the long run average. Is this behind the improvement in female unemployment expectations?
As we have noted the level of unemployment expectations remains high but the trend is falling again which is a very promising sign.
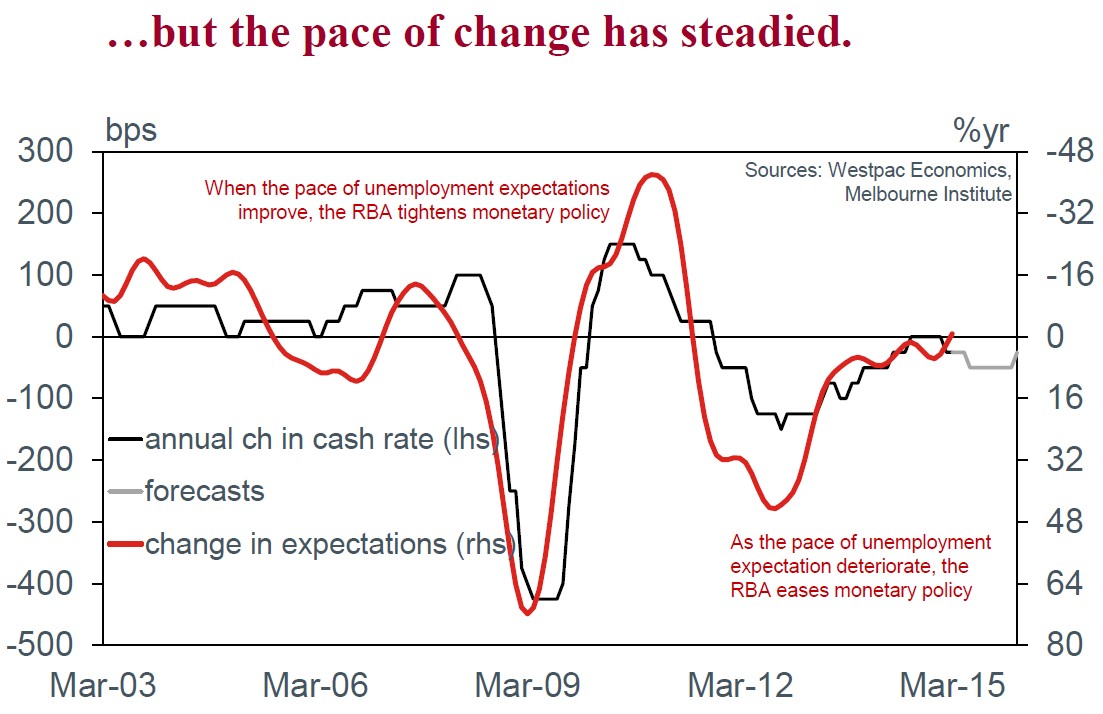
What we have found is that it is the change in expectations, rather than the level, that is the more important guide to any possible change to the stance of monetary policy. The recent trend improvement in expectations suggests that the recent rate cut may have already had an impact on expectations. And the change in expectations would suggest we are nearing the end of the rate cutting cycle, at least for now. We will have to wait to see if it translates thought to real economic activity.
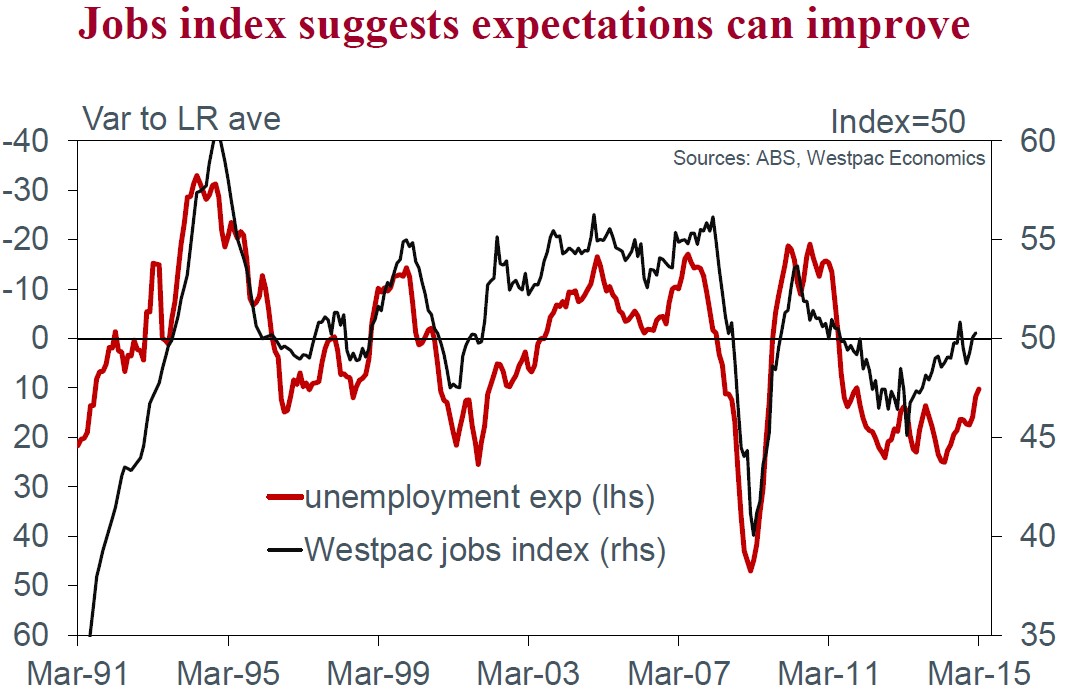
The recent lift in Westpac’s Jobs Index, back to its long run average, is also a promising sign. Should this continue we would expect that unemployment expectations also to improve (fall) over time.
Leith van Onselen is Chief Economist at the MB Fund and MB Super. He is also a co-founder of MacroBusiness.
Leith has previously worked at the Australian Treasury, Victorian Treasury and Goldman Sachs.