In our last report on the Brisbane property market, released in October 2013, I argued that investment fundamentals and valuations had improved, with Brisbane housing representing a better-than-average value proposition for investors seeking exposure to Australian housing.
In this report, I revisit the Brisbane housing market and find that while valuations remain in check relative to the other major capitals, the economic outlook is mixed, thus posing some risks to potential investors.
Affordability in Brisbane is relatively good:
The evolution of Brisbane’s housing market is illustrated by the next chart, which tracks detached house prices, as reported by the four main housing data providers: the Australian Bureau of Statistics (ABS); Australian Property Monitors (APM); RP Data-Rismark; and Residex, as well as a composite measure, which is the average of these indices.
Residex has the longest running house price series for Brisbane, dating back to the late-1970s, whereas APM’s is relatively new.
Despite minor variations, all four series have tracked each other fairly closely (see next chart).
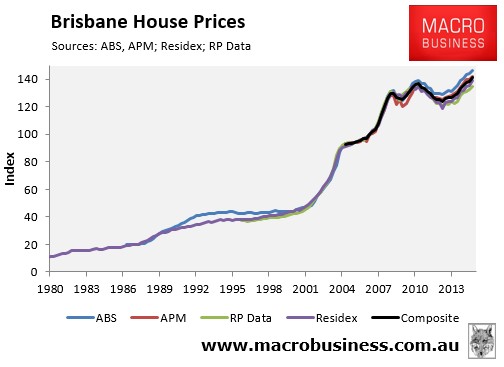
The December quarter price results for Brisbane showed the housing market growing at a solid pace, with house prices up 5.7% over the calendar year when averaged out across the four data providers. Values were also 3.0% above the June 2010 peak based on the average of the four providers.
RP Data, which is the only provider to have released results up to end-February 2015, revealed that Brisbane house values fell by 0.3% since the beginning of the year, potentially signalling a stalling of growth across the capital.
Brisbane unit price growth was far more subdued, with values increasing by only 2.0% in the 2014 calendar year, when averaged across the four main data providers, and was 0.7% below the June 2010 peak (see next chart).
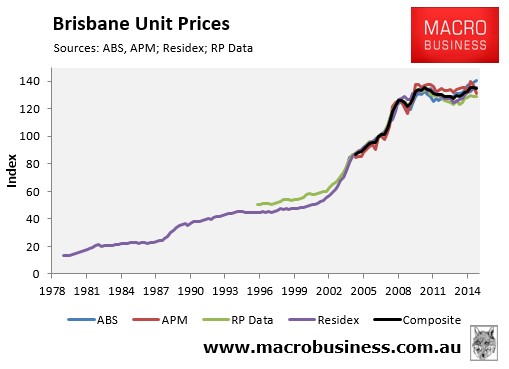
Over the first two months of this year, RP Data has registered 0.3% growth in unit values, suggesting the lackluster conditions have continued.
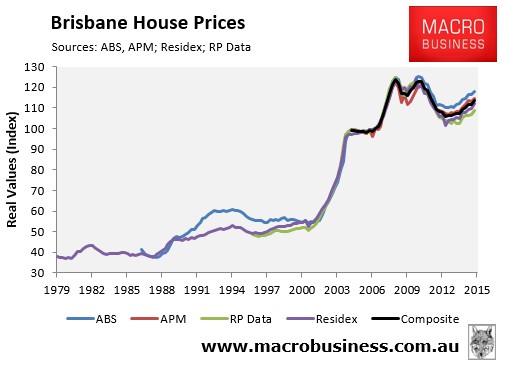
When adjusted for inflation, Brisbane house price growth has disappointed. In real terms, Brisbane house prices were 8.1% below their March 2008 peak, when averaged-out across the four main data providers, representing the largest value losses of all the major capitals (see next chart).
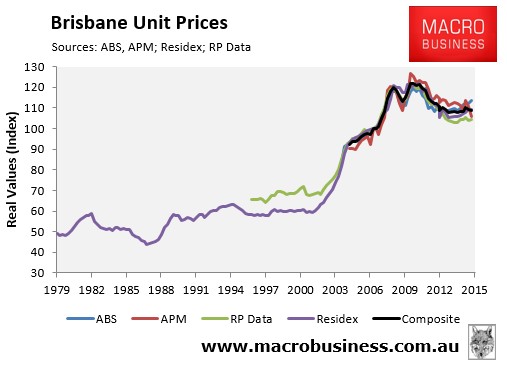
It is a similar story for Brisbane units, where values remain 11.0% below their December 2009 value in real, inflation-adjusted, terms (see next chart).
The recent under performance of Brisbane housing has seen its median house price relative to the other capital cities fall to well below long-run average levels, which suggests that Brisbane housing presents relatively good value (see next chart).
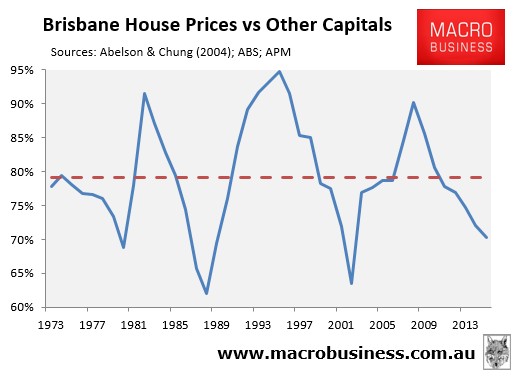
It is important to note, however, that the above chart does not infer that Brisbane housing is “cheap”, since it is our strong view that Australian housing as a whole is severely overvalued. Rather, what it illustrates is that the level of overvaluation in Brisbane is far less than the nation as a whole, meaning that Brisbane housing represents relatively good value.
But price momentum slowing:
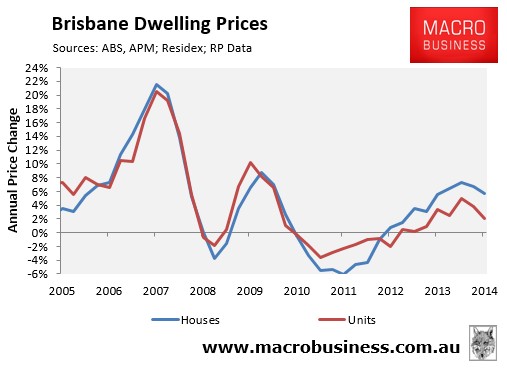
The most recent annual results suggests that Brisbane’s house price growth has peaked. As at December 2014, annual price growth was 5.7% (houses) and 2.0% (units) when averaged-out across the four data providers, and is clearly trending down (see next chart).
Importantly, the single best short-term indicator for house prices – housing finance commitments – is also past its peak which, given past strong correlations, suggests that Brisbane’s house price growth could moderate further over the year ahead (see next chart).
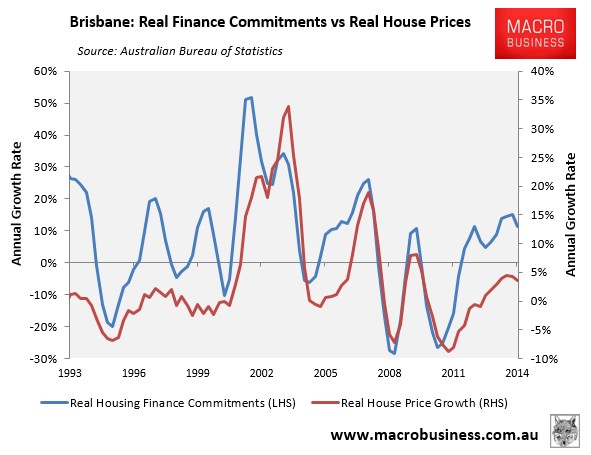
The big unknown is the extent to which the latest interest rate cutting program by the RBA will stimulate mortgage demand and house prices, arresting the downward trend in Brisbane dwelling price growth. Our best guess is that the RBA’s actions will slow the moderation of growth, but will not arrest it, potentially forestalling a downturn in both prices and construction well into 2016.
Supply evenly poised:
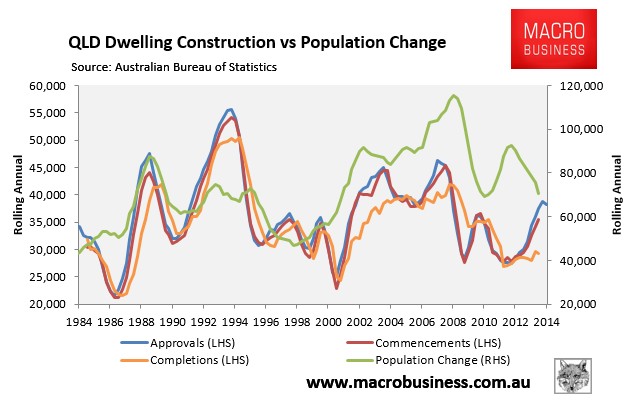
In my 2013 report on the Brisbane housing market, I argued that the supply situation was tight, reflected in both construction levels relative to population growth and rental vacancies.
Today, the supply situation has eased significantly, as evident by falling population growth meeting a rise in dwelling construction (see next chart).
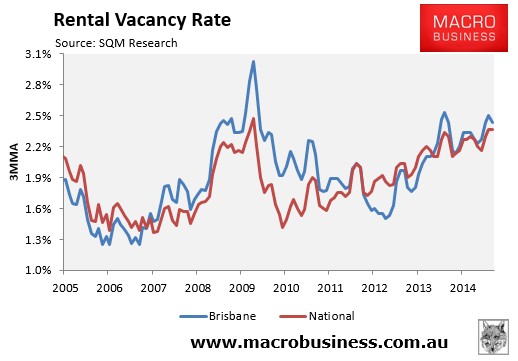
Rental vacancies have also eased considerably in Brisbane, sitting at a relatively balanced 2.4% in the three months to February 2015 (see next chart).
Rental returns good:
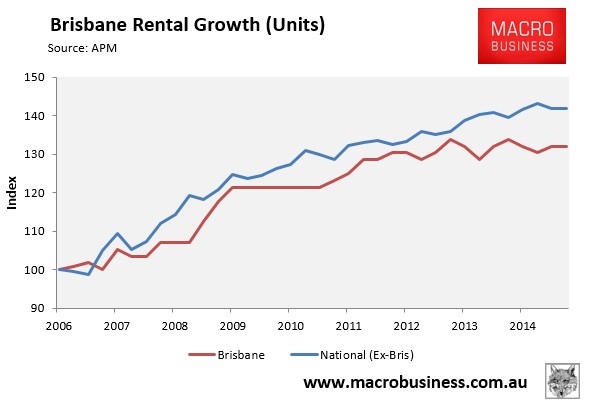
Brisbane’s rental growth has underperformed the other capitals in recent years, with gross house rents rising by only 11% since September 2009, compared with 13% rental growth in the other capitals, and gross unit rents rising only 9% in Brisbane versus 14% in the other capitals (see below charts).
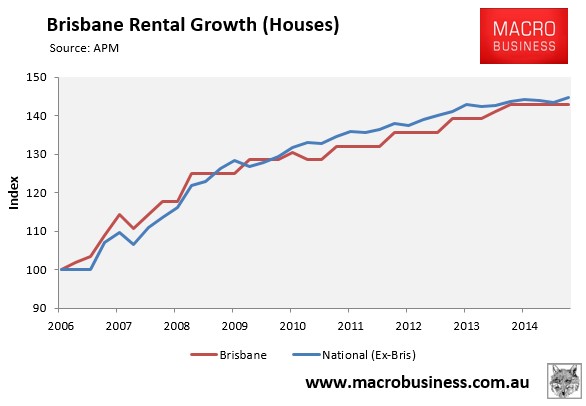
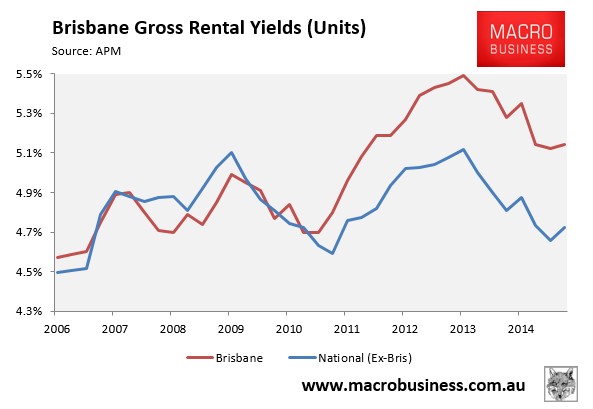
Nevertheless, Brisbane’s relatively weaker house price growth, combined with moderately rising rents, has improved rental yields relative to the other capitals.
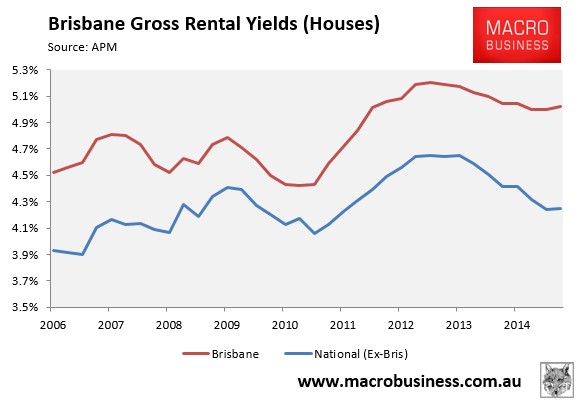
Brisbane’s median gross house rental yield of 5.0% is well above the other capitals (4.2%), as are gross unit rental yields – 5.1% in Brisbane versus 4.7% in the other capitals. This makes Brisbane housing a relatively attractive investment proposition from an income perspective (see below charts).
But economic concerns remain:
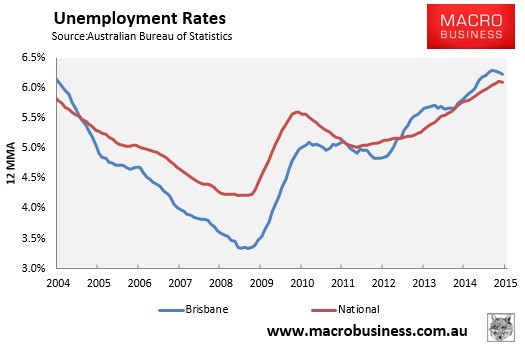
Brisbane’s employment market remains soft which, if maintained, could put a lid on home price and rental growth going forward.
Measured on a 12-month moving average (12MMA) basis in order to overcome seasonality, Brisbane’s trend unemployment rate was tracking just above the national average in January, although is has improved over recent months (see next chart).
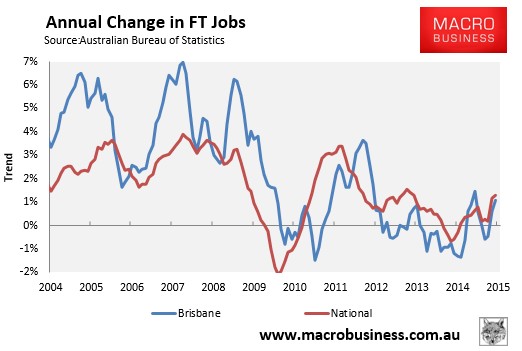
Moreover, while the full-time jobs market has recovered recently, it too remains fairly weak (see next chart).
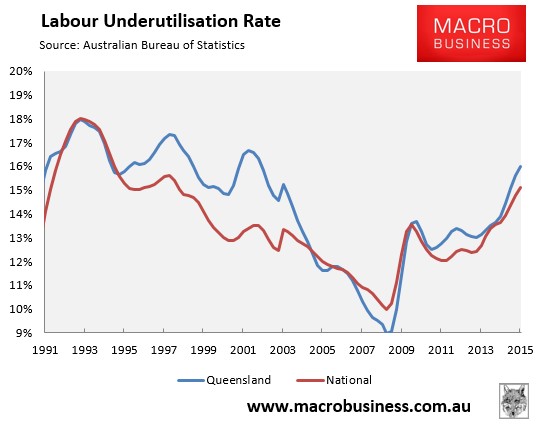
Labour underutilisation, which is measured at the statewide basis only, is also tracking at 16.0% – above the national average of 15.1% (see next chart).
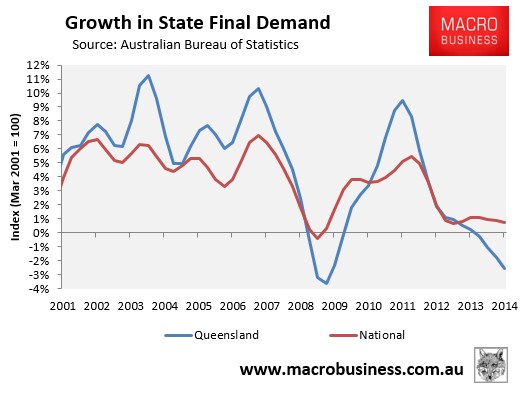
Growth is Queensland state final demand (SFD) is also plumbing GFC lows, down 2.5% in the year to December 2014 in trend terms (see next chart).
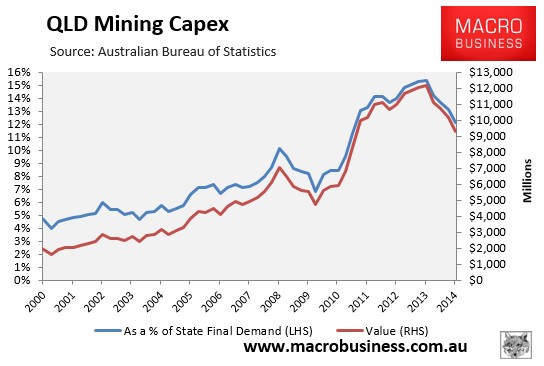
The economic outlook for Brisbane is cloudy. The mining sector is facing large job cuts over the next year as huge liquified natural gas (LNG) projects in Gladstone are completed, which will lead to sharp falls in mining-related capital expenditures (capex) from current record levels (see next chart).
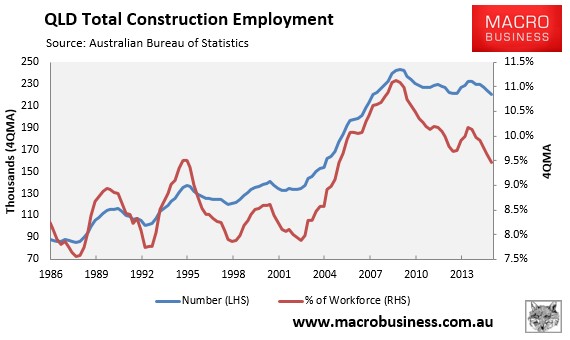
Construction is the third biggest employer in Queensland, accounting for around 9.5% of the state’s jobs. And while the number of workers in construction has declined in recent years, at least in relative terms, it remains well above the pre-mining boom norm (see next chart).
Gladstone has three large LNG projects – QCLNG ($20.4 billion), Santos GLNG ($18.5 billion), and APLNG ($24.7 billion) – worth a combined $64 billion.
The outline of jobs at Gladstone’s three LNG projects estimates that once the plants are completed, and they move into the operational phase, only around 420 employees are expected to be required (versus 9,900 during the construction phase), representing a reduction in jobs of around 95%. Add in jobs lost in functions peripheral to construction (e.g. engineers and mining services in our capital cities), as well as those indirectly affected (e.g. services staff in Gladstone), and the total loss of jobs could easily escalate.
While these jobs are obviously not in Brisbane, it is reasonable to expect a significant knock-on effect to the Brisbane economy and housing market. First, there are likely to be a significant number of workers in engineering, mining services, and mining company head offices that would be affected by the retrenchment. There are also likely to be fly-in-fly-out workers that live in Brisbane that will be affected as the LNG projects wind down.
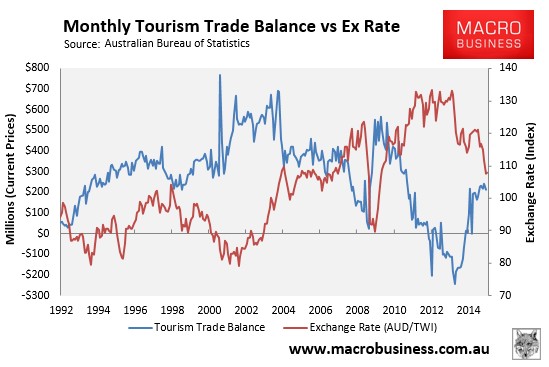
Offsetting some of these headwinds is the falling Australian dollar, which would reasonably be expected to spur the tourism industries of the nearby Gold and Sunshine Coasts, which would obviously have flow-on effects to the Brisbane economy (see next chart).
Another uncertainty is the political situation following the shock loss of the Newman Liberal Government. The new Palaszczuk Government only managed to gain 44 seats – one short of the 45 seat majority needed – and must now rely on the support of independent Peter Wellington to form a minority government. Minority governments are not typically recipes for success, so there is the risk that Queensland will enter a holding pattern whereby important decisions and projects are deferred.
Bottom Line:
Following years of underperformance, Brisbane’s investment fundamentals have improved significantly relative to the other capitals, with Brisbane housing now relatively affordable and offering the best rental yields of the major capitals. Housing supply is also fairly balanced, both in terms of construction rates relative to population growth and rental vacancies.
The economic outlook for Brisbane is mixed. The economy is likely to face stiff headwinds as spending related to three large LNG projects in Gladstone are completed over the next year or so, leaving behind thousands of jobs. On the other hand, tourism-related industries around the Gold and Sunshine Coasts face a potentially large rebound in activity as the Australian dollar depreciates, which would provide significant stimulus to growth and jobs.
The shock election of the minority Labor State Government further complicates matters, and could lead to a period of policy stasis, along with important decisions and projects being deferred.
Overall, with Brisbane housing values still well below their peak, relatively high yields on offer, and the employment market evenly poised, Brisbane housing is a relatively good bet for investors looking for yield in this financially repressed environment. Just beware that capital values would likely still take a hit in the event that housing nationally nosedives, although given its relative affordability, we expect Brisbane to offer much better downside protection than the other capital city markets.
