With the December house price and housing finance data in, it is an opportune time to review the state of the housing market, and to ascertain whether the current strong momentum in likely to be maintained over 2015.
As has been the case in prior years, detailed reports covering the major capitals’ markets will be released throughout the year focusing on the current position and outlooks for each of those markets.
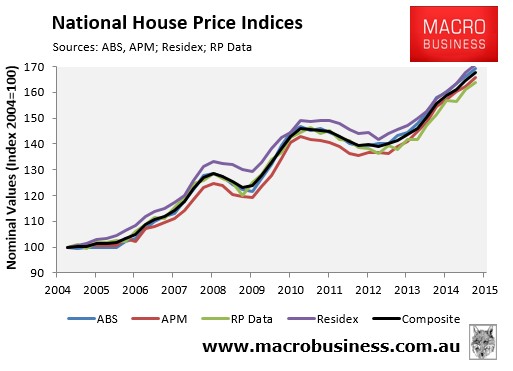
Australian housing values reached new heights in 2014:
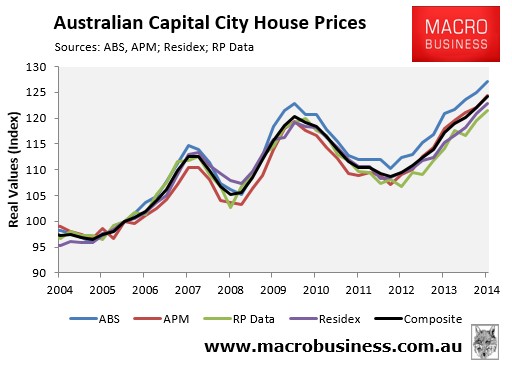
At the national capital city level, house price growth remained fairly strong in 2014, with the four major indices – the ABS, Domain (formerly APM), Residex, and RP Data – all recording growth of between 7% and 8.3% over the calendar year, and growth of 7.7% when averaged-out across the four main data providers (see next chart).
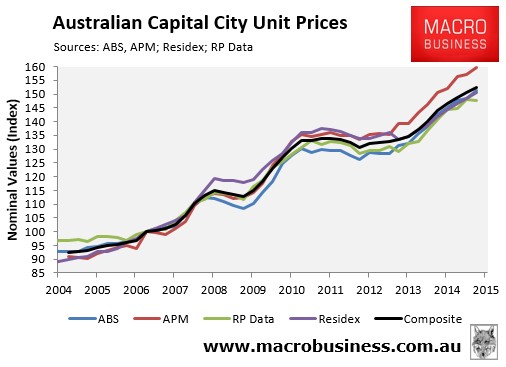
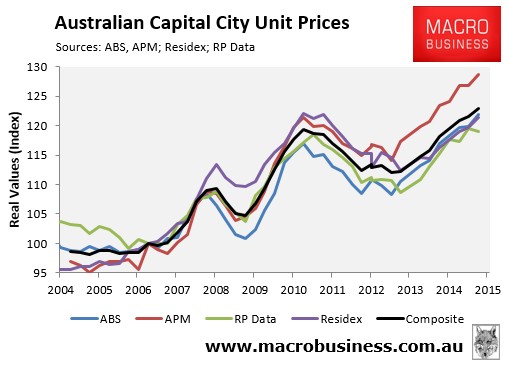
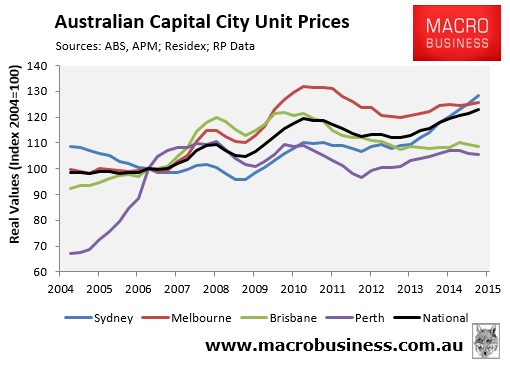
Unit price growth was a little weaker over 2014, with reported growth rates across the four main data providers varying between 5.1% and 6.2%, with average growth of 5.9% recorded over the calendar year (see next chart).
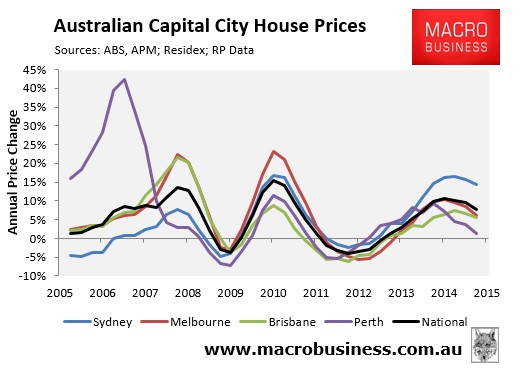
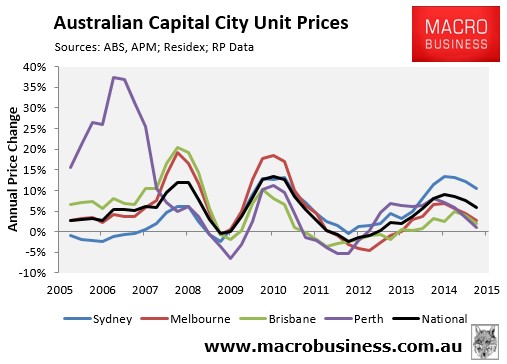
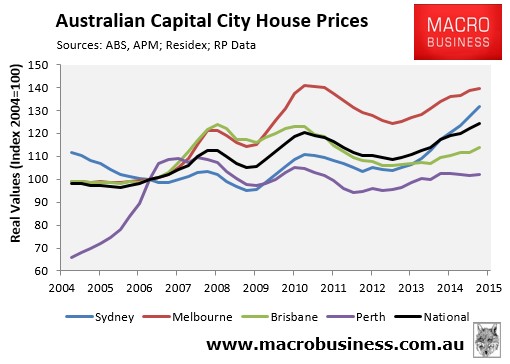
Turning to the capital cities, you can see that house price growth nationally has been driven by the three major markets of Sydney, Melbourne and Brisbane, where prices rose by 14.3%, 6.1% and 5.7% respectively when averaged out across the four main data providers (see below charts).
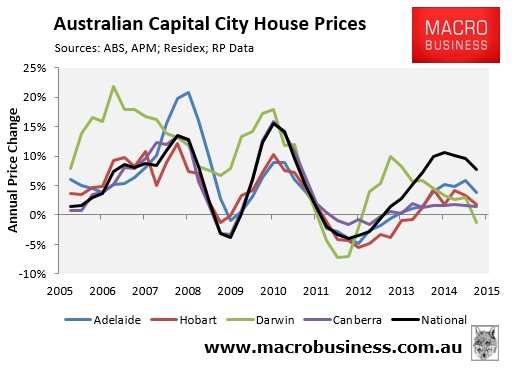
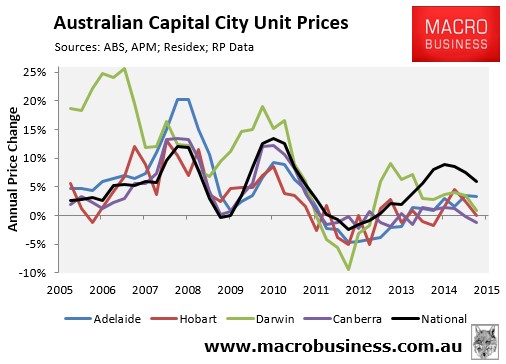
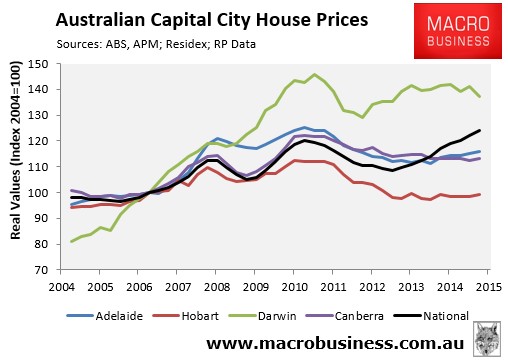
At the other end of the spectrum, price growth in 2014 was essentially at or below inflation in Hobart (+1.8%), Canberra (+1.5%), Perth (+1.2%), and Darwin (-1.4%), and was above inflation but unspectacular in Adelaide (+3.8%).
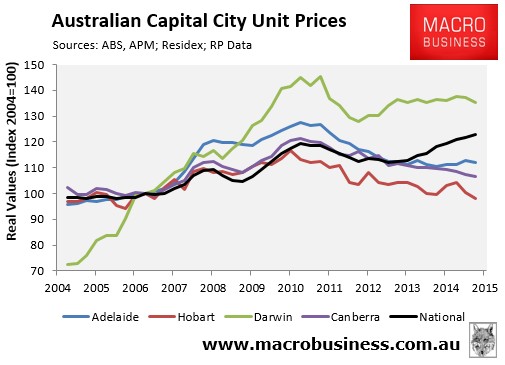
Unit price growth nationally was driven by Sydney, where prices rose by 10.5% in 2014. Unit price growth was also above inflation in Adelaide (+3.4%), Melbourne (+2.6%) and Brisbane (+2.0%), but below inflation in Perth (+1.1%), Darwin (+1.0%), Hobart (+0.1%), and Canberra (-1.3%):
When adjusted for inflation, Australian house and unit values hit fresh all-time highs in 2014, up 3.2% and 2.9% respectively from their mid-2010 peak when averaged across the four main data providers (see below charts).
However, while house values nationally are above their 2010 peak in real (inflation adjusted) terms, this has been driven entirely by Sydney, which is the only capital city where values are at an all time high (see below charts).
In Sydney, real house values are 15.7% above their 2004 high when averaged out across the four main data providers, whereas values are still down as follows across the other capitals:
- Melbourne: 1.0% below June 2010 peak;
- Brisbane: 8.1% below March 2008 peak;
- Perth: 6.7% below September 2007 peak;
- Adelaide: 7.4% below June 2010 peak;
- Hobart: 11.7% below March 2010 peak;
- Darwin: 6.0% below September 2010 peak; and
- Canberra: 7.5% below June 2010 peak.
It is a similar story for units, whereby Sydney is the only market where real unit values are above their former high (i.e. 16.3% higher than December 2010) when averaged out across the four main data providers (see below charts).
Real values are still down as follows across the other capitals:
- Melbourne: 4.9% below June 2010 peak;
- Brisbane: 11.0% below December 2009 peak;
- Perth: 4.5% below March 2008 peak;
- Adelaide: 12.2% below June 2010 peak;
- Hobart: 15.8% below March 2010 peak;
- Darwin: 6.8% below June 2010 peak; and
- Canberra: 12.1% below June 2010 peak.
Price momentum is slowing:
What should become obvious from viewing the annual price change charts is that price growth across Australia’s capital city markets are past their peak.
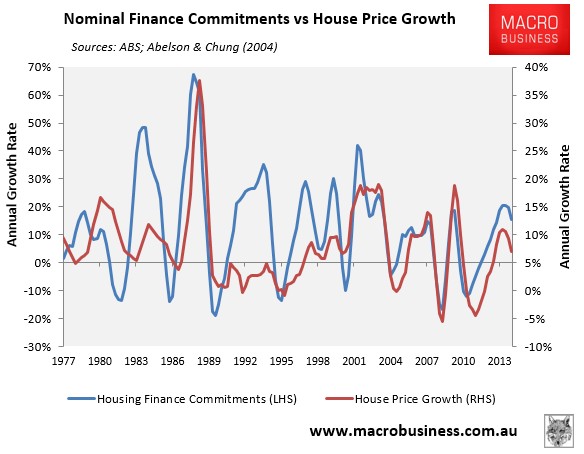
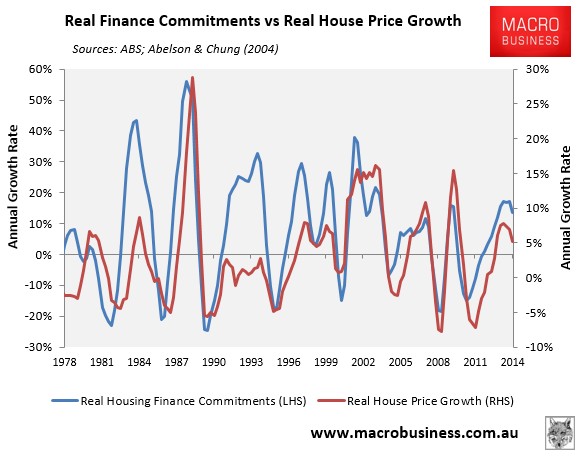
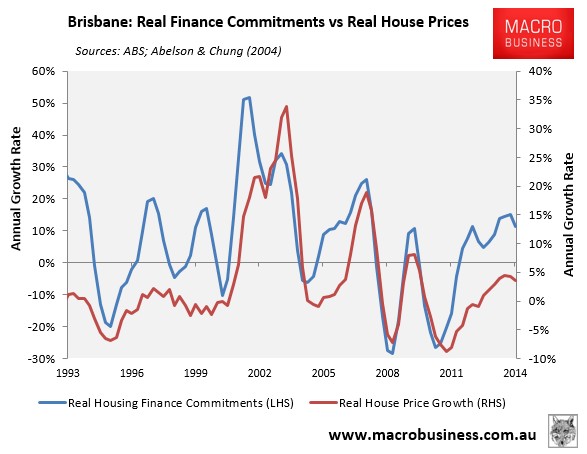
This view is confirmed by housing finance commitments data, which are arguably the single best short-term indicator for house price growth. As shown in the next two charts, which present this data in nominal and real terms plotted against the ABS’ house price series, finance commitments growth peaked in March 2014, around the same time as house price growth:
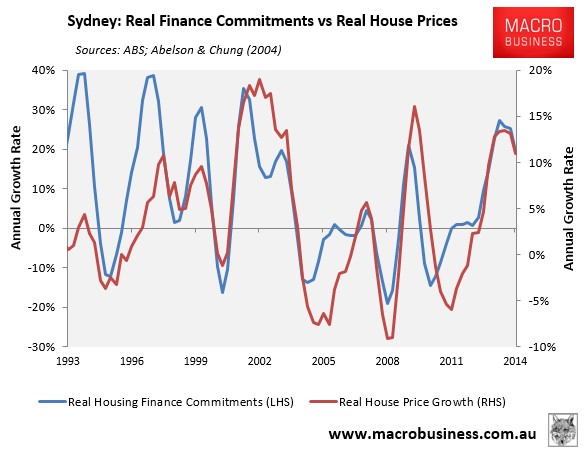
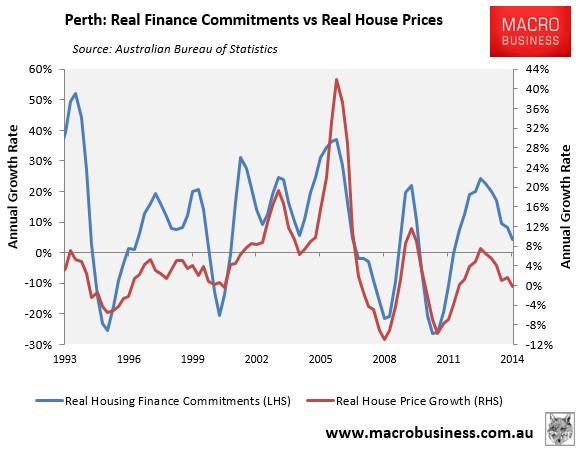
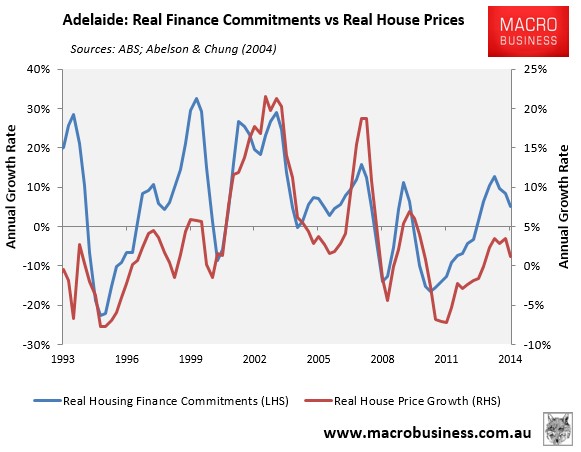
The below charts, which track growth in each of the major capitals, shows a similar story, with each market past their peak.
First Sydney, where real finance commitments growth peaked in March 2014 and house price growth in June 2014:
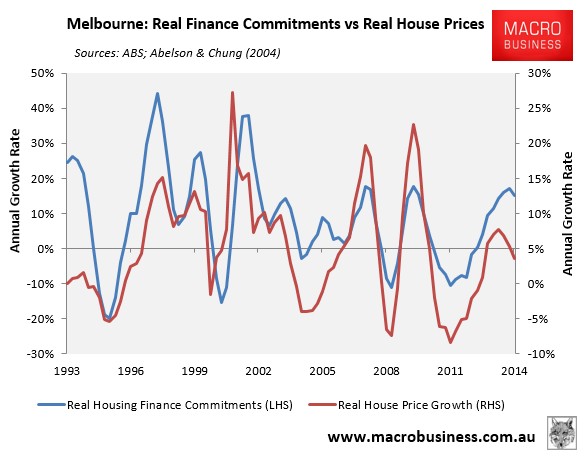
It’s a similar story in Melbourne, where real finance commitments growth peaked in September 2014, two quarters after house price growth, which peaked in March 2014:
Likewise Brisbane, where finance commitments growth peaked in September 2014, and house price growth in June 2014:
The slowdown occurred much earlier in Perth, however, with both housing finance growth and house price growth peaking in June 2013:
Finally, Adelaide where both real housing finance growth and house price growth peaked in March 2014:
Will interest rate cuts re-start the party?
The million dollar question is whether the latest 0.25% interest rate cut, and those that are likely to follow, will cause a re-acceleration of both borrowing and price growth?
Based upon history, this seems a sound bet, at least in the near-term. The recent interest rate cut has already caused a spike in auction clearances, which would usually correspond to rising prices.
However, there are policy and economic headwinds developing, that should act against price growth beyond the immediate-term.
On the policy front, the Coalition Government is set to follow the parliamentary inquiry’s recommendations to tighten surveillance/enforcement of foreign investment in established dwellings. Once implemented, this new regime should knock-out a significant share of illegal foreign purchases, dampening price pressures at the margin.
In a similar vein, APRA seems increasingly likely to tighten macro-prudential controls around investor loans, in the processing curbing speculation and dampening price pressures.
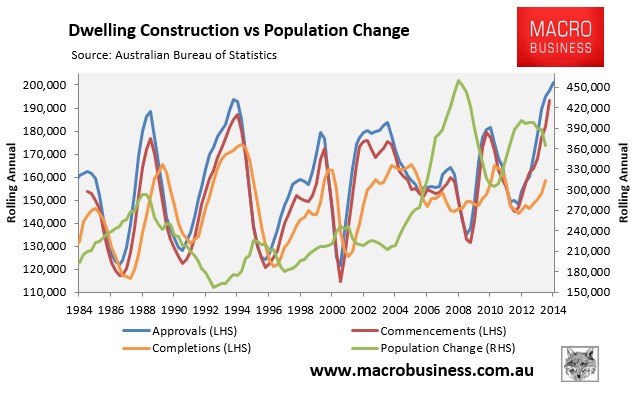
The ramp-up in dwelling construction, which is happening against the backdrop of falling population growth (see next chart), should also help to dampen prices as the new supply competes against the existing housing stock.
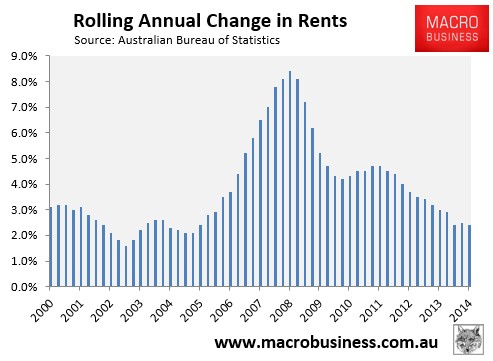
Already, these supply forces are in play with rents growing at their slowest pace in a decade (see next chart).
As the above charts also suggest, Perth and Darwin property prices are sliding swiftly towards year-on-year losses. As Perth especially sees prices begin to fall this will act as break on east coast property sentiment.
Then there are the gathering economic headwinds as: the mining investment boom unwinds over the next three years; the local car industry shutters by 2017; and the housing construction boom peaks later this year. These headwinds were discussed in detail in our Christmas members’ special report.
Our best guess is that interest rate cuts will temporarily stem the decline in house price growth that has been present since March last year but not halt it.
We expect the market to turn down sharply next year as the policy and economic headwinds described above stiffen and further interest rate cuts begin to lose their impact. The risks are weighted towards this happening earlier rather than later if, for instance, commodity prices were to continue to fall. This make gearing-up into property a highly risky proposition, with the risk of a major correction sometime from next year greater than at any other time in living memory.
