by Chris Becker
There’s been one investment trend post-GFC that has been blindingly obvious for all (even including those who just buy and hold) its long US stocks. The broadest index, the S&P500 has tripled since March 2009 in an almost straight line, particularly in the last two years.
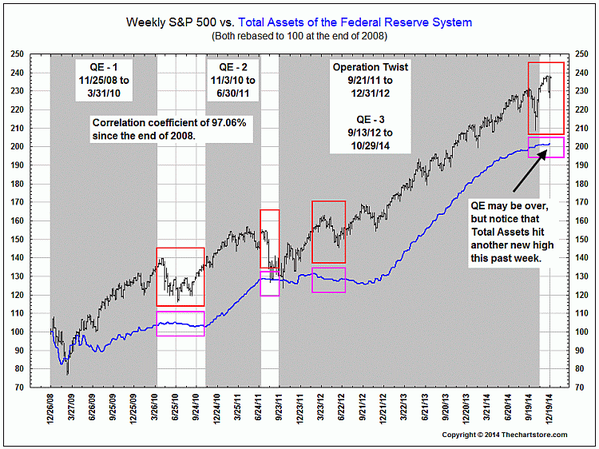
At the same time, the US Federal Reserve has embarked on one of the biggest monetary experiments of all time, with a series of quantitative easing (QE) monetary expansions. Although no new money is “printed” the liquidity provides boosts the transactions in stocks and hence market torque sends stocks (and bonds too) higher:
Here’s the chart from the Chart Store showing an extremely high correlation between the total assets in the Fed and the S&P500:
Given the lack of QE on the horizon, with the Fed seemingly positioning itself to possibly raise rates later this year, and the huge sentiment around US stocks, this does not add up to a similar year on year performance.
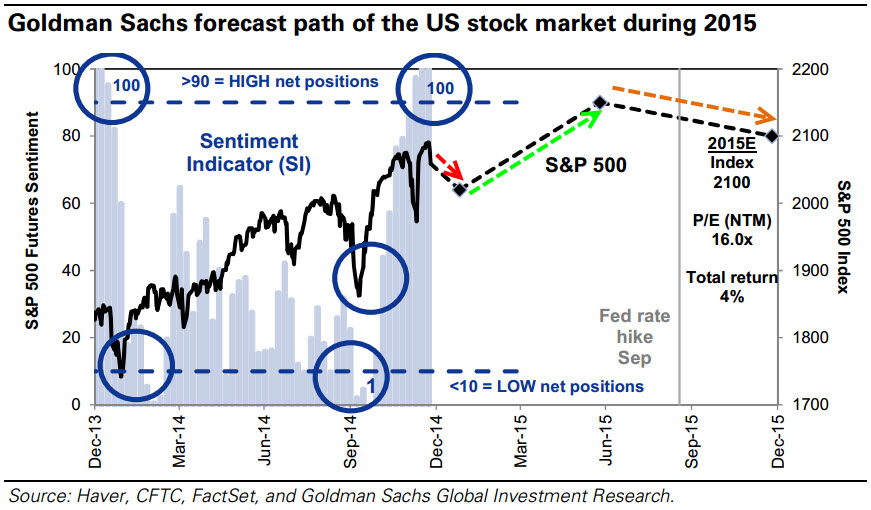
Morgan Stanley is dour:
US equity market Sentiment Indicator now shows an extreme reading of 100, suggesting on a tactical basis S&P 500 will decline during the next month.
Strategically, we expect 3% GDP growth will drive 5% earnings growth in 2015 and upside exists if crude prices remain low. Rising profits will lift the market to a new high around mid-year but after the Fed hikes in 3Q the P/E multiple will slip to 16x at year-end.
We forecast the S&P 500 will close the year at 2100 and deliver a total return of 4% vs. -1% for a constant maturity 10-year Treasury.