


by Chris Becker
The collapse in oil prices was something “no-one expected”, or more appropriately no-one forecasted. I’m in Yogi Berra’s camp when it comes to forecasting, preferring to rely on a matrix of probability, expect the unexpected (i.e the fat tails) and to act on price breakouts. Unfortunately most economic forecasters rely on straight rules, or overly complex models that usually fail to take account of the “unexpected”.
This wonderful chart from John Kemp at Reuters of historical price for oil (amongst others) shows how often to forecast means to fail:
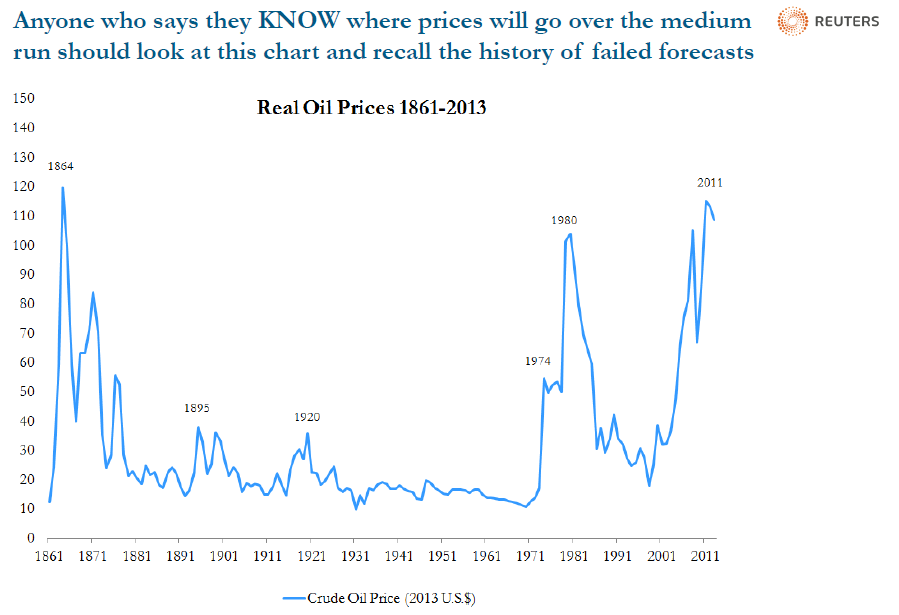
“Anyone who says they KNOW where prices will go over the medium run should look at this chart and recall the history of failed forecasts. We cannot forecast oil prices more than six months ahead let alone over 5 year, 10 year or 30 year horizons.”