
By Gavin Putland from the Land Values Research Group:
“If you can’t beat them…”
Curiously, NSW also led the charge in terminating first home owners’ grants for established homes. Unfortunately the Commonwealth made no matching reforms to negative gearing, with the result that first home buyers (FHBs) found it even harder to compete with investors in the market for established homes — unless, of course, they decided to make their first home an investment home, using negative gearing to service larger mortgages than they could carry as owner-occupants.
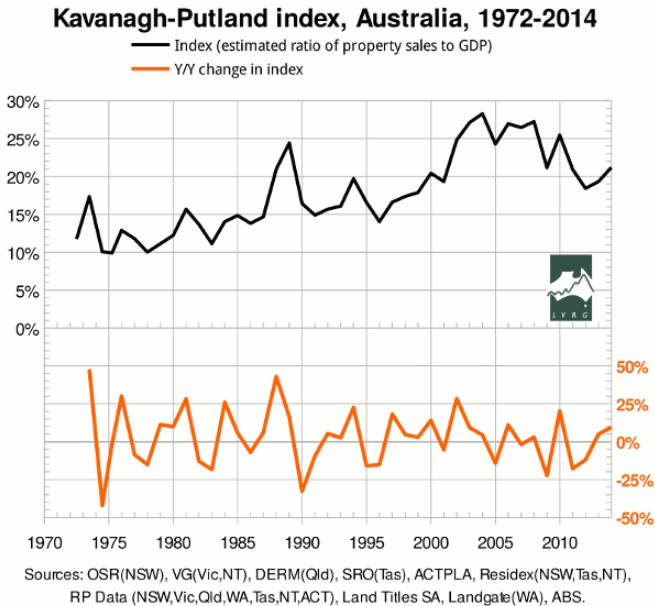
Hence I am not surprised to report that the K-P index rose again in 2013-4. The first graph shows the index and the year-on-year change therein:
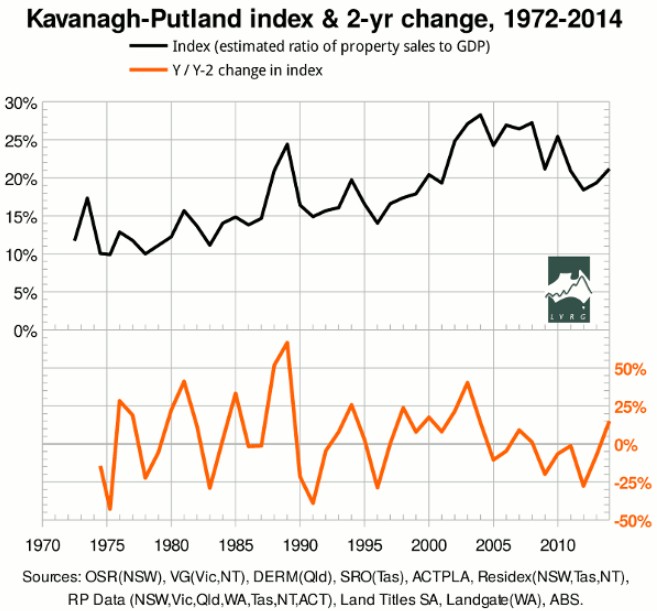
For interest’s sake, the second graph shows the index and the two-year change therein:
“What gets measured, gets managed.”
As previously noted, the year-on-year change in the K-P index was a reasonably good predictor of Australian recessions prior to the massive policy interventions of 2008-9 (a fall of more than 18% signalled a recession). Since then, governments and central banks have paid closer attention to the housing market. Policy interventions designed to influence that market invalidate predictions about its internal dynamics, while interventions designed to counteract the influence of that market on the wider economy reduce its value as an economic indicator.
The critical question is how long the authorities can keep the music going. On interest rates, David Llewellyn-Smith has remarked: “The RBA is in the process of throwing away its ammunition and when the next crisis strikes the chamber will be empty.” His graph of investor mortgage commitments suggests the trend cannot continue for long, even under the most favourable conditions, before investors pull in their horns as in 2003-4. Under less favourable conditions, investors are more willing than owner-occupants to stop buying or rush for the exits. That makes the present market unusually vulnerable to the mining investment “cliff” or any external shock.
See here for technical notes on how the K-P index is derived.
