
From Barclays:
As oil prices continue to fall, we review the likely supply response of tight oil supplies. Admittedly, cost of supply curves do not tell the whole story about where prices might bottom. At $80/b WTI, we think most producers will sweat it out and achieve their stated production objectives in 2015. But if prices remain at these levels through 2015, it could compromise the significant potential new volumes that are needed to offset declines from existing wells. This new, higher-breakeven volume is small in 2015, but becomes much larger in 2016.
As we stated in the most recent Blue Drum, we expect a rebound in prices in 2H15. But, if prices do remain lower and fall to $70 for all of 2015, half of proven and probable (2P) remaining US tight oil reserves would be challenged. The near-term (6-month) effect would be marginal, but fewer new volumes would be added in 2H15 and in 2016. On a net basis, that implies a reduction to growth of about 100 kb/d for 2015 as a whole. A growth impact of 100 kb/d is a drop in the bucket in the context of total non-OPEC growth of around 1.5 mb/d. Thus, we expect downward price pressure to mount unless OPEC supplies less or demand rebounds.
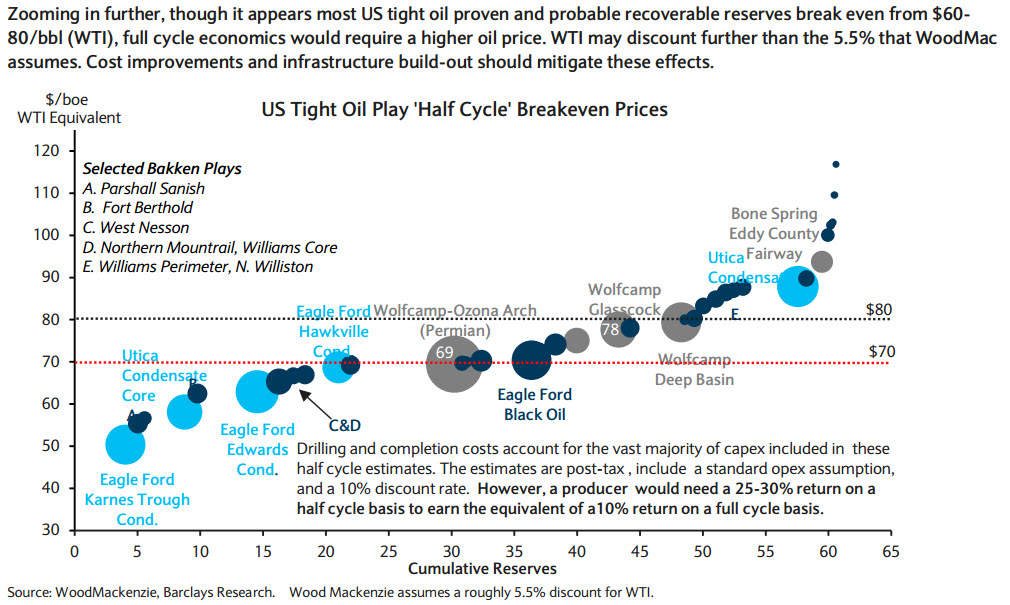
At $70/bbl, 80% of the 2.8 mb/d of new tight oil volumes by 2017 (not including declines) would be produced (meaning 800 kb/d from new drilling, a reduction of 200 kb/d over the next three years), according to WoodMackenzie.
There are three reasons to be cautious with how cost curves are used.
- First, WoodMac’s ‘half-cycle’ cost curve (above) represents new production only at a well, rather than at a project, level. Companies use ‘full-cycle’ economics (which include other expenses) to assess the economic viability of new drilling projects.
- Second, cost curves do not address how existing production might react. For this, we turn to EIA’s Annual Energy Outlook. EIA scenarios which imply that if prices reach and stay at $70/bbl, annual growth of 630 kb/d by 2017 would be cut by 180 kb/d each year, net of declines.
- Third, expected improvement in service costs will be another important determinant for the breakeven price of tight oil supplies. Oilfield services sector cost inflation has plateaued and stands to improve further in the coming years. This means that the cost curve in a year is likely to be up to $5/b lower on average. Permian D&C costs have declined from $9-10mn in 2012 to $5-7mn today.
OPEC producers have low production costs (in Saudi Arabia, even as low as $4/bbl), but will feel the heat fiscally. Still, tight oil producers are likely to be first affected in a low price environment.
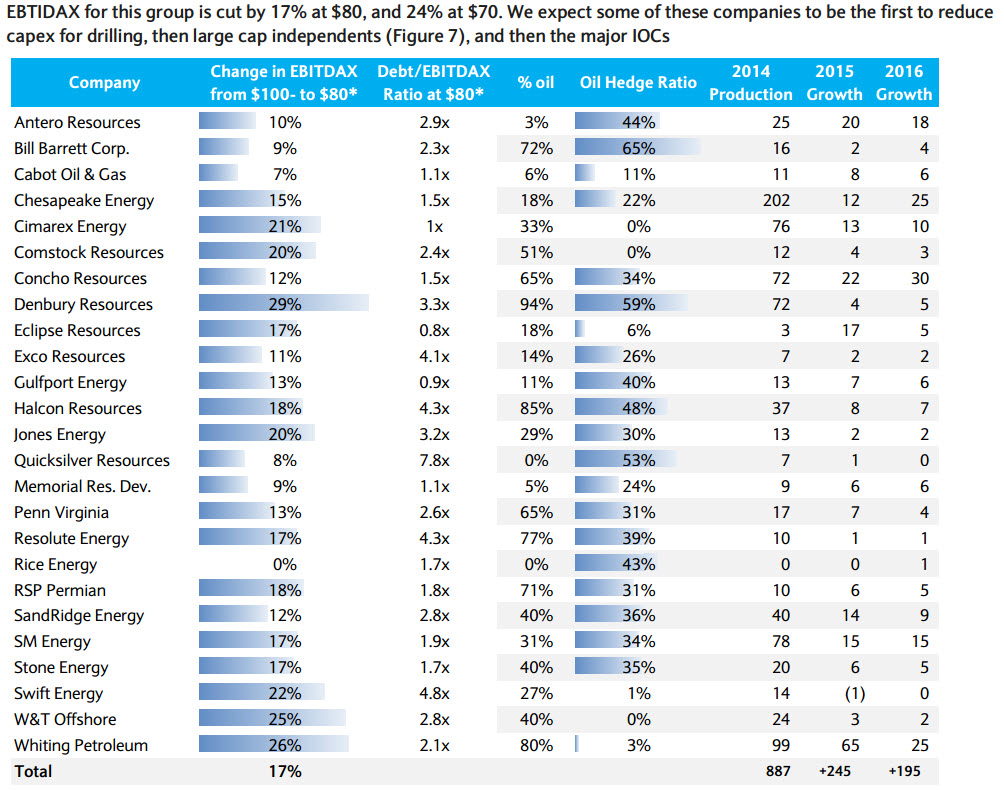
Companies are likely to react very differently regarding their market capitalization, hedge ratio, and ‘oiliness’ of output. We estimate that small and mid-cap E&Ps(accounting for 880 kb/d oil and NGLs) would see earnings cut by 17% in 2015 at $80 and by 25% at $70/b, which would likely lead to a cut to capex and drilling plans in 2015. Adding production from infill drilling, drilling in new areas, and enhancing recovery rates from existing wells would add output but require different levels of capex. Wells already online would not be affected, in our view.
More confirmation of the MB view that $70 WTI will be needed in the market share war, the equivalent of $12.70mmBtu for Australian LNG contract sales. That’s not priced into equities.
