Via FTAlphaville comes an outstanding analysis by Citi on the global credit and equity cycle:
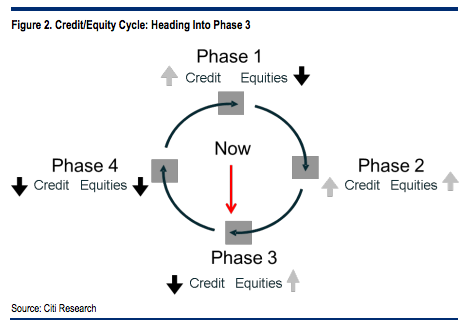
Phase 1: Credit Up, Equities Down
The cycle begins as the credit bear market ends. Spreads fall as companies repair balance sheets, often through deeply discounted share issues (Telecoms in 2002- 03, Financials in 2008-09). This dilution, along with continued pressure on profits, keeps equity prices under pressure. For the present cycle, this phase began in December 2008.
Phase 2: Credit Up, Equities Up
The equity bull market begins as economic indicators stabilise and profit forecasts soon follow. The credit bull market continues as improving cashflows strengthen company balance sheets. For the present cycle, this phase began in March 2009.
Phase 3: Credit Down, Equites Up
The credit bull market is over, spreads start to rise as investor appetite for rising leverage wanes. But the equity bull market continues as profits and CEO risk appetites rise further.
Phase 4: Credit Down, Equity Down
This is the classic bear market, when equity and credit prices fall together. It is usually associated with collapsing profits and worsening balance sheets. Insolvency fears plague the credit market, profit warnings plague the equity market. Cash and government bonds are the best-performing asset classes.
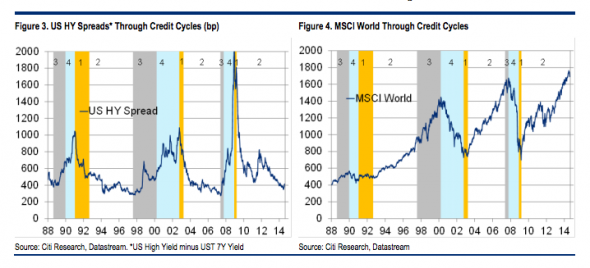
Phase 1 (when credit rallies but equities still falter) can be very short. It only lasted 3 months in 2008-09. By contrast, Phase 2 (credit and equities rally) is the longest, lasting at least four years. It started in March 2009 in this cycle and, at five years, has lasted longer than the previous two. Phase 3 (credit down, equities up) was very short (just 4 months) in the last cycle but lasted almost three years in the late 1990s. Phase 4 (bear market in credit and equity) tends to last at least one year.
Where are we in this cycle?
Instead, a QE-induced search for yield has brought capital into corporate bond markets and kept spreads falling. The traditional relationship between leverage and credit spreads has broken down (Figure 9). Instead of becoming a headwind for global equities, credit spreads have remained a tailwind. QE has prolonged Phase 2 of this equity/credit cycle.
But that may change. More recently, US HY bond inflows have turned into outflows and spreads have widened accordingly. It is still early days and the sell-off has largely been contained to US HY, but perhaps the prospect of QE withdrawal (in the US at least) will re-establish the old relationship between leverage and spreads. If this is the case, then it seems that the delayed move from Phase 2 to Phase 3 of the credit/cycle may be starting.
If we really do see a move into Phase 3, then the lows for credit spreads in this cycle may have been seen. The drop in market-maker inventories in the corporate bond market (Figure 10) mean that the transition may not be orderly.
By contrast, our framework suggests the equity bull market is maturing, but not done. Global equities took another 16 months to rise 30% in the 1980s Phase 3. They took 32 months to rise 50% in the 1990s version.But Phase 3 in the last cycle was very short. Equities peaked only 4 months and 3% higher after credit spreads bottomed in June 2007.
While equity returns can be healthy in Phase 3, they become increasingly unstable.We have previously noted a close relationship between equity market volatility and credit spreads. As spreads rise, so we would expect the Vix to follow.That is exactly what has happened in recent weeks. Investors should continue to buy the equity market dips, but these dips are likely to get bigger. Leveraged investors should also take note. The time to raise leveraged exposure to equities is the more stable Phase 2, not the increasingly unstable Phase 3.
We have also found that Phase 3 is prone to equity market bubbles (Figure 11). The late 1980s version was dominated by Japan, which rose to 44% of global market cap (now 8%), the late 1990s saw global TMT stocks rising to unprecedented levels. The last cycle saw a sharp rerating of EM equities. The recent rise (and fall) of the US Internet/Biotech stocks is typical, although much smaller in scale than those seen in previous cycles.
What about regions, sectors or styles in previous Phase 3s? The different nature of each cycle means that we cannot find consistent individual global sector outperformers or underperformers. Nor can we find consistent regional performance trends. But we can find some broader style themes. Cyclicals have outperformed defensives in each cycle. The MSCI global growth index has beaten its value counterpart (spectacularly in the late 1990s). Large-caps have beaten small/mid- caps.
Bloody fantastic analysis. And yes, I agree we are entering the early days of phase 3. Even with the ongoing rush to sovereign bonds, which saw US yields tumble Friday night, the marginal indicators of global high-beta credit and Chinese debt appear at or passed their nadir.
Advertisement
I’m on record tossing up between a Chinese housing bust and a US equity bust ending the cycle by year end 2016. Today it’s possible to see how the two might work together in a late stage equity melt-up. The shape of things to come may be that as Chinese housing falls it weighs upon emerging market growth, commodity prices and global inflation. That enables the Fed to raise interest rates slowly with impunity, feeding the blowoff in the US equity markets.
In some ways it is the reverse of the period leading into the 2008 crisis when tearaway Chinese growth and commodity inflation pushed Western central banks to hike even though their own economies were fraying badly. When they did cut it only fueled the blowoff as the US dollar fell and commodity prices headed for the moon on the monetary effect. Of course, beneath that opposite is the parallel that Chinese external imbalances are still recycling huge money into US markets and preventing any swift rise in interest rates, the same dynamic as the last cycle.
Anyways, if these dynamics play out, Citi is right that phase four lies over the crest of one more steep climb in global equity.
David Llewellyn-Smith is Chief Strategist at the MB Fund and MB Super. David is the founding publisher and editor of MacroBusiness and was the founding publisher and global economy editor of The Diplomat, the Asia Pacific's leading geo-politics and economics portal.
He is also a former gold trader and economic commentator at The Sydney Morning Herald, The Age, the ABC and Business Spectator. He is the co-author of The Great Crash of 2008 with Ross Garnaut and was the editor of the second Garnaut Climate Change Review.