While today’s retail sales result beat analyst’s expectations, they are still likely to detract from the country’s June quarter GDP.
As reported earlier, monthly sales values registered 0.6% growth in June on a seasonally-adjusted basis, which was above analyst’s expectations of 0.3% growth. However, in quarterly real chain volume terms, retail sales fell by 0.2%, which was well down on the March quarter’s 1.3% growth.
Advertisement
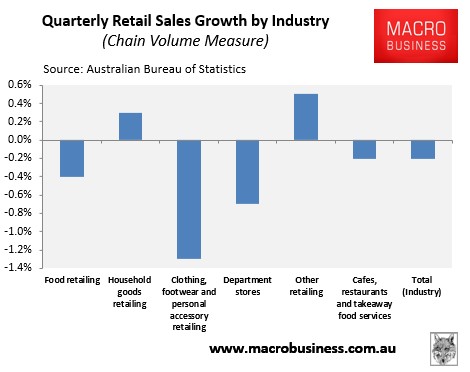
Looking at the breakdown of the key components, you can see that the volume falls were fairly broad-based, with four of the six categories registering declines over the quarter (see next chart).
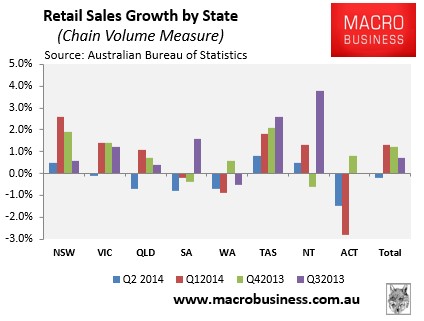
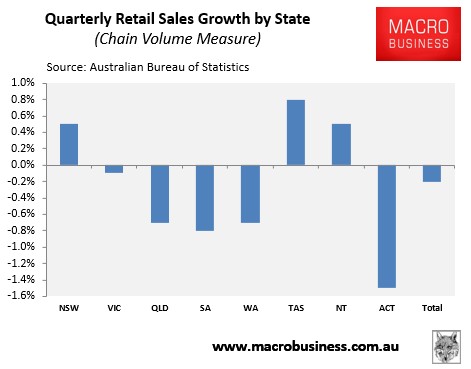
Moreover, five out of eight jurisdictions registered volume falls over the quarter (see next chart).
Advertisement
Retail sales are a sub-component of household consumption, which is itself the largest component in GDP. It is volumes that matter for GDP, so as stated above the -0.2% quarterly result, down from 1.3% in the March quarter, will weigh on June’s GDP growth.
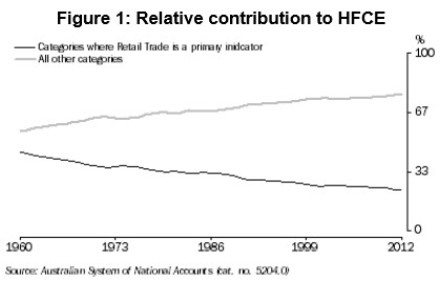
That said, as the ABS was at pains to point out last year, retail’s share of Household Final Consumption Expenditure (HFCE) has fallen significantly over the past 50 years as Australians spend a greater share of their incomes on services:
Advertisement
Historically, Retail Trade estimates contributed 55-60% of HFCE in the expenditure side of Gross Domestic Product (GDP). However, this coverage of HFCE has fallen over time as household expenditure patterns have gradually shifted from goods to services. As a result, Retail Trade now contributes approximately 30% of quarterly estimates of HFCE.
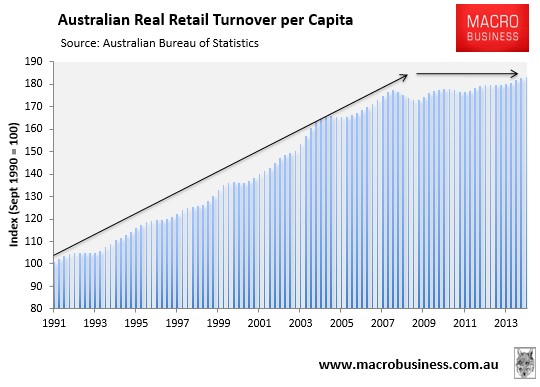
It’s also worth highlighting once again that when adjusted for both inflation and population growth, retail sales have experienced barely any growth over the past six-and-a-half years – a big contrast to the stellar growth experienced in the previous 15-year period (see next chart).
Advertisement
As explained previously, with household savings rates having returned to long-run historical norms and likely to remain there, retail sales growth is likely to grow more or less in line with disposable incomes going forward (with obvious deviations quarter to quarter).
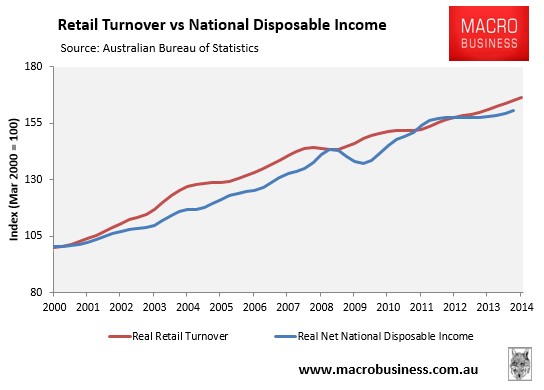
On this point, the next chart is instructive. Despite six-and-a-half years of sluggish retail growth, overall retail sales have still managed to exceed income growth since 2000 – incomes that were highly inflated by the one-off boom in commodity prices (see next chart).
Advertisement
Given that household income growth over the next 10 years is unlikely to grow at anywhere near the pace of the last decade as the joint commodity price and mining investment booms unwind and the population ages (reducing the employment-to-population ratio), the retail sector is likely to experience a continued period of subdued growth.
Leith van Onselen is Chief Economist at the MB Fund and MB Super. He is also a co-founder of MacroBusiness.
Leith has previously worked at the Australian Treasury, Victorian Treasury and Goldman Sachs.