

The bizarre under reaction to China’s terrible data output yesterday rolls on, making no appearance in the Australian media today and, more to the point, triggering a global after party!
Just in case you missed it, here are the charts:
I know all of the arguments. A sudden stop in credit in China is combatable because the government owns the banks. It’s true. But the government does not own the shadow banking system quite so much. And that is where the real problem is:
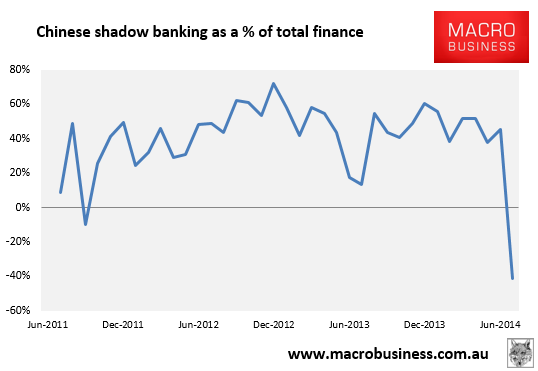
Let’s be clear, such a shadow bank contraction is rare. One of this magnitude is unprecedented. In the midst of falling house prices and an increasingly intense shakeout among developers, it is alarming. Yet UBS sees it as a rogue number, via FTAlphaville:
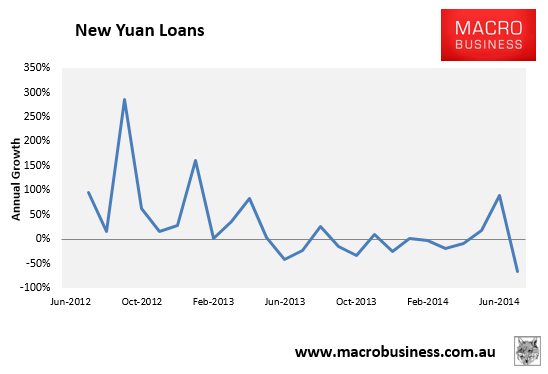
China’s July credit data came in sharply weaker than expected. July new RMB lending declined to 385 billion from 1.1 trillion in June. More importantly, new total social financing (TSF) was only RMB 273 billion, led by the drop in new bank lending and a 400 billion shrinkage of bank bill acceptances. As a result, credit growth slowed visibly and our credit impulse plummeted (Figure 1).
Given recent signs of further policy easing and persistently low interbank rates, the market has been expecting additional monetary and credit support. Today’s credit data are therefore a negative surprise. However, we do not believe these data reflect a credit tightening by the PBC – as evidenced by recent policy intentions expressed by the Politburo and the central bank, as well as ample interbank liquidity and strong credit growth in June which surprised on the upside.
Some of the following factors may help partially explain July’s credit data surprise: 1) June’s exceptionally strong deposit and credit growth may have led to a bigger-than-usual seasonal drop in July; 2) Tougher shadow banking regulations have reduced the layers of intermediation which used to inflate credit and deposit numbers, often facilitated by bank acceptance bills; 3) Tougher regulation may have also led to more shadow banking activities being hidden in new ways that cannot be tracked by TSF (for example, asset management business of security companies); 4) Banks may have had to cut short-term lending to companies in light of July’s deposit decline, due both to the seasonal post-quarter-end decline and continued rise in wealth management products; and last but not the least, 5), demand for credit in the real economy may be weak, and some of which have already been satisfied in June.
Just as we cautioned against over-interpreting the government’s policy and monetary easing, especially regarding some market participants’ earlier read of PBC’s new pledged-supplementary-liquidity tool, we similarly caution against over reacting to July’s surprisingly weak credit data. We do not see these as evidence of credit tightening and expect August credit numbers to improve.
A few points. Interbank market rates have been rising for several months not falling and those 5 points are all evidence of credit tightening. That’s not necessarily bad. Tightening interbank markets could be reassuring to the extent that they suggest that that’s what the PBOC wants, so this is all part of the plan, as it were. But that is supposition. They could have tightened for any number of reasons.
It is point 5 that bugs me the most. I remain convinced that Chinese authorities will keep one foot on the brake and one on the accelerator to generate the structural adjustment that they need. But the one big risk is that credit demand gets away from them. If the residential real estate correction gets up a head of steam then credit demand will evaporate and no matter what authorities do it will not restart until prices have fallen enough to tempt new buyers. The proverbial “pushing on a string” as an asset market finds a lower equilibrium price. That would trigger a global shock.
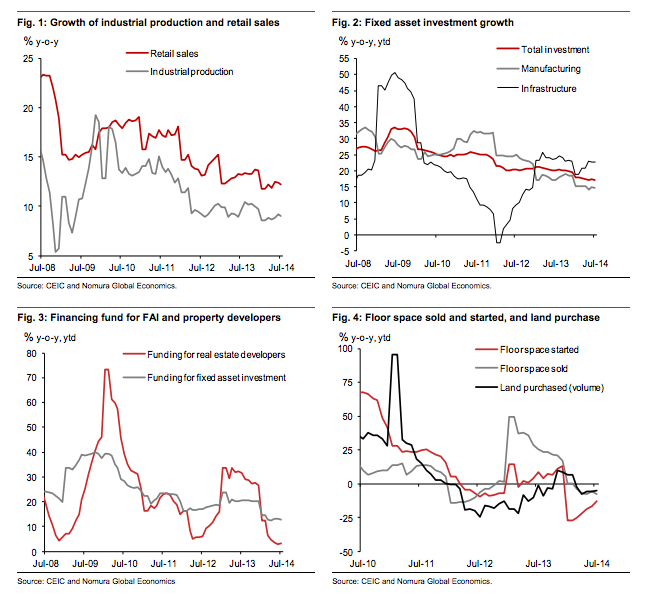
At this point that remains a risk rather than a reality, albeit with a higher likelihood than yesterday. But there are other much more immediate and specific problems that this data poses for Australia. Nomura provides a real estate investment update in the same post:
Here again is the year-to-date real estate investment chart:
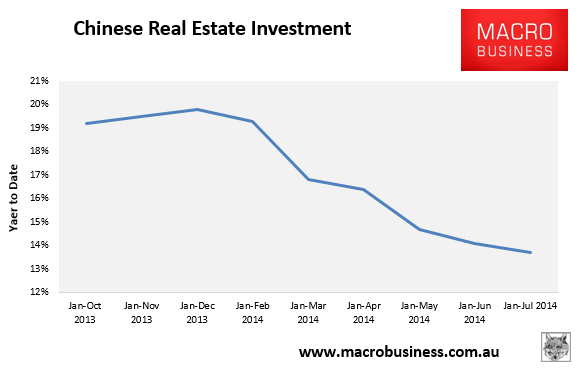
Last year real estate investment was 20% for the year. At it’s current rate of decline it will be half that this year. Real estate investment accounts for 15.6% of Chinese GDP before calculating spillovers so if we keep falling at the current rate we’ll be losing roughly half of 15.6% of Chinese GDP, and probably more like half of 20%. That’s approaching a 1% GDP hit.
That’s being offset in infrastructure and other stimulus to some extent but these are less commodity intensive than real estate construction so we can also expect increasing downwards pressure on construction related commodities.
That’s the clear message from yesterday’s data, whether you reckon it’s a rogue number or the harbinger of a worsening shakeout, sell bulk commodities.
