

As summarised earlier, the Australian Bureau of Statistics (ABS) today released labour force data for the month of May, which registered no change in the headline unemployment rate (still at 5.8%), beating analyst’s expectations of a 0.1% rise in the unemployment rate to 5.9%.
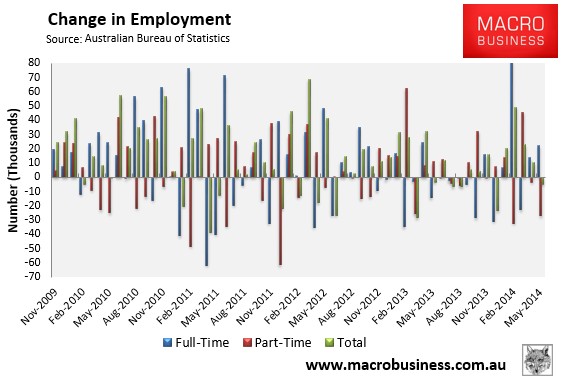
Total employment decreased by a seasonally adjusted 4,800 to 11,565 million in May, compared to an upwardly revised 11.569 million in April. The loss of jobs was driven by a 27,000 decline in part-time jobs, partly offset by a 22,200 increase in full-time jobs. Aggregate monthly hours worked bounced back from April’s Easter and Anzac Day driven fall, rising by 26.5 million hours (1.7%) to 1 ,604.5 million hours.
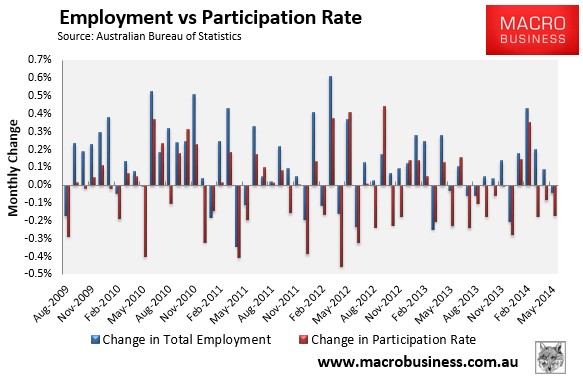
However, the participation rate decreased by 0.1% to 64.6% – the third consecutive monthly fall – which is the main reason why unemployment held steady, and took some shine off the overall result (see below charts).
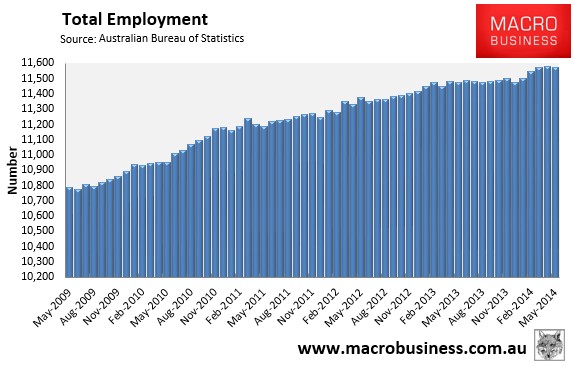
Total employment continues to trend-up, albeit very slowly (see next chart).
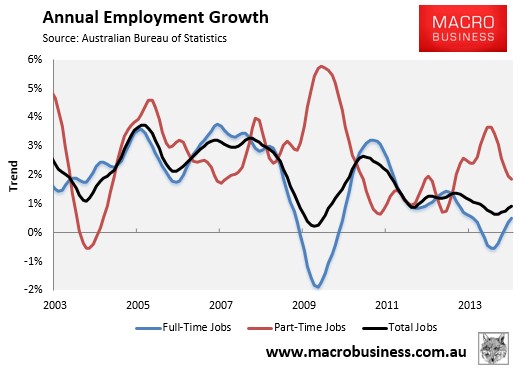
Growth in full-time jobs (0.6% YoY SA / 0.5% YoY Trend) also continues to improve, albeit still remains soft:
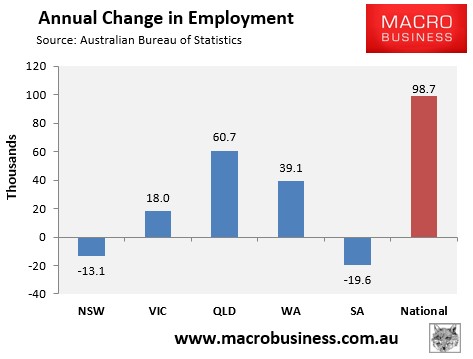
Employment growth continues to be driven by the mining states, with Queensland’s large LNG projects still presumably playing a major role (see next chart).
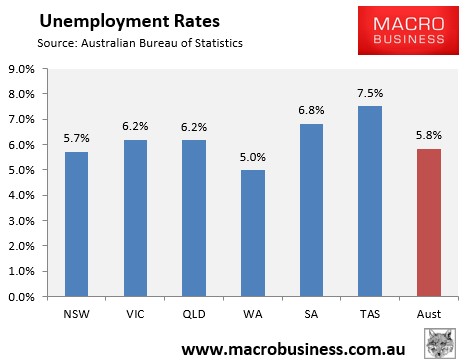
And the Southern States continue to have the highest unemployment rates, surprisingly along with Queensland (see next chart).
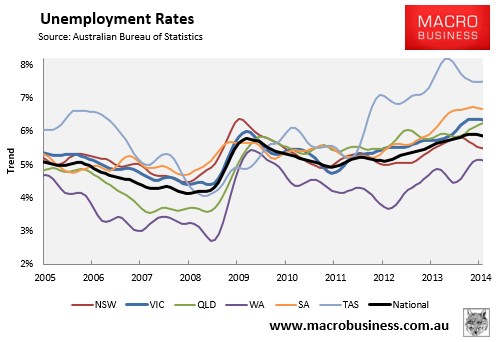
The state seasonally-adjusted figures are notoriously volatile and subject to a big margin of error. As such, the below chart shows the ABS’ trend unemployment rates, which shows Western Australia with the lowest unemployment (but trending higher), Tasmania and South Australia with the highest, with Victorian and Queensland unemployment also elevated. By contrast, New South Wales is the only state where unemployment is both below the national average and trending lower. Note also that the national unemployment rate (5.9%) has improved marginally in trend terms:
A positive from this release is that the aggregate number of hours worked jumped by 1.7% in May, retracing some of April’s heavy (2.2%) fall; although it has only risen by 1.2% over the year – well below the 1.8% growth in the population: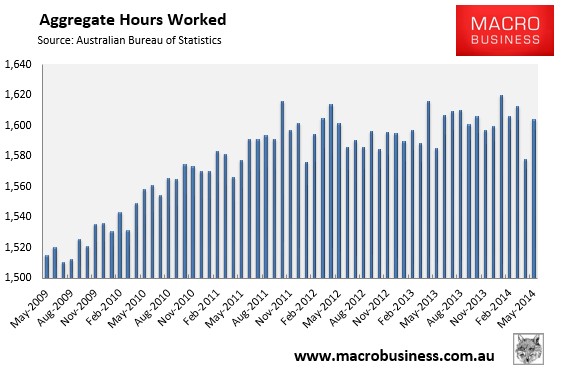
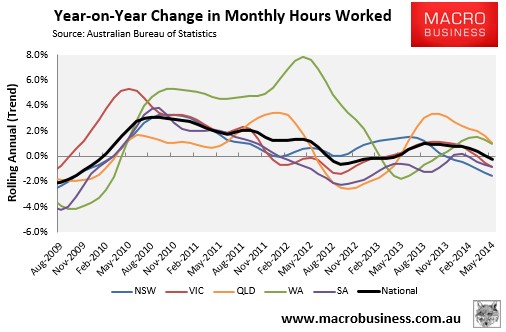
The below chart, which tracks the changes in hours worked on a trend basis, shows a mixed bag across the states and a falling trend nationally (-0.2% YoY):
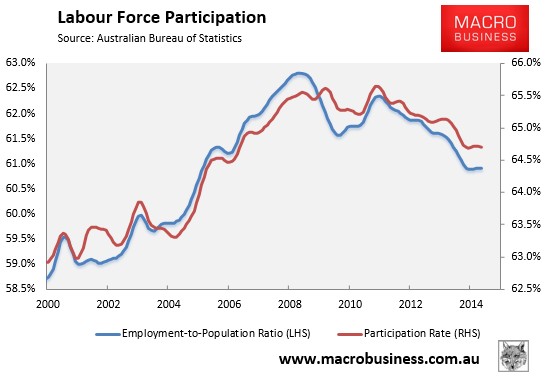
The employment-to-population ratio and the participation rate both fell by 0.1% fell in May, with the former falling to 60.8% and the latter to 64.6% in seasonally-adjusted terms. However, both have stabilised in trend terms, which is positive (see next chart).
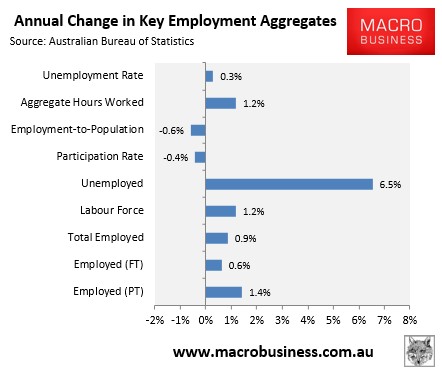
The below chart summarises the annual change in the key employment aggregates on a seasonally-adjusted basis:
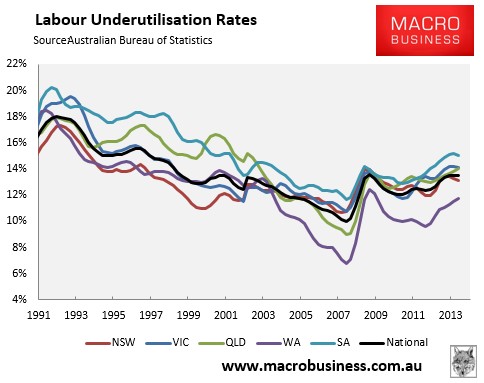
Finally, the national underemployment rate held steady at 13.5% for the third consecutive quarter – remaining more or less at a 15-year high (see next chart).
What the above charts indicate is a soft labour market, whereby employment growth remains positive but at a pace that is insufficient to offset the growing population. And while the headline unemployment rate has fallen slightly since the beginning of the year (from 6.0%), this has been driven by three consecutive monthly falls in the participation rate.
Still, there are some positive signs emerging, including the recent recovery in full-time employment. The labour market has also held up better than many were expecting, and is showing the markings of a modest cyclical pick-up.
The mining cliff awaits, however, which will act as an ongoing headwind to employment. And there is also the recent slump in consumer sentiment, which if maintained could dampen the economy’s rebalancing to the non-mining sectors.
