


By Chris Becker
What a week in macro markets – it’s time again to have a both a closer and long term look from a technical analysis point of view. Here’s the link to last weeks review.
Remember, the following views are my own, do not constitute advice and are for information purposes only. As a full-time private trader, I may have positions in any or all of the below and their associated markets both long and short, on an intra-day, daily and weekly basis for my own account. Please seek advice from a licensed adviser before making any investment decisions.
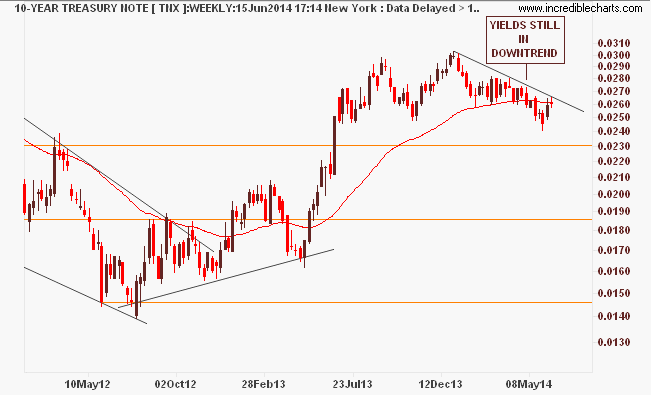
The US bond markets became a safe haven bid last week where the weekly picture remains one of yields falling (prices rising) even as the Fed tapers its purchasing. The FOMC meeting early tomorrow morning should set the course here, with strong support at 2.3%:
US dollar looks to have a tentative breakout on the weekly chart, following my call last week for a daily breakout (all because of euro weakness):
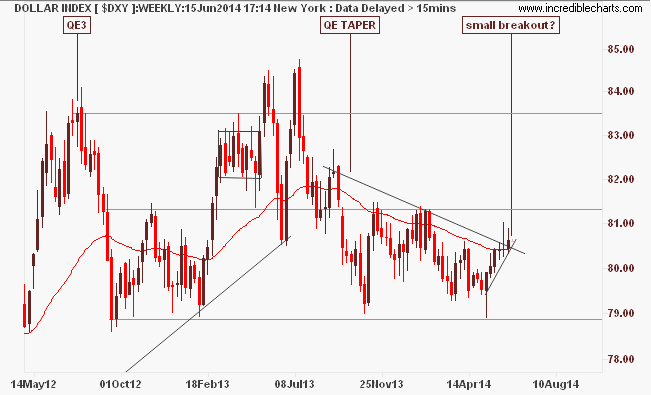
This is likely just a range trade up to resistance at 81 points, as other major pairs – sterling, Kiwi, Aussie – are rallying. Its the composition of the index, which heavily “favours” Euro (i.e the old Mark and Franc) that reflects this.
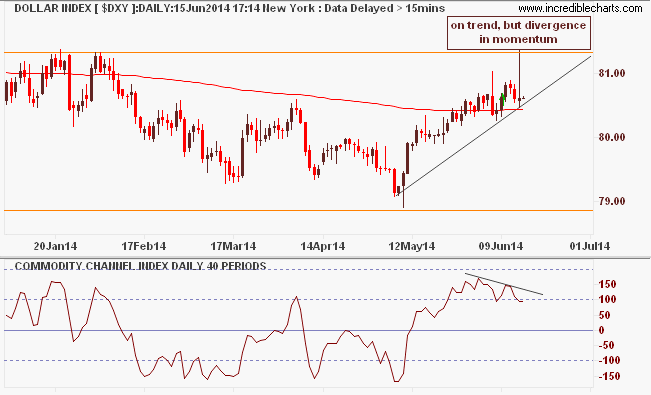
The daily charts suggest the breakout is stalling, whilst price action remains above trend, momentum is tapering, setting up a bearish divergence pattern, even before a test at the 81 resistance level:
Euro (EURUSD) – you shouldn’t rely solely on trendlines for entry/exits or a view about a market, but its hard to equate anything but weakness ahead for euro with the 2 year uptrend well under stress here on the weekly charts:
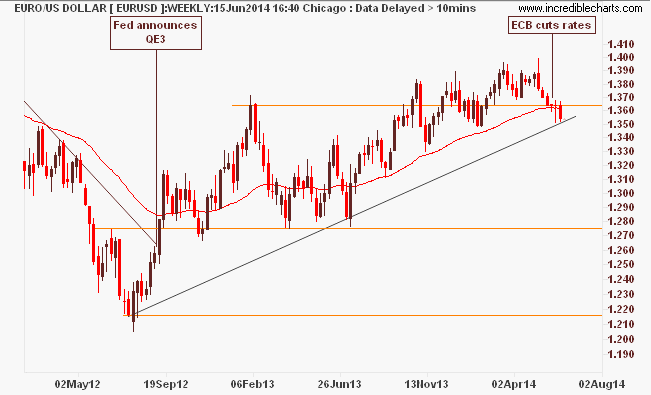
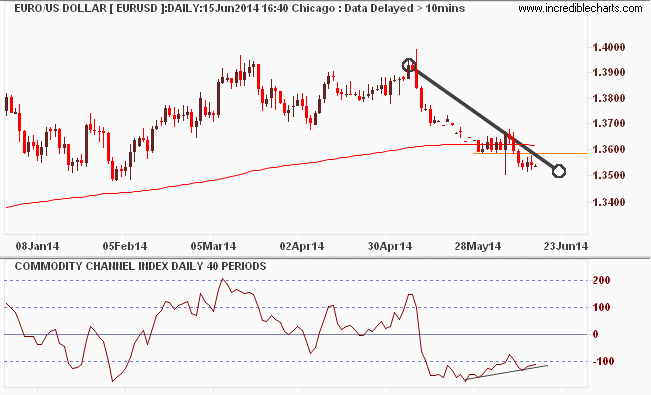
While there’s been a slight pause at the 1.35 support level, the daily downtrend remains intact, if a little oversold (which trends need to be to continue). A closer look at four hourlies show there is plenty of room for another downstep – the CPI release might be the catalyst:
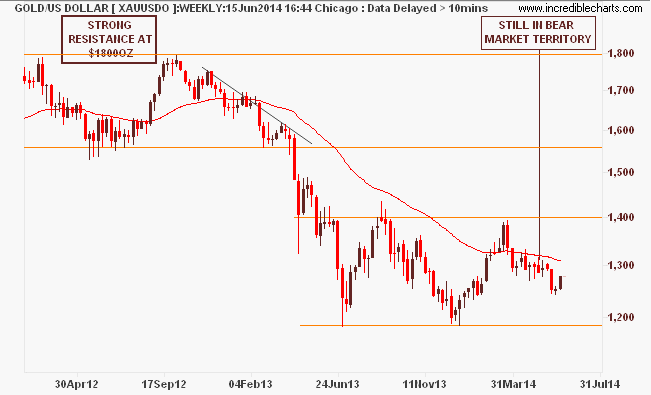
Gold, the un-dollar, still remains in a weekly downtrend after failing to climb above resistance at $1400 per ounce earlier this year, notwithstanding the great rally in the past week:
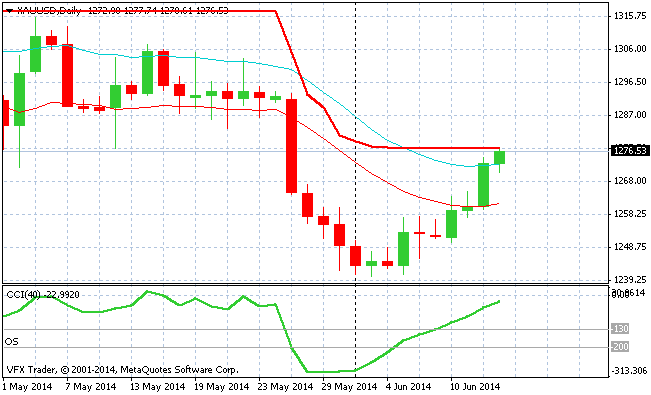
As I said last week, I’d only be bullish on shorter timeframes, as the daily chart is poised to breakout, it still does not have enough chutzpah to warrant a long here:
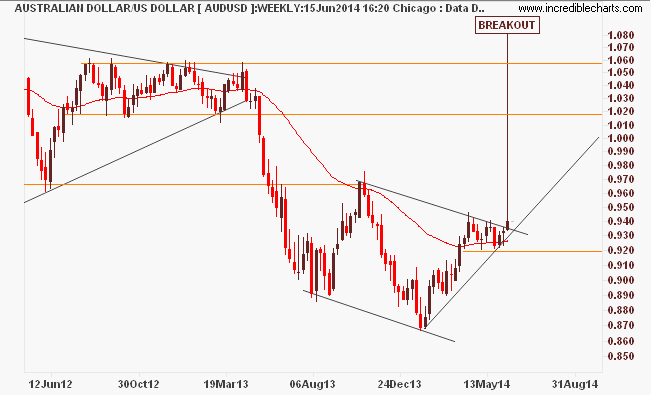
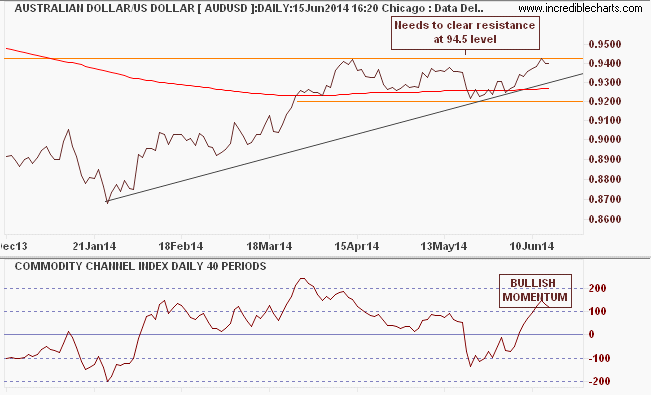
Aussie dollar continues its bear trap, with a tentative upside breakout on the weekly charts after forming strong support at the 92 handle – the move up to parity with a pause at 97 is still on the cards:
On the daily chart, its coming up to resistance just above the 94.5 level and could be forming a bearish double top here – I was long on the four hourlies but am in wait and see mode for now:
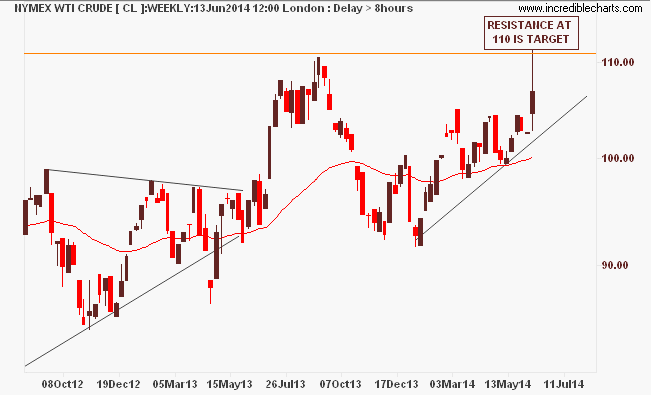
Crude oil (WTI) had an awesome week, breaking out of its short term resistance level to continue its run up to $110 per barrel, where long term resistance abides:
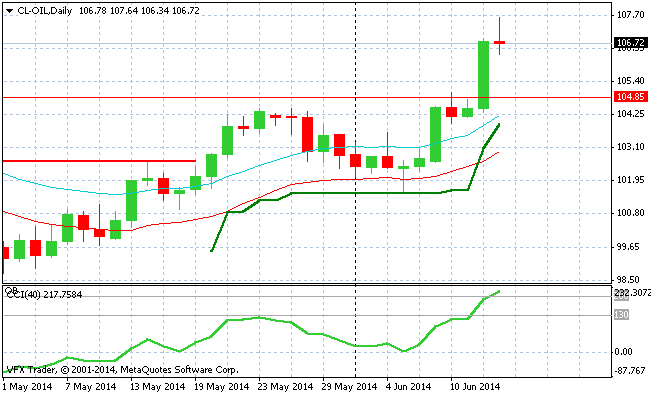
The daily chart shows a very overbought condition and an ominous red cross top for Friday indicating no more buying support, so we could see a small correction early this week:
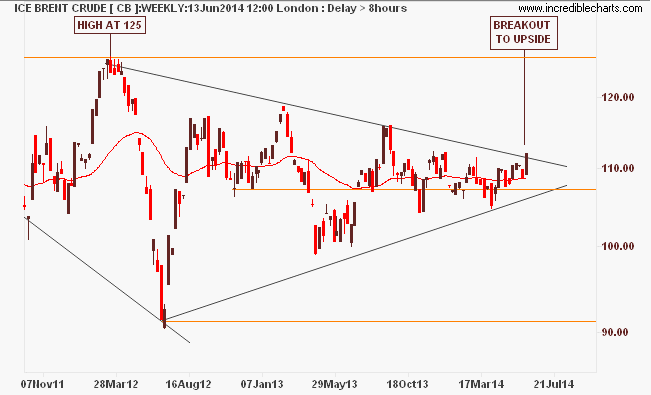
ICE Brent has broken out of its extremely tight range on the weeklies as well – not good for European demand:
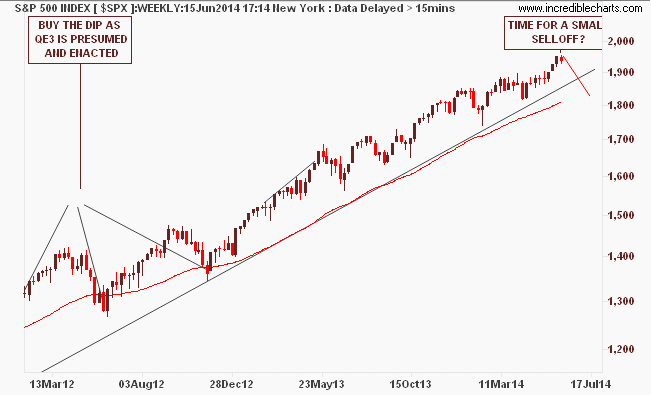
US stock markets – last week I mentioned a possible short term top brewing as the little bubble up bull trap before the usual pre-summer correction was set in place. The weekly trend on the S&P500 (SPX) remains firmly in place:
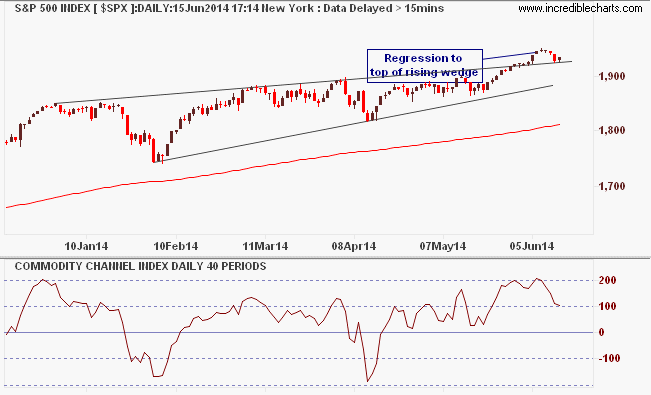
Heres a closer look using daily charts where this very small correction on the back of Middle East chaos almost looks done – although it will require a solid bid early in the week for the SPX to remain overbought and above its bearish rising wedge pattern:
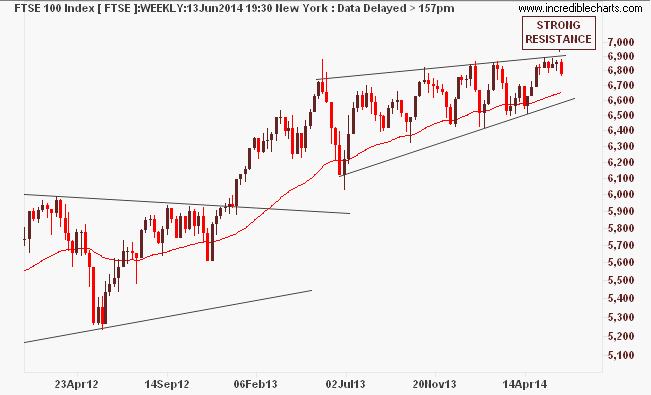
European stock markets are not so sanguine. The FTSE100 cannot overcome strong overhead resistance on its weekly chart:
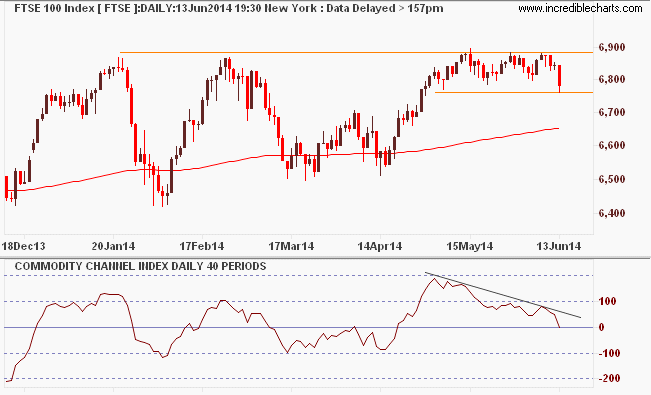
And looks very weak on the daily, poised to break below support (although its oversold on the hourlies) – the 6736 level will be closely watched this week as pound strengthens:
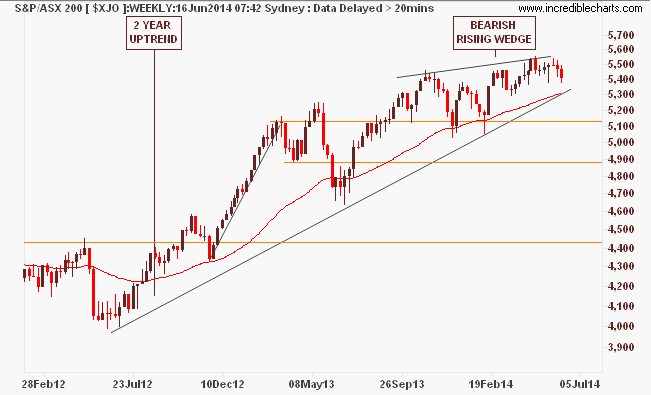
ASX200 (XJO) continues to form a bearish rising wedge pattern on the weekly charts but it only fell 1% last week amidst the iron ore chaos:
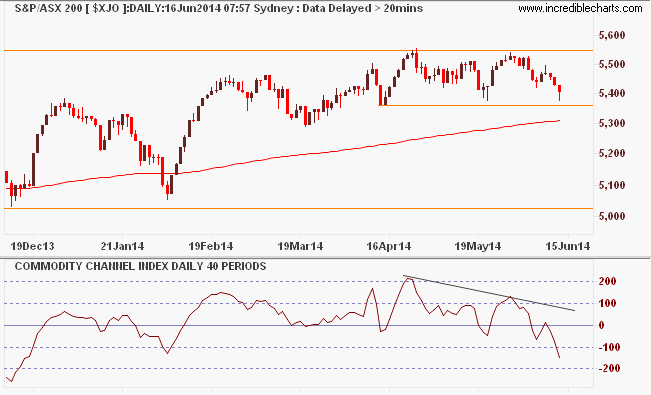
On the dailies, support at 5360 points is critical, although I note long tails (wicks) under the most recent down days indicates some buying support at this level, which may translate into a range upswing here:
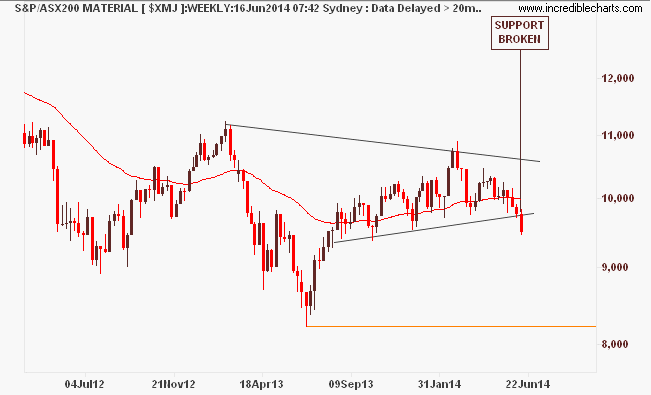
For investors, its not time to get out just yet, unless you own materials stocks, which have fallen straight through weekly support – there is a 20-30% correction in the making here:
Events to watch this week:
- Eurozone CPI release Monday night – this could get euro sold off even further
- FOMC meeting Tuesday early morning – tapering the taper?
- RBA releases minutes Tuesday morning – meh
- UK CPI release Tuesday night – could taper sterlings rapid rise on weak print
- US CPI release Tuesday night
- Eurozone construction figures Wednesday
- US Fed purchases Thursday early morning – watch for USD nexus
- NZ Q1 GDP Thursday morning – should send NZD up on good print
- Eurozone consumer confidence Friday night