Waking up this morning to see a near 4% rise in spot gold when the rest of the stocks/commodity/futures/FX complex snoozes was a pleasant surprise!
But is this the start of a new bull market?
There has been some interesting commentary surrounding the move behind gold. From Chris Weston at IG:
Gold moved up yesterday on a massive position adjustment. The market clearly went into the Fed meeting expecting an acknowledgment of recent inflation forces and didn’t get them. In fact, Yellen said the recent pick-up in inflation was just ‘noise’.
Advertisement
Ruh roh – a central bank governor who thinks inflation is noise is music to gold bugs ears.
More on the technical side from Chris:
Still, while we saw a fundamental position adjustment, good technical buying has been seen on the break of the 55-, 100- and 200-day moving averages, while the April downtrend has also been broken.
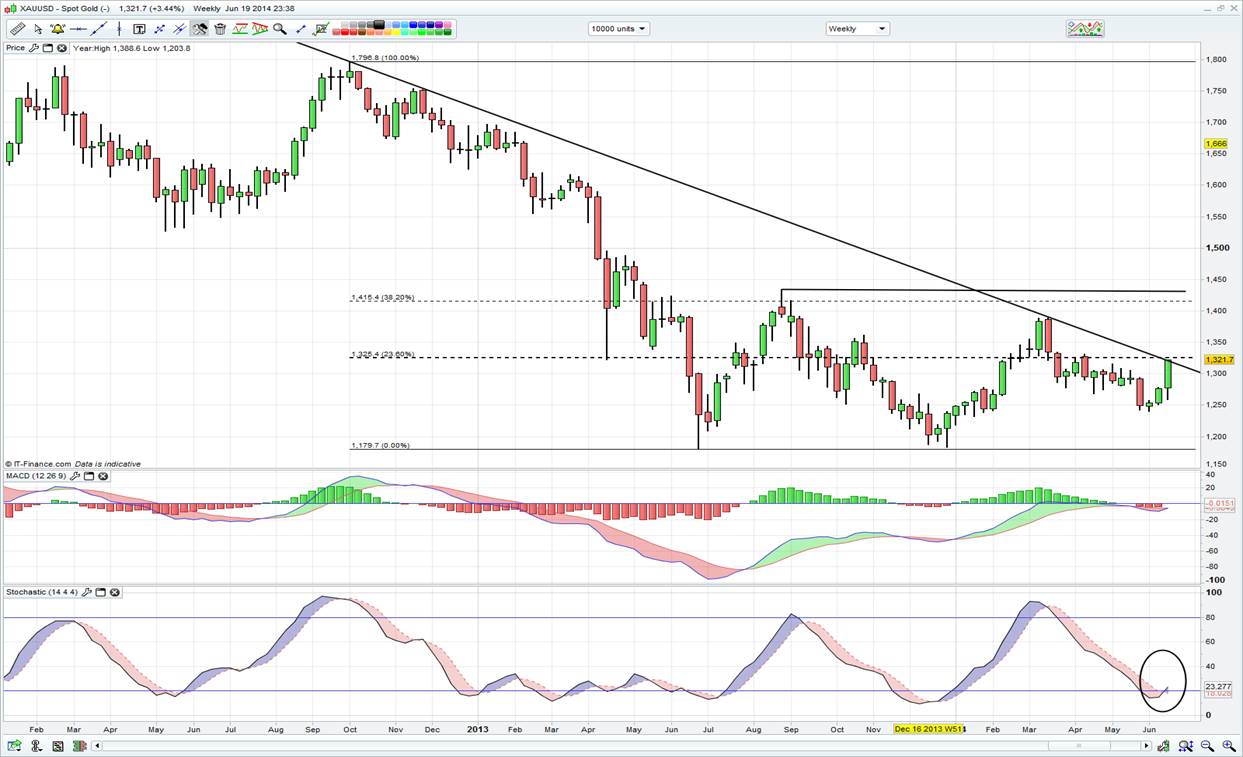
(although) the daily chart may suggest buying dips given the short-term extended nature of price, however the weekly chart seems more interesting to me.
A close tonight above the downtrend would be positive and put the double bottom neckline in play (at $1433). A break of $1433 over the medium-term would target $1684 (based on the double bottom pattern). Fundamentally this seems a stretch, but this a pure technical view.
This longer term view (weekly charts are fantastic by the way) is reinforced by Peter L Brandt, one of my favourite traders, a long term pattern trader who suggests a “massive…bottom” in gold prices: (my emphasis added)
Advertisement
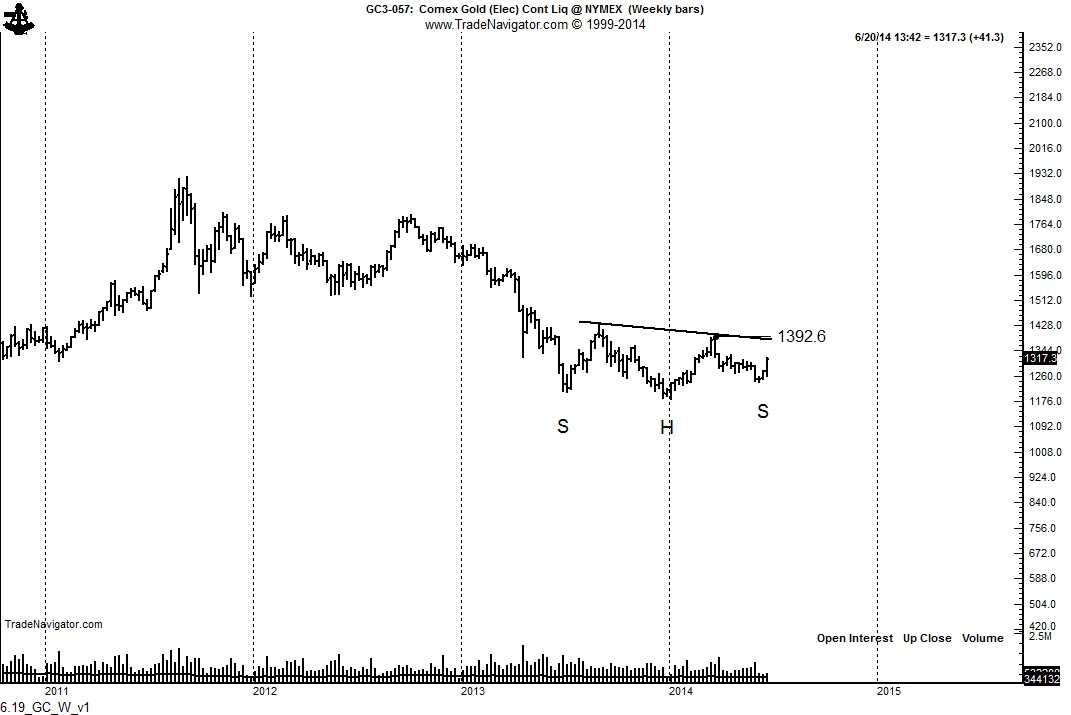
On Sunday, June 15, I issued a Tweet that Gold was forming a possible H&S bottom pattern. See here for chart posted.
The H&S bottom in Gold is now clearly defined on the daily and weekly charts (weekly chart shown). The rally today is strong indication that the right shoulder low is in place. A close above 1400 is required to complete this bottom.
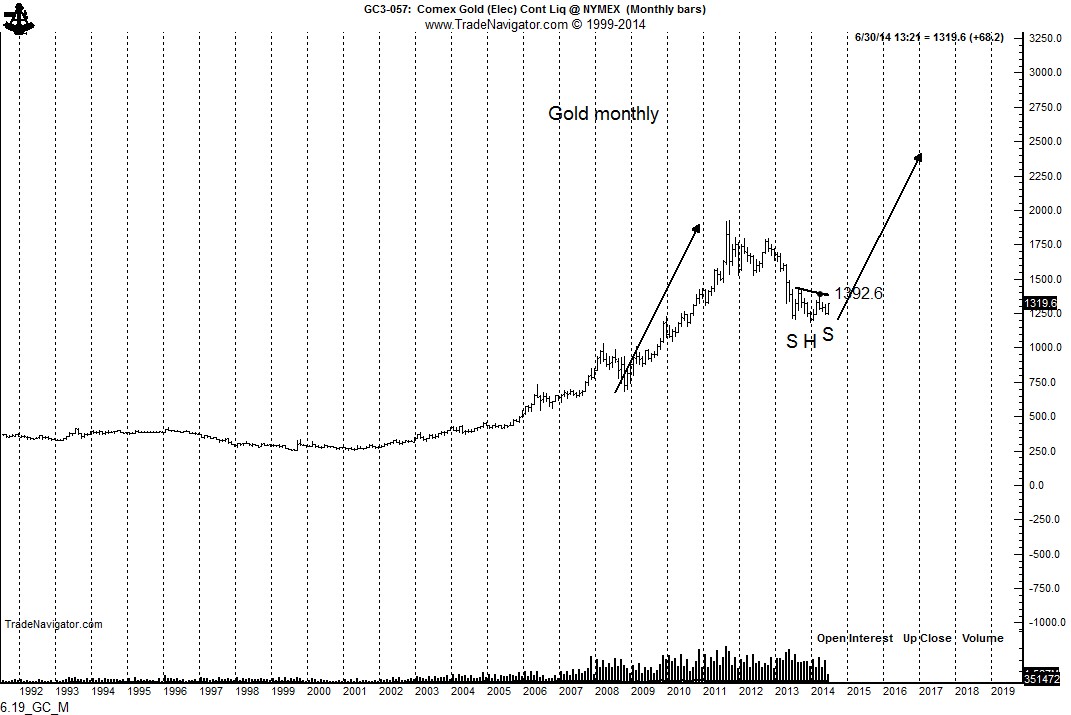
In the event of such a close, the swing target in Gold would become 2,400 as shown on the monthly graph. This swing target assumes that the advance from the Dec 2013 low will equal the advance from late 2008 through Sept 2011. Remember, a H&S bottom is not a H&S bottom until it is completed.
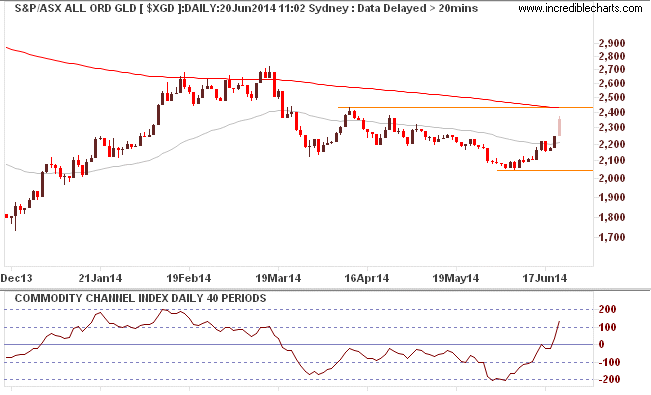
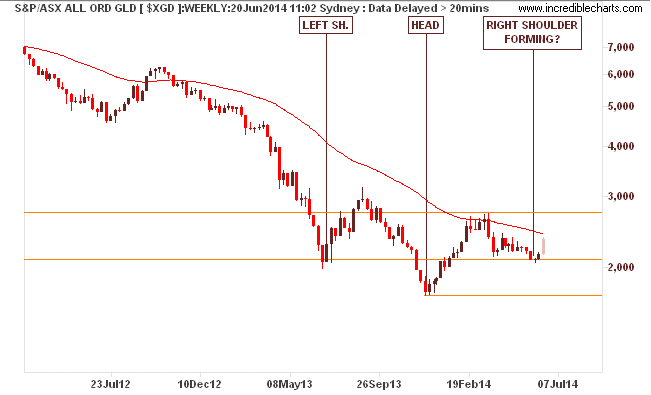
Peter’s analysis is echoed by our own All Ordinaries Gold Index (XGD) which is up 5% today on the open (this index is basically just Newcrest Mining (NCM) which has gobbled up all the other players)
Advertisement
You can clearly see the bullish inverted head and shoulders pattern being formed on the weekly chart – the right shoulder is forming, but not completed – requiring a breakout above 2700 points or $13.50 per NCM share:
There’s always a fly in the ointment, as John Kicklighter shows that big rallies like last night do not have a solid record in presaging sustained uptrends in gold (mind you the look back here is a short period)
Advertisement
But this action has got the gold bugs excited, so while you shouldn’t let your guard down and forget that gold remains in a bear market, this could be the start of a big opportunity in the “un-dollar”.